
Economic and Social Reports
Tax-filing rates of newly landed immigrants in Canada: Trends and insights
DOI: https://doi.org/10.25318/36280001202301100004-eng
Abstract
This study provides insights into the tax-filing behaviour of newly landed immigrants and their families over time in Canada, using the Longitudinal Immigration Database. Tax-filing rates were compared across seven cohorts of permanent residents based on their landing year, ranging from 1993 to 2019. Results indicate a significant improvement in filing rates from the mid-1990s to the late 1990s for individuals as well as families, but the rates have remained fairly stable since then. Descriptive and multivariate analyses reveal differences in filing rates for individuals and couples across several landing characteristics within and between cohorts. Refugees were usually the most likely immigration class to file income tax returns upon landing, while immigrants admitted through the Federal Skilled Worker Program were usually the least likely class to file. Immigrants with graduate degrees at landing were usually less likely to file taxes upon landing, compared with immigrants with lower educational attainment.
Keywords: immigration; tax filing; government transfers; Canada child benefit
Authors
Tahsin Mehdi, Winnie Chan, René Morissette and Rubab Arim are with the Social Analysis and Modelling Division, Analytical Studies and Modelling Branch, at Statistics Canada.
Ying Gai, Jason Raymond and Dylan Saunders are with the Strategic Research and Performance Division, Research and Innovation Lab, Service, Innovation and Integration Branch, at the Canada Revenue Agency.
Acknowledgements
This study was funded by Canada Revenue Agency. The authors would like to thank Li Xue, Feng Hou and Eric Olson from Statistics Canada and Libbie Wallace and other reviewers from Canada Revenue Agency for their helpful and constructive comments.
Introduction
There is considerable policy interest in engaging hard-to-reach populations in Canada and integrating them into the tax system so they can receive the benefits put in place to support them. The Office of the Auditor General of Canada (2022) noted that “a clear and complete picture of the people who were not receiving benefits for which they were potentially eligible” has been lacking. In addition, its report stated that “estimates overstated the take-up of benefits because they did not always account for people who had not filed tax returns, which are required to access most benefits.” This study takes an important step toward addressing this knowledge gap by examining the tax-filing behaviour of a hard-to-reach population group—newly landed immigrants.
Newly landed immigrants may not file taxes right away because it takes time to fully settle in a new country. Providing them with a financial support structure helps ensure that they become contributing members of society, especially at a time when Canada is relying on immigration to address labour supply issues (Statistics Canada, 2022a). For example, one of the most accessible benefits available to families with young children is the Canada child benefit (CCB), which is a tax-free payment that was introduced in 2016. The CCB is available to all families with children younger than 18 years, as long as parents or guardians file income tax returns.Note Estimates of the number of CCB recipients can be obtained from tax records. The number of eligible recipients who should have received the benefit but did not is unknown.
One obvious strategy is to identify tax filers among a purposefully selected group of potentially eligible beneficiaries (i.e., families with children younger than 18 years).
Prior to the complex task of establishing the pool of eligible beneficiaries, a comprehensive understanding of the general tax-filing behaviour of immigrants is needed at the individual and family levels. At the individual level, this study will answer the following research questions:
- What percentage of newly landed immigrants file an income tax return in the year of landing or the year after?
- What percentage of newly landed immigrants do not appear on tax files for at least 5 years since landing and 10 years since landing?
- How do the percentages in questions 1 and 2 vary across cohorts of immigrants?
- How do the percentages in questions 1 to 3 vary across landing characteristics?
At the family level:
- What percentage of newly landed immigrant couples, with children younger than 18, had both spouses filing income tax returns in the year of landing or the year after?
- How does the percentage in question 5 vary across cohorts of immigrants?
- How do the percentages in questions 5 and 6 compare with immigrant couples with no children younger than 18?
- How do the answers to questions 5 to 7 vary across landing characteristics of the principal applicant in these families?
Establishing a pool of beneficiaries is not a straightforward process by any means. Some immigrants may move back to their country of origin or get jobs outside Canada, so emigration of immigrants poses a significant challenge. Moreover, international migration has become increasingly fluid, and the line between temporary and permanent migration has become blurred (Qiu, Hou, and Crossman, 2021). This raises the question of whether to include immigrants who leave Canada as part of the target population of beneficiaries. The transitory nature of international migration makes it difficult to accurately identify emigrants. In the absence of a direct data source on immigrants exiting Canada, studies rely on indirect estimation methods—much of which treat emigration as a permanent move, based on the disappearance of immigrants from the tax system for, e.g., t consecutive years (Qiu, Hou, and Crossman 2021).
Data and samples
This study combines data from the Longitudinal Immigration Database (IMDB) and the T1 personal master file (T1PMF). The IMDB is an immigrant landing file containing a record of all immigrants who landed in Canada from 1980 onward (Evra and Prokopenko, 2022). The T1PMF is a dataset consisting of the T1 individual income tax return records of Canadian tax filers who submitted their returns before an assessment date.Note Absence from the T1PMF does not necessarily mean that an individual is absent from the tax system entirely; there are instances where some individuals who receive taxable benefits or employment income are not captured in the T1PMF. They may be captured by other tax records, such as the T4 if they are employed, or other tax files (Qiu, Hou, and Crossman, 2021).
The sample used in this study was based on seven landing cohorts of permanent residents in the IMDB, aged 25 to 64, who landed from 1993 to 2019.Note The immigrant cohorts were pooled based on landing year, and the sample sizes were as follows: 507,800 from 1993 to 1996, 477,200 from 1997 to 2000, 568,300 from 2001 to 2004, 607,700 from 2005 to 2008, 647,800 from 2009 to 2012, 694,300 from 2013 to 2016 and 619,600 from 2017 to 2019. If an immigrant landed in year t, then they were considered a tax filer if they were found on the T1PMF in year t or year t + 1. Because it can take some time to identify social insurance numbers (SINs) in the IMDB for newly landed immigrants, tax-filing rates for the 2017‑to‑2019 landing cohort might be slightly underestimated.
Filing rates were disaggregated by various landing characteristics, including sex, age, education at landing, immigration class, official language skills, destination province or territory, and source region of the immigrant. Seven broad immigration classes were considered: the Federal Skilled Worker Program (FSWP), provincial programs, the Canadian Experience Class (CEC), other economic classes (economic classes other than the FSWP, provincial programs and the CEC), the family class, refugees and all other classes. At the family level, the sample was restricted to couples who landed together, as identified by the IMDB case ID. The landing characteristics of the principal applicant were used to produce disaggregated tax-filing rates. If spouses landed together in year t, they were considered to have filed if both were found on the T1PMF in year t or year t + 1.
Tax-filing rates among newly landed immigrants have improved since the mid-1990s
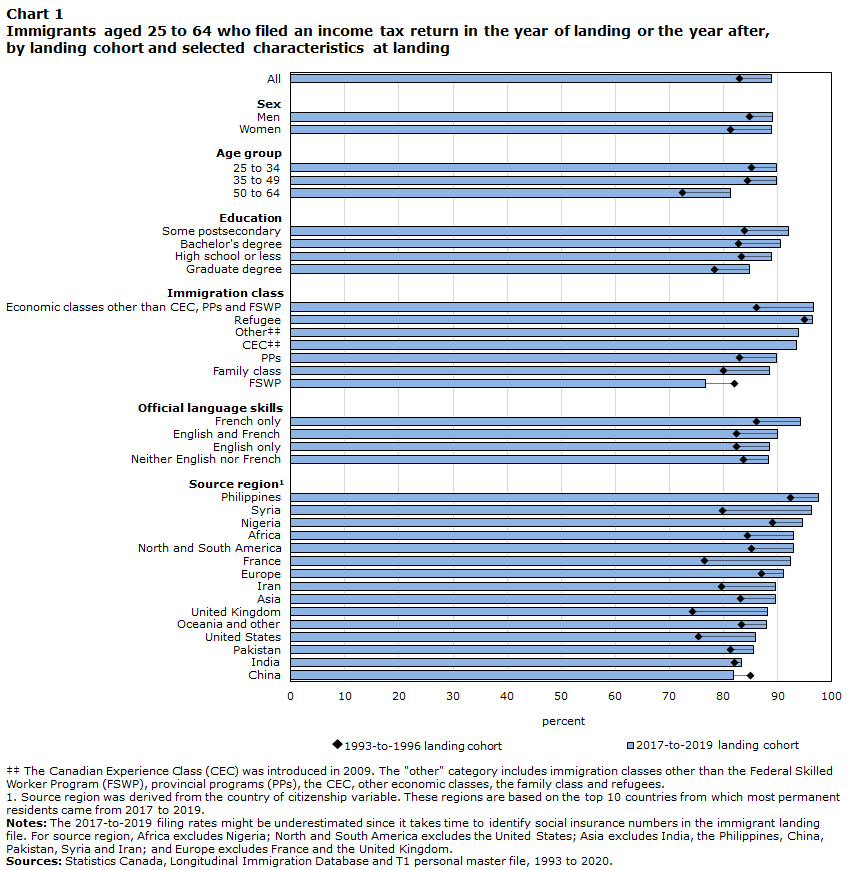
On average, there has been a general improvement in tax-filing rates among newly landed immigrants since the mid-1990s. Around 89% of immigrants from the 2017-to-2019 landing cohort filed an income tax return in the year of landing or the year after (Table 1). This is markedly higher than the rate observed for the 1993-to-1996 landing cohort (83%) and marginally higher than the rates observed for most of the subsequent cohorts. However, there is considerable variation in filing rates across landing characteristics. Men were more likely to file than women in the early 1990s. For instance, 85% of men from the 1993‑to‑1996 landing cohort filed an income tax return, compared with 81% of women. This gap in filing rates started narrowing in the 2000s. The filing rates for women (89%) and men (89%) from the 2017‑to‑2019 cohort were identical. Individuals aged 25 to 49, who accounted for the vast majority of newly landed immigrants, were more likely to file than those aged 50 to 64, regardless of landing cohort.
Refugees were among the most likely to file an income tax return, while federal skilled workers were among the least likely
One of the biggest sources of disparities in tax-filing rates within and across cohorts was immigration class (Chart 1). Of all the immigration classes considered in this study, refugees usually had the highest filing rates upon landing. The percentage of refugees, regardless of whether they were sponsored privately or by the government, who filed an income tax return in the year of landing or the year after was close to 95% or higher across cohorts.Note So, a sizable segment of that group is well represented in the tax system and can potentially start receiving the benefits put in place to support them.
Newly landed immigrants who were usually the least likely to file an income tax return upon landing were those admitted through the FSWP, regardless of landing year.Note Filing rates for this group ranged from 82% to 85% in the 1990s and early 2000s but have dropped to 80% or lower since then. The filing rate for the 2017-to-2019 cohort was 77%, which was significantly lower than for provincial programs (90%), the CEC (93%), other economic classes (97%), the family class (89%), refugees (96%) and all other classes (94%). This difference in rates could be related to certain classes being less likely than others to have their SINs identified in tax files (Qiu, Hou, and Crossman, 2021).Note The differences in filing rates might also be attributed to varying access to settlement services aimed at integrating newly landed immigrants into Canada. Notably, refugees were the immigration class most likely to use settlement services, including the Resettlement Assistance Program available to them exclusively (Statistics Canada, 2022b).
The FSWP does not apply to Quebec because it has its own immigration programs. Skilled workers intending to live in Quebec are admitted through the skilled worker program implemented by the Quebec government. The tax-filing rate for Quebec’s skilled worker program was 91% among the 2017-to-2019 cohort.
Immigration class also turns out to be an important factor in explaining discrepancies in filing rates across some other dimensions, such as the official language skills of the immigrant. For instance, “French only” speakers consistently had the highest filing rates, compared with those who spoke only English, both English and French, and neither English nor French. But this can be partly explained by the fact that the “French only” category had proportionately fewer immigrants from the FSWP and more from Quebec’s skilled worker program.
Quebec had the highest tax-filing rate among the three most popular destinations for immigrants who landed from 2017 to 2019
About 14% of immigrants aged 25 to 64 who landed from 2017 to 2019 indicated Quebec as their destination province or territory. This compares with 15% for British Columbia and 43% for Ontario. Destination province or territory reflects only the intended place of residence at landing and does not necessarily mean that the individual remained there after landing.Note
Among the 2017-to-2019 landing cohort, the filing rate was 90% for those who indicated Quebec as their destination province or territory, compared with 89% in British Columbia and 87% in Ontario, which was the lowest rate observed among all destination provinces or territories.Note The difference in filing rates between Ontario and Quebec narrows when controlling for landing characteristics, with immigration class explaining most of the difference.
Data table for Chart 1
| 2017-to-2019 landing cohort | 1993-to-1996 landing cohort | |
|---|---|---|
| percent | ||
| All | 89 | 83 |
| Sex | ||
| Men | 89 | 85 |
| Women | 89 | 81 |
| Age group | ||
| 25 to 34 | 90 | 85 |
| 35 to 49 | 90 | 85 |
| 50 to 64 | 81 | 72 |
| Education | ||
| Some postsecondary | 92 | 84 |
| Bachelor's degree | 91 | 83 |
| High school or less | 89 | 83 |
| Graduate degree | 85 | 78 |
| Immigration class | ||
| Economic classes other than CEC, PPs and FSWP | 97 | 86 |
| Refugee | 96 | 95 |
| OtherData table for chart 1 Note ‡‡ | 94 | Note ..: not available for a specific reference period |
| CECData table for chart 1 Note ‡‡ | 93 | Note ..: not available for a specific reference period |
| PPs | 90 | 83 |
| Family class | 89 | 80 |
| FSWP | 77 | 82 |
| Official language skills | ||
| French only | 94 | 86 |
| English and French | 90 | 82 |
| English only | 89 | 82 |
| Neither English nor French | 88 | 84 |
| Source regionData table for chart 1 Note 1 | ||
| Philippines | 98 | 92 |
| Syria | 96 | 80 |
| Nigeria | 95 | 89 |
| Africa | 93 | 85 |
| North and South America | 93 | 85 |
| France | 92 | 76 |
| Europe | 91 | 87 |
| Iran | 90 | 80 |
| Asia | 90 | 83 |
| United Kingdom | 88 | 74 |
| Oceania and other | 88 | 83 |
| United States | 86 | 75 |
| Pakistan | 86 | 81 |
| India | 83 | 82 |
| China | 82 | 85 |
.. not available for a specific reference period
Sources: Statistics Canada, Longitudinal Immigration Database and T1 personal master file, 1993 to 2020. |
||
Highly educated immigrants and federal skilled workers were among the groups least likely to file an income tax return for extended periods
Roughly 8% of immigrants who landed from 2009 to 2012 did not file an income tax return for at least five years after they landed (Table 1). This is an improvement from the 1993-to-1996 cohort, which had a long-term non-filing rate of 12%.
Differences in long-term non-filing rates were most notable by educational attainment and immigration class. About 13% of immigrants with graduate degrees who landed from 2009 to 2012 did not file an income tax return for at least five years since landing. This is down by roughly 4 percentage points, compared with those who landed from 1993 to 1996. The rate was similar for federal skilled workers. Since highly skilled individuals could potentially have employment opportunities outside Canada, it is possible that they moved out of the country. This could help explain why proportionately more of them did not file taxes for extended periods. However, without integrating any reliable data sources on emigration, this is difficult to say with any degree of certainty.
Immigrants who did not file a tax return within at least five years since landing were unlikely to file in the next five years. For instance, among the 2005-to-2008 landing cohort who did not file an income tax return within at least five years since landing, about 95% did not file in the next five years either. Even if late filers are accounted for, these long-term non-filing rates persist. These rates should be interpreted only as an upper bound for the percentage of immigrants who might have left Canada because some non-filers can still potentially be found in other tax records.
Most of the differences in tax-filing rates across landing characteristics of newly landed immigrants remain, even after controlling for other factors
All else equal, most of the observed differences in filing rates across landing characteristics remain in multivariate analyses. Because the focus is on explaining non-filing rates, Table 2 presents the average partial effects from a logistic regression model with a binary dependent variable set equal to 1 if the individual did not file a tax return in the year of landing or the year after, and 0 otherwise. The same set of covariates is used as in Table 1. Official language skills and source region are likely to be correlated, so two sets of results are reported for the model with controls—one that excludes source regions and one that excludes official language skills.
The cohort effects for the 1997-to-2000 and 2001-to-2004 cohorts change signs, shifting from the baseline model (positive) to the models with controls (negative), and they remain significant. Contrary to the descriptive results, the multivariate results suggest that, all else equal, these cohorts were actually more likely to file a tax return relative to the 2017-to-2019 cohort (albeit by 1 percentage point at most). This finding can be mostly explained by the decrease over time in the share of immigrants who are federal skilled workers, a group that has a relatively low propensity to file.
The baseline model for education suggests that, on average, immigrants with graduate degrees at landing were around 7 percentage points less likely to file, compared with immigrants with bachelor’s degrees. This partial effect decreases to 4 percentage points at most, even after controlling for other factors. Similarly, immigrants admitted through the FSWP were about 9 percentage points less likely to file, compared with those admitted through provincial programs, and this difference persists after controlling for other landing characteristics.
Contrary to the descriptive results indicating that Ontario had the lowest filing rates, the differences between Ontario and Prince Edward Island, Nova Scotia, New Brunswick and Quebec are reduced or gone entirely after controlling for other landing characteristics (reversal of the signs on the average partial effects or they become insignificant).
Although descriptive statistics indicated a general improvement in filing rates over time, the improvements are not uniform across immigration classes. The multivariate models from Table 2 were estimated separately by immigration class to discern whether filing rates have improved across immigration classes after controlling for other factors. Results suggest that, except for the FSWP, filing rates started improving after the 1993-to-1996 landing cohort and have remained fairly stable.
Tax-filing rates of newly landed immigrant couples have improved since the mid-1990s, but differences exist across landing characteristics
Filing rates for couples were generally lower than those for individuals because both spouses need to file income tax returns to be considered a tax-filing family. Around 84% of immigrant couples who landed from 2017 to 2019 filed income tax returns in the year of landing or the year after (Table 3).Note This is a 7 percentage point improvement over the 1993-to-1996 cohort. However, filing rates for individuals and couples increased in the late 1990s and have remained fairly stable, so the extent of the improvements in filing rates is less pronounced when comparing most of the subsequent cohorts.
For couples to access the CCB, they generally need to have children younger than 18 years, and both spouses need to file income tax returns. Immigrant couples with children younger than 18 were more likely to file income tax returns across landing cohorts prior to 2009, compared with other immigrant couples, but this gap in filing rates narrowed in subsequent cohorts. Around 85% of immigrant couples with children younger than 18 from the 2017-to-2019 cohort filed income tax returns in the year of landing or the year after. This means that 15% did not file and, therefore, may not have accessed the CCB (Chart 2).Note However, this percentage should be viewed only as an upper bound for the percentage of couples who potentially should have received the CCB but did not. While some of these potentially eligible couples do not appear in the T1PMF, they might have accessed the benefit through other means or retroactively, by filing late.
The filing patterns found for individual immigrants were largely prevalent among couples as well. Couples with a refugee as the principal applicant had filing rates exceeding 95% across most of the cohorts, making them the most likely immigration class to file. Couples where the principal applicant was a federal skilled worker had filing rates closer to 75% in the four most recent cohorts, making them the least likely class to file.Note
All else equal, some of the differences in filing rates of couples across landing characteristics, such as education and immigration class of the principal applicant, remained in the multivariate analyses. Table 4 reports average partial effects, similar to Table 2, except the unit of analysis is the family, with the dependent variable set equal to 1 if at least one spouse did not file taxes in the year of landing or the year after, and 0 otherwise. All else considered, the models show that immigrant couples with children younger than 18 were about 5 percentage points more likely to file income tax returns than other couples. Couples where the principal applicant had a graduate degree were 8 percentage points less likely to file, compared with bachelor’s degree holders, and the average partial effect drops to as low as 5 percentage points when controlling for other factors. FSWP couples were 9 percentage points less likely to file, compared with couples admitted through provincial programs, and this did not change when controlling for other landing characteristics. Although the baseline models indicate that couples from the family class and “other” classes were less likely to file, compared with couples from provincial programs, the differences vanish when controlling for other landing characteristics, particularly age. This entirely explains the difference in filing rates between the family class (which tends to be overrepresented among older couples) and provincial programs. However, the family class and “other” classes did not account for a sizable share of immigrant couples in any of the cohorts because these immigration classes tended to be the two least common classes, accounting for less than 10% of immigrant couples from 1993 to 2019.
Contrary to the descriptive results indicating that couples destined for Ontario (82%) had among the lowest filing rates of all the provinces or territories, controlling for other landing characteristics results in the difference in rates between Ontario and Prince Edward Island, Nova Scotia, New Brunswick and Quebec narrowing or becoming statistically insignificant.Note Differences in filing rates across the source regions of principal applicants largely persisted in the multivariate analyses, with the only notable exception being the United Kingdom. Principal applicants from this country had a higher filing rate than those from the United States, according to the descriptive results, but the difference disappears all else considered.

Data table for Chart 2
| 2017-to-2019 landing cohort | 1993-to-1996 landing cohort | |
|---|---|---|
| percent | ||
| All | 85 | 84 |
| Age group | ||
| 25 to 34 | 84 | 86 |
| 35 to 49 | 86 | 84 |
| 50 to 64 | 87 | 78 |
| Education | ||
| High school or less | 92 | 86 |
| Some postsecondary | 91 | 84 |
| Bachelor's degree | 87 | 84 |
| Graduate degree | 79 | 78 |
| Immigration class | ||
| Refugee | 96 | 97 |
| Economic classes other than CEC, PPs and FSWP | 94 | 82 |
| OtherData table for chart 2 Note ‡‡ | 92 | Note ..: not available for a specific reference period |
| CECData table for chart 2 Note ‡‡ | 88 | Note ..: not available for a specific reference period |
| PPs | 85 | 86 |
| FSWP | 74 | 83 |
| Official language skills | ||
| French only | 94 | 89 |
| Neither English nor French | 91 | 89 |
| English and French | 86 | 84 |
| English only | 84 | 81 |
| Source regionData table for chart 2 Note 1 | ||
| Philippines | 96 | 90 |
| Syria | 96 | 81 |
| Nigeria | 94 | 88 |
| Africa | 91 | 84 |
| North and South America | 91 | 83 |
| Iran | 91 | 84 |
| Europe | 89 | 91 |
| France | 88 | 75 |
| Asia | 86 | 84 |
| United Kingdom | 83 | 76 |
| United States | 81 | 65 |
| Oceania and other | 80 | 88 |
| Pakistan | 78 | 83 |
| India | 78 | 82 |
| China | 64 | 84 |
.. not available for a specific reference period
Sources: Statistics Canada, Longitudinal Immigration Database and T1 personal master file, 1993 to 2020. |
||
Concluding remarks
This study offers some insights into the tax-filing behaviour of newly landed immigrants, which might help inform the effectiveness of using tax filing as a method of measuring benefit take-up for hard-to-reach populations. It provided an overview of the tax-filing trends of newly landed immigrants aged 25 to 64 who landed from 1993 to 2019. Filing rates generally improved during the 1990s and have since remained fairly stable. Close to 90% of immigrants who arrived in Canada from 2017 to 2019 filed an income tax return in the year of landing or the year after. This rate was 83% among immigrants who arrived from 1993 to 1996. However, filing rates varied to a great extent across landing characteristics.
Immigration class was one of the most important predictors in explaining differences in filing rates. Refugees usually had the highest filing rates, while federal skilled workers had the lowest rates. Federal skilled workers and immigrants with graduate degrees were also among the groups least likely to file an income tax return for extended periods since landing.
Immigrant couples with children younger than 18 years were more likely than other immigrant couples to file income tax returns across landing cohorts prior to 2009, but the gap in filing rates narrowed in subsequent years. Around 85% of immigrant couples with children younger than 18 from the 2017‑to‑2019 cohort filed income tax returns in the year of landing or the year after. Regardless of the presence of young children, differences in filing rates persisted across education levels and, to a greater extent, immigration classes.
This study comes with a set of limitations, which may underestimate or overestimate the pool of potential beneficiaries who are newly landed immigrants. Tracking family dynamics upon landing, such as births or reunification with a non-immigrant spouse, poses a challenge. International emigration of immigrants, which might vary across immigration classes, cannot be measured with any degree of certainty, also posing a challenge. Future analyses will need to account for these limitations and might benefit from integrating complementary data sources, such as the Census of Population, to assess the relative importance of some of these more complex scenarios.
| Filed an income tax return in the year of landing or the year after | Did not file an income tax return within at least 5 years since landing | Did not file an income tax return within at least 10 years since landing | ||||||||||||||
|---|---|---|---|---|---|---|---|---|---|---|---|---|---|---|---|---|
| 1993 to 1996 | 1997 to 2000 | 2001 to 2004 | 2005 to 2008 | 2009 to 2012 | 2013 to 2016 | 2017 to 2019 | 1993 to 1996 | 1997 to 2000 | 2001 to 2004 | 2005 to 2008 | 2009 to 2012 | 1993 to 1996 | 1997 to 2000 | 2001 to 2004 | 2005 to 2008 | |
| percent | ||||||||||||||||
| Demographic characteristics at landing | ||||||||||||||||
| All | 82.9 | 86.3 | 86.4 | 85.1 | 86.7 | 90.4 | 88.9 | 11.7 | 9.6 | 8.9 | 9.5 | 7.8 | 10.5 | 9.0 | 8.4 | 9.1 |
| Sex | ||||||||||||||||
| Women | 81.3 | 85.1 | 86.3 | 85.5 | 87.0 | 90.6 | 88.9 | 12.4 | 10.1 | 8.8 | 9.1 | 7.4 | 10.9 | 9.3 | 8.2 | 8.6 |
| Men | 84.8 | 87.4 | 86.5 | 84.6 | 86.4 | 90.1 | 89.0 | 10.9 | 9.1 | 9.1 | 10.0 | 8.2 | 10.1 | 8.6 | 8.7 | 9.6 |
| Age group | ||||||||||||||||
| 25 to 34 | 85.2 | 86.9 | 86.2 | 85.7 | 88.3 | 91.8 | 89.7 | 10.4 | 9.6 | 9.5 | 9.7 | 7.0 | 9.7 | 9.1 | 9.1 | 9.3 |
| 35 to 49 | 84.5 | 86.8 | 87.2 | 85.0 | 85.8 | 89.9 | 89.7 | 10.8 | 9.2 | 8.1 | 9.3 | 8.2 | 9.9 | 8.6 | 7.7 | 8.9 |
| 50 to 64 | 72.4 | 80.9 | 83.9 | 82.9 | 82.6 | 85.2 | 81.2 | 18.0 | 11.5 | 9.0 | 9.6 | 9.8 | 14.4 | 9.6 | 7.8 | 8.8 |
| Education | ||||||||||||||||
| High school or less | 83.4 | 87.5 | 89.9 | 89.8 | 89.4 | 92.0 | 88.9 | 10.8 | 7.9 | 6.0 | 5.8 | 6.1 | 9.2 | 7.1 | 5.4 | 5.3 |
| Some postsecondary | 83.9 | 87.2 | 89.0 | 89.1 | 89.9 | 92.7 | 92.0 | 11.2 | 8.7 | 6.7 | 6.4 | 5.7 | 10.2 | 8.0 | 6.1 | 6.0 |
| Bachelor's degree | 82.8 | 87.0 | 86.1 | 84.9 | 87.2 | 90.9 | 90.6 | 12.1 | 9.1 | 9.2 | 9.4 | 7.3 | 11.2 | 8.6 | 8.8 | 9.0 |
| Graduate degree | 78.3 | 80.5 | 79.8 | 75.4 | 78.6 | 85.7 | 84.7 | 16.7 | 15.5 | 14.5 | 17.5 | 13.3 | 15.8 | 14.9 | 14.0 | 17.0 |
| Immigration class | ||||||||||||||||
| Federal Skilled Worker Program | 82.1 | 84.5 | 82.9 | 75.5 | 76.4 | 80.7 | 76.7 | 13.4 | 11.7 | 11.8 | 16.4 | 13.5 | 12.6 | 11.2 | 11.4 | 15.9 |
| Provincial programs | 83.0 | 87.9 | 89.1 | 88.4 | 88.9 | 90.9 | 89.8 | 12.7 | 8.8 | 7.6 | 7.6 | 7.1 | 12.0 | 8.4 | 7.3 | 7.3 |
| Canadian Experience ClassTable 1 Note 1 | Note ..: not available for a specific reference period | Note ..: not available for a specific reference period | Note ..: not available for a specific reference period | Note ..: not available for a specific reference period | 92.2 | 93.9 | 93.4 | Note ..: not available for a specific reference period | Note ..: not available for a specific reference period | Note ..: not available for a specific reference period | Note ..: not available for a specific reference period | 4.3 | Note ..: not available for a specific reference period | Note ..: not available for a specific reference period | Note ..: not available for a specific reference period | Note ..: not available for a specific reference period |
| Other economic classes | 86.0 | 85.2 | 89.7 | 91.4 | 92.2 | 96.1 | 96.6 | 9.3 | 10.1 | 6.4 | 5.4 | 4.6 | 8.4 | 9.4 | 6.0 | 5.2 |
| Family class | 80.0 | 85.0 | 86.9 | 88.9 | 88.8 | 90.3 | 88.5 | 12.7 | 9.2 | 7.8 | 6.3 | 6.3 | 10.8 | 8.1 | 6.9 | 5.6 |
| Refugee | 94.9 | 96.0 | 96.2 | 96.3 | 96.4 | 97.3 | 96.4 | 2.5 | 2.1 | 2.0 | 1.8 | 2.1 | 2.0 | 1.7 | 1.7 | 1.6 |
| Other | Note x: suppressed to meet the confidentiality requirements of the Statistics Act | 95.3 | 92.2 | 94.1 | 94.7 | 96.0 | 93.9 | Note x: suppressed to meet the confidentiality requirements of the Statistics Act | 2.6 | 3.4 | 2.5 | 2.1 | Note x: suppressed to meet the confidentiality requirements of the Statistics Act | 2.3 | 2.5 | 1.8 |
| Destination province or territoryTable 1 Note 2 | ||||||||||||||||
| Newfoundland and Labrador | 85.6 | 87.5 | 85.5 | 87.9 | 89.8 | 93.5 | 94.5 | Note ..: not available for a specific reference period | Note ..: not available for a specific reference period | Note ..: not available for a specific reference period | Note ..: not available for a specific reference period | 5.5 | Note ..: not available for a specific reference period | Note ..: not available for a specific reference period | Note ..: not available for a specific reference period | 6.3 |
| Prince Edward Island | 87.2 | 87.7 | 86.8 | 87.5 | 86.7 | 88.2 | 88.1 | Note ..: not available for a specific reference period | Note ..: not available for a specific reference period | Note ..: not available for a specific reference period | Note ..: not available for a specific reference period | 8.7 | Note ..: not available for a specific reference period | Note ..: not available for a specific reference period | Note ..: not available for a specific reference period | 7.0 |
| Nova Scotia | 81.0 | 84.8 | 82.2 | 83.1 | 83.7 | 89.8 | 89.5 | Note ..: not available for a specific reference period | Note ..: not available for a specific reference period | Note ..: not available for a specific reference period | Note ..: not available for a specific reference period | 9.5 | Note ..: not available for a specific reference period | Note ..: not available for a specific reference period | Note ..: not available for a specific reference period | 8.7 |
| New Brunswick | 81.6 | 85.4 | 84.8 | 86.7 | 86.3 | 89.7 | 89.8 | Note ..: not available for a specific reference period | Note ..: not available for a specific reference period | Note ..: not available for a specific reference period | Note ..: not available for a specific reference period | 7.8 | Note ..: not available for a specific reference period | Note ..: not available for a specific reference period | Note ..: not available for a specific reference period | 7.5 |
| Quebec | 85.1 | 89.7 | 89.7 | 88.7 | 87.5 | 89.7 | 90.2 | Note ..: not available for a specific reference period | Note ..: not available for a specific reference period | Note ..: not available for a specific reference period | Note ..: not available for a specific reference period | 8.0 | Note ..: not available for a specific reference period | Note ..: not available for a specific reference period | Note ..: not available for a specific reference period | 7.0 |
| Ontario | 82.6 | 85.9 | 85.2 | 83.2 | 84.5 | 88.7 | 87.2 | Note ..: not available for a specific reference period | Note ..: not available for a specific reference period | Note ..: not available for a specific reference period | Note ..: not available for a specific reference period | 8.7 | Note ..: not available for a specific reference period | Note ..: not available for a specific reference period | Note ..: not available for a specific reference period | 10.1 |
| Manitoba | 87.5 | 91.0 | 92.3 | 93.1 | 93.5 | 94.0 | 92.3 | Note ..: not available for a specific reference period | Note ..: not available for a specific reference period | Note ..: not available for a specific reference period | Note ..: not available for a specific reference period | 4.1 | Note ..: not available for a specific reference period | Note ..: not available for a specific reference period | Note ..: not available for a specific reference period | 4.2 |
| Saskatchewan | 86.7 | 90.4 | 89.9 | 92.1 | 94.6 | 94.5 | 88.8 | Note ..: not available for a specific reference period | Note ..: not available for a specific reference period | Note ..: not available for a specific reference period | Note ..: not available for a specific reference period | 3.2 | Note ..: not available for a specific reference period | Note ..: not available for a specific reference period | Note ..: not available for a specific reference period | 4.9 |
| Alberta | 84.3 | 89.0 | 89.9 | 89.3 | 89.9 | 93.1 | 91.8 | Note ..: not available for a specific reference period | Note ..: not available for a specific reference period | Note ..: not available for a specific reference period | Note ..: not available for a specific reference period | 5.9 | Note ..: not available for a specific reference period | Note ..: not available for a specific reference period | Note ..: not available for a specific reference period | 6.4 |
| British Columbia | 81.6 | 83.5 | 84.5 | 82.1 | 84.7 | 89.7 | 89.1 | Note ..: not available for a specific reference period | Note ..: not available for a specific reference period | Note ..: not available for a specific reference period | Note ..: not available for a specific reference period | 9.0 | Note ..: not available for a specific reference period | Note ..: not available for a specific reference period | Note ..: not available for a specific reference period | 11.1 |
| Territories | 79.2 | 82.3 | 88.6 | 91.7 | 96.1 | 95.0 | 92.8 | Note ..: not available for a specific reference period | Note ..: not available for a specific reference period | Note ..: not available for a specific reference period | Note ..: not available for a specific reference period | Note x: suppressed to meet the confidentiality requirements of the Statistics Act | Note ..: not available for a specific reference period | Note ..: not available for a specific reference period | Note ..: not available for a specific reference period | Note x: suppressed to meet the confidentiality requirements of the Statistics Act |
| Official language skills | ||||||||||||||||
| English only | 82.4 | 84.8 | 84.7 | 83.8 | 86.7 | 90.6 | 88.5 | 12.6 | 10.9 | 10.1 | 10.5 | 7.7 | 11.4 | 10.2 | 9.5 | 10.0 |
| French only | 86.0 | 89.6 | 90.5 | 91.5 | 92.1 | 93.7 | 94.3 | 9.2 | 7.1 | 6.3 | 5.2 | 4.9 | 8.4 | 6.6 | 5.9 | 4.9 |
| English and French | 82.4 | 87.5 | 87.3 | 85.3 | 84.3 | 87.6 | 89.9 | 12.1 | 8.4 | 8.6 | 9.8 | 10.0 | 11.1 | 7.9 | 8.2 | 9.5 |
| Neither English nor French | 83.6 | 88.5 | 88.4 | 87.3 | 86.7 | 89.4 | 88.3 | 10.4 | 7.7 | 7.5 | 7.4 | 7.5 | 9.0 | 7.1 | 7.1 | 7.0 |
| Source regionTable 1 Note 3 | ||||||||||||||||
| India | 82.0 | 85.5 | 82.6 | 78.7 | 83.1 | 89.1 | 83.4 | 12.0 | 10.5 | 12.6 | 15.4 | 11.0 | 10.5 | 9.9 | 12.3 | 15.2 |
| Philippines | 92.3 | 94.9 | 95.6 | 96.6 | 96.9 | 98.1 | 97.5 | 5.2 | 3.5 | 2.7 | 1.9 | 1.6 | 4.5 | 3.1 | 2.5 | 1.7 |
| China | 85.0 | 86.2 | 84.6 | 80.0 | 83.3 | 84.7 | 81.9 | 10.9 | 11.2 | 11.0 | 13.2 | 9.2 | 10.2 | 10.9 | 10.7 | 12.7 |
| Nigeria | 89.0 | 90.4 | 85.7 | 86.7 | 88.0 | 92.1 | 94.5 | 5.9 | 5.9 | 7.7 | 7.3 | 5.9 | 5.5 | 5.3 | 7.1 | 6.7 |
| Pakistan | 81.2 | 85.8 | 86.0 | 85.0 | 84.4 | 85.0 | 85.5 | 10.7 | 8.4 | 8.4 | 8.2 | 7.5 | 8.9 | 7.8 | 7.9 | 7.7 |
| United States | 75.3 | 79.3 | 80.4 | 80.4 | 81.9 | 85.5 | 85.9 | 18.6 | 14.2 | 12.6 | 12.6 | 11.5 | 16.7 | 12.2 | 10.9 | 10.9 |
| Syria | 79.8 | 85.7 | 85.0 | 82.3 | 77.5 | 97.3 | 96.2 | 11.2 | 7.4 | 7.8 | 8.9 | 10.3 | 9.7 | 6.7 | 7.2 | 7.9 |
| France | 76.4 | 84.4 | 84.7 | 86.6 | 88.3 | 92.0 | 92.3 | 18.6 | 12.1 | 11.7 | 9.7 | 8.0 | 17.8 | 11.4 | 11.2 | 9.1 |
| United Kingdom | 74.3 | 73.7 | 84.2 | 82.8 | 81.5 | 87.9 | 88.1 | 20.0 | 20.2 | 10.4 | 10.7 | 11.3 | 18.8 | 18.9 | 9.5 | 9.9 |
| Iran | 79.6 | 88.5 | 87.9 | 86.6 | 84.6 | 83.2 | 89.6 | 10.9 | 5.9 | 5.7 | 6.0 | 7.5 | 8.6 | 5.2 | 5.1 | 5.5 |
| Asia (excluding India, the Philippines, China, Pakistan, Syria and Iran) | 83.1 | 84.6 | 85.5 | 83.5 | 83.9 | 88.6 | 89.6 | 11.2 | 10.7 | 8.9 | 10.4 | 9.6 | 9.8 | 10.0 | 8.4 | 10.0 |
| Africa (excluding Nigeria) | 84.5 | 88.1 | 88.6 | 88.2 | 85.9 | 90.5 | 93.0 | 9.3 | 7.3 | 7.2 | 7.1 | 8.3 | 8.0 | 6.7 | 6.7 | 6.7 |
| North and South America (excluding the United States) | 85.1 | 87.4 | 88.2 | 90.0 | 89.7 | 92.5 | 93.0 | 9.2 | 7.8 | 6.9 | 5.6 | 5.6 | 7.7 | 6.9 | 6.2 | 5.1 |
| Europe (excluding France and the United Kingdom) | 87.1 | 90.7 | 88.7 | 87.3 | 88.1 | 91.5 | 91.1 | 8.0 | 5.9 | 7.5 | 8.2 | 7.3 | 7.0 | 5.3 | 7.0 | 7.6 |
| Oceania and other | 83.4 | 87.3 | 84.8 | 85.4 | 84.3 | 89.1 | 87.9 | 11.6 | 8.7 | 9.8 | 9.8 | 9.9 | 10.5 | 8.1 | 9.3 | 9.0 |
|
.. not available for a specific reference period x suppressed to meet the confidentiality requirements of the Statistics Act
Sources: Statistics Canada, Longitudinal Immigration Database and T1 personal master file, 1993 to 2020. |
||||||||||||||||
| Baseline | Controls 1 | Controls 2 | |
|---|---|---|---|
| average partial effects | |||
| Demographic characteristics at landing | |||
| Cohort | |||
| 1993 to 1996 | 0.025Note *** | -0.021Note *** | -0.031Note *** |
| 1997 to 2000 | -0.004Note ** | -0.051Note *** | -0.060Note *** |
| 2001 to 2004 | 0.005Note *** | -0.042Note *** | -0.051Note *** |
| 2005 to 2008 | 0.046Note *** | 0.000 | -0.007Note *** |
| 2009 to 2012 | 0.027Note *** | 0.001 | -0.002 |
| 2013 to 2016 | -0.016Note *** | -0.024Note *** | -0.024Note *** |
| 2017 to 2019 (ref.) | Note ...: not applicable | Note ...: not applicable | Note ...: not applicable |
| Sex | |||
| Women | -0.004Note *** | -0.007Note *** | -0.000 |
| Men (ref.) | Note ...: not applicable | Note ...: not applicable | Note ...: not applicable |
| Age group | |||
| 25 to 34 (ref.) | Note ...: not applicable | Note ...: not applicable | Note ...: not applicable |
| 35 to 49 | 0.008Note *** | 0.009Note *** | 0.012Note *** |
| 50 to 64 | 0.044Note *** | 0.081Note *** | 0.086Note *** |
| Education | |||
| High school or less | -0.016Note *** | 0.002 | -0.015Note *** |
| Some postsecondary | -0.019Note *** | -0.005Note *** | -0.018Note *** |
| Bachelor's degree (ref.) | Note ...: not applicable | Note ...: not applicable | Note ...: not applicable |
| Graduate degree | 0.074Note *** | 0.055Note *** | 0.043Note *** |
| Immigration class | |||
| Federal Skilled Worker Program | 0.090Note *** | 0.090Note *** | 0.089Note *** |
| Provincial programs (ref.) | Note ...: not applicable | Note ...: not applicable | Note ...: not applicable |
| Canadian Experience Class | -0.040Note *** | -0.044Note *** | -0.045Note *** |
| Other economic classes | 0.049Note *** | 0.050Note *** | 0.060Note *** |
| Family class | 0.063Note *** | 0.022Note *** | 0.018Note *** |
| Refugee | -0.069Note *** | -0.071Note *** | -0.070Note *** |
| Other | -0.013Note *** | -0.026Note *** | -0.025Note *** |
| Destination province or territoryTable 2 Note 1 | |||
| Newfoundland and Labrador | -0.090Note *** | -0.060Note *** | -0.055Note *** |
| Prince Edward Island | -0.037Note *** | 0.020Note *** | 0.003 |
| Nova Scotia | -0.030Note *** | -0.003 | -0.005Table 2 Note † |
| New Brunswick | -0.039Note *** | 0.014Note *** | 0.013Note ** |
| Quebec | -0.052Note *** | 0.040Note *** | 0.019Note *** |
| Ontario (ref.) | Note ...: not applicable | Note ...: not applicable | Note ...: not applicable |
| Manitoba | -0.093Note *** | -0.049Note *** | -0.030Note *** |
| Saskatchewan | -0.084Note *** | -0.041Note *** | -0.029Note *** |
| Alberta | -0.066Note *** | -0.047Note *** | -0.037Note *** |
| British Columbia | 0.001 | 0.007Note *** | 0.001 |
| Territories | -0.089Note *** | -0.059Note *** | -0.034Note ** |
| Official language skills | |||
| English only (ref.) | Note ...: not applicable | Note ...: not applicable | Note ...: not applicable |
| French only | -0.080Note *** | -0.064Note *** | Note ...: not applicable |
| English and French | -0.036Note *** | -0.031Note *** | Note ...: not applicable |
| Neither English nor French | -0.030Note *** | -0.012Note *** | Note ...: not applicable |
| Source regionTable 2 Note 2 | |||
| India | 0.021Note *** | Note ...: not applicable | 0.029Note *** |
| Philippines | -0.121Note *** | Note ...: not applicable | -0.087Note *** |
| China | 0.023Note *** | Note ...: not applicable | 0.040Note *** |
| Nigeria | -0.066Note *** | Note ...: not applicable | -0.050Note *** |
| Pakistan | 0.005 | Note ...: not applicable | 0.009Note ** |
| United States (ref.) | Note ...: not applicable | Note ...: not applicable | Note ...: not applicable |
| Syria | -0.101Note *** | Note ...: not applicable | 0.009Table 2 Note † |
| France | -0.054Note *** | Note ...: not applicable | -0.007Table 2 Note † |
| United Kingdom | 0.037Note *** | Note ...: not applicable | 0.067Note *** |
| Iran | -0.021Note *** | Note ...: not applicable | -0.012Note *** |
| Asia (excluding India, the Philippines, China, Pakistan, Syria and Iran) | -0.005 | Note ...: not applicable | 0.024Note *** |
| Africa (excluding Nigeria) | -0.046Note *** | Note ...: not applicable | -0.001 |
| North and South America (excluding the United States) | -0.061Note *** | Note ...: not applicable | -0.014Note *** |
| Europe (excluding France and the United Kingdom) | -0.077Note *** | Note ...: not applicable | -0.036Note *** |
| Oceania and other | -0.023Note *** | Note ...: not applicable | 0.045Note *** |
|
... not applicable * significantly different from reference category (p < 0.05)
Sources: Statistics Canada, Longitudinal Immigration Database and T1 personal master file, 1993 to 2020. |
|||
| All couples | Couples with children younger than 18 | Couples without children younger than 18 | |||||||||||||||||||
|---|---|---|---|---|---|---|---|---|---|---|---|---|---|---|---|---|---|---|---|---|---|
| 1993 to 1996 | 1997 to 2000 | 2001 to 2004 | 2005 to 2008 | 2009 to 2012 | 2013 to 2016 | 2017 to 2019 | 1993 to 1996 | 1997 to 2000 | 2001 to 2004 | 2005 to 2008 | 2009 to 2012 | 2013 to 2016 | 2017 to 2019 | 1993 to 1996 | 1997 to 2000 | 2001 to 2004 | 2005 to 2008 | 2009 to 2012 | 2013 to 2016 | 2017 to 2019 | |
| percent | |||||||||||||||||||||
| Demographic characteristics at landing | |||||||||||||||||||||
| All | 77.1 | 83.7 | 84.2 | 80.5 | 82.6 | 86.9 | 84.1 | 83.7 | 86.9 | 86.5 | 82.2 | 83.3 | 87.3 | 85.3 | 64.7 | 76.9 | 79.8 | 77.4 | 81.2 | 86.4 | 82.7 |
| Age group of principal applicant | |||||||||||||||||||||
| 25 to 34 | 81.8 | 84.6 | 83.6 | 79.7 | 85.8 | 89.4 | 84.7 | 86.1 | 88.4 | 86.7 | 82.4 | 86.7 | 88.7 | 84.3 | 75.5 | 80.3 | 80.2 | 76.9 | 84.9 | 90.0 | 85.0 |
| 35 to 49 | 81.4 | 85.0 | 85.4 | 81.2 | 81.5 | 86.4 | 85.6 | 83.6 | 86.5 | 86.5 | 82.3 | 82.5 | 86.8 | 85.7 | 67.9 | 75.1 | 78.7 | 75.9 | 77.0 | 84.4 | 85.2 |
| 50 to 64 | 62.2 | 75.5 | 81.3 | 79.7 | 78.5 | 81.9 | 76.1 | 78.0 | 83.5 | 85.8 | 80.5 | 77.9 | 85.3 | 86.7 | 56.9 | 72.3 | 79.7 | 79.4 | 78.8 | 80.7 | 72.4 |
| Education of principal applicant | |||||||||||||||||||||
| High school or less | 75.4 | 83.4 | 88.5 | 87.2 | 86.3 | 90.8 | 87.9 | 85.6 | 88.2 | 92.6 | 88.5 | 87.6 | 93.2 | 92.1 | 62.2 | 76.9 | 84.6 | 85.6 | 84.7 | 87.6 | 82.0 |
| Some postsecondary | 79.5 | 85.2 | 87.8 | 87.6 | 87.5 | 90.1 | 88.4 | 84.0 | 88.2 | 90.1 | 89.4 | 89.5 | 91.8 | 91.3 | 68.0 | 76.9 | 83.1 | 83.7 | 83.7 | 87.4 | 84.7 |
| Bachelor's degree | 79.3 | 86.3 | 85.7 | 82.1 | 84.4 | 87.8 | 86.1 | 84.0 | 88.8 | 87.9 | 83.9 | 85.0 | 87.9 | 86.9 | 66.7 | 80.5 | 81.1 | 78.3 | 83.1 | 87.6 | 85.1 |
| Graduate degree | 73.4 | 77.8 | 77.6 | 71.5 | 75.0 | 81.8 | 79.1 | 77.6 | 81.2 | 80.3 | 73.6 | 75.3 | 80.7 | 78.6 | 65.3 | 70.0 | 71.2 | 67.5 | 74.3 | 83.4 | 79.7 |
| Immigration class of principal applicant | |||||||||||||||||||||
| Federal Skilled Worker Program | 79.3 | 83.1 | 82.0 | 73.9 | 74.6 | 78.5 | 74.1 | 82.5 | 85.6 | 84.3 | 76.5 | 75.3 | 78.3 | 74.2 | 69.9 | 76.5 | 76.1 | 67.7 | 72.7 | 79.0 | 74.0 |
| Provincial programs | 81.7 | 87.6 | 89.6 | 88.8 | 88.8 | 89.0 | 85.5 | 86.3 | 89.5 | 91.1 | 90.2 | 90.3 | 89.4 | 85.0 | 70.3 | 82.4 | 86.6 | 86.1 | 85.7 | 88.2 | 86.2 |
| Canadian Experience ClassTable 3 Note 1 | Note ..: not available for a specific reference period | Note ..: not available for a specific reference period | Note ..: not available for a specific reference period | Note ..: not available for a specific reference period | 89.9 | 92.2 | 89.9 | Note ..: not available for a specific reference period | Note ..: not available for a specific reference period | Note ..: not available for a specific reference period | Note ..: not available for a specific reference period | 89.7 | 92.3 | 88.4 | Note ..: not available for a specific reference period | Note ..: not available for a specific reference period | Note ..: not available for a specific reference period | Note ..: not available for a specific reference period | 90.0 | 92.1 | 90.6 |
| Other economic classes | 78.7 | 79.4 | 82.7 | 77.9 | 73.4 | 89.4 | 93.3 | 82.0 | 82.2 | 85.6 | 80.4 | 74.9 | 89.5 | 93.6 | 66.1 | 69.8 | 74.7 | 71.7 | 69.4 | 89.1 | 92.9 |
| Family class | 61.2 | 77.7 | 83.7 | 86.6 | 85.1 | 83.5 | Note x: suppressed to meet the confidentiality requirements of the Statistics Act | 80.2 | 88.8 | 91.0 | 91.5 | 89.9 | 90.0 | Note x: suppressed to meet the confidentiality requirements of the Statistics Act | 55.9 | 75.1 | 82.5 | 86.1 | 84.8 | 83.3 | Note x: suppressed to meet the confidentiality requirements of the Statistics Act |
| Refugee | 92.6 | 95.9 | 96.6 | 96.7 | 96.0 | 97.6 | 95.5 | 96.6 | 98.0 | 98.1 | 97.9 | 96.9 | 97.9 | 95.7 | 79.7 | 88.0 | 92.3 | 93.3 | 93.3 | 96.3 | 94.7 |
| Other | Note x: suppressed to meet the confidentiality requirements of the Statistics Act | 92.8 | 94.6 | 95.6 | 96.1 | 96.2 | 92.0 | Note x: suppressed to meet the confidentiality requirements of the Statistics Act | 94.8 | 95.1 | 96.6 | 97.1 | 97.2 | 92.4 | Note x: suppressed to meet the confidentiality requirements of the Statistics Act | 90.9 | 94.0 | 93.9 | 94.9 | 94.9 | 91.5 |
| Destination province or territory of principal applicantTable 3 Note 2 | |||||||||||||||||||||
| Newfoundland and Labrador | Note ..: not available for a specific reference period | Note ..: not available for a specific reference period | Note ..: not available for a specific reference period | Note ..: not available for a specific reference period | Note ..: not available for a specific reference period | Note ..: not available for a specific reference period | 92.4 | Note ..: not available for a specific reference period | Note ..: not available for a specific reference period | Note ..: not available for a specific reference period | Note ..: not available for a specific reference period | Note ..: not available for a specific reference period | Note ..: not available for a specific reference period | 92.2 | Note ..: not available for a specific reference period | Note ..: not available for a specific reference period | Note ..: not available for a specific reference period | Note ..: not available for a specific reference period | Note ..: not available for a specific reference period | Note ..: not available for a specific reference period | 92.7 |
| Prince Edward Island | Note ..: not available for a specific reference period | Note ..: not available for a specific reference period | Note ..: not available for a specific reference period | Note ..: not available for a specific reference period | Note ..: not available for a specific reference period | Note ..: not available for a specific reference period | 79.8 | Note ..: not available for a specific reference period | Note ..: not available for a specific reference period | Note ..: not available for a specific reference period | Note ..: not available for a specific reference period | Note ..: not available for a specific reference period | Note ..: not available for a specific reference period | 79.4 | Note ..: not available for a specific reference period | Note ..: not available for a specific reference period | Note ..: not available for a specific reference period | Note ..: not available for a specific reference period | Note ..: not available for a specific reference period | Note ..: not available for a specific reference period | 80.8 |
| Nova Scotia | Note ..: not available for a specific reference period | Note ..: not available for a specific reference period | Note ..: not available for a specific reference period | Note ..: not available for a specific reference period | Note ..: not available for a specific reference period | Note ..: not available for a specific reference period | 85.7 | Note ..: not available for a specific reference period | Note ..: not available for a specific reference period | Note ..: not available for a specific reference period | Note ..: not available for a specific reference period | Note ..: not available for a specific reference period | Note ..: not available for a specific reference period | 85.4 | Note ..: not available for a specific reference period | Note ..: not available for a specific reference period | Note ..: not available for a specific reference period | Note ..: not available for a specific reference period | Note ..: not available for a specific reference period | Note ..: not available for a specific reference period | 86.2 |
| New Brunswick | Note ..: not available for a specific reference period | Note ..: not available for a specific reference period | Note ..: not available for a specific reference period | Note ..: not available for a specific reference period | Note ..: not available for a specific reference period | Note ..: not available for a specific reference period | 85.5 | Note ..: not available for a specific reference period | Note ..: not available for a specific reference period | Note ..: not available for a specific reference period | Note ..: not available for a specific reference period | Note ..: not available for a specific reference period | Note ..: not available for a specific reference period | 85.1 | Note ..: not available for a specific reference period | Note ..: not available for a specific reference period | Note ..: not available for a specific reference period | Note ..: not available for a specific reference period | Note ..: not available for a specific reference period | Note ..: not available for a specific reference period | 86.5 |
| Quebec | Note ..: not available for a specific reference period | Note ..: not available for a specific reference period | Note ..: not available for a specific reference period | Note ..: not available for a specific reference period | Note ..: not available for a specific reference period | Note ..: not available for a specific reference period | 85.1 | Note ..: not available for a specific reference period | Note ..: not available for a specific reference period | Note ..: not available for a specific reference period | Note ..: not available for a specific reference period | Note ..: not available for a specific reference period | Note ..: not available for a specific reference period | 86.4 | Note ..: not available for a specific reference period | Note ..: not available for a specific reference period | Note ..: not available for a specific reference period | Note ..: not available for a specific reference period | Note ..: not available for a specific reference period | Note ..: not available for a specific reference period | 82.4 |
| Ontario | Note ..: not available for a specific reference period | Note ..: not available for a specific reference period | Note ..: not available for a specific reference period | Note ..: not available for a specific reference period | Note ..: not available for a specific reference period | Note ..: not available for a specific reference period | 81.6 | Note ..: not available for a specific reference period | Note ..: not available for a specific reference period | Note ..: not available for a specific reference period | Note ..: not available for a specific reference period | Note ..: not available for a specific reference period | Note ..: not available for a specific reference period | 82.9 | Note ..: not available for a specific reference period | Note ..: not available for a specific reference period | Note ..: not available for a specific reference period | Note ..: not available for a specific reference period | Note ..: not available for a specific reference period | Note ..: not available for a specific reference period | 80.4 |
| Manitoba | Note ..: not available for a specific reference period | Note ..: not available for a specific reference period | Note ..: not available for a specific reference period | Note ..: not available for a specific reference period | Note ..: not available for a specific reference period | Note ..: not available for a specific reference period | 89.0 | Note ..: not available for a specific reference period | Note ..: not available for a specific reference period | Note ..: not available for a specific reference period | Note ..: not available for a specific reference period | Note ..: not available for a specific reference period | Note ..: not available for a specific reference period | 89.4 | Note ..: not available for a specific reference period | Note ..: not available for a specific reference period | Note ..: not available for a specific reference period | Note ..: not available for a specific reference period | Note ..: not available for a specific reference period | Note ..: not available for a specific reference period | 88.3 |
| Saskatchewan | Note ..: not available for a specific reference period | Note ..: not available for a specific reference period | Note ..: not available for a specific reference period | Note ..: not available for a specific reference period | Note ..: not available for a specific reference period | Note ..: not available for a specific reference period | 84.0 | Note ..: not available for a specific reference period | Note ..: not available for a specific reference period | Note ..: not available for a specific reference period | Note ..: not available for a specific reference period | Note ..: not available for a specific reference period | Note ..: not available for a specific reference period | 83.8 | Note ..: not available for a specific reference period | Note ..: not available for a specific reference period | Note ..: not available for a specific reference period | Note ..: not available for a specific reference period | Note ..: not available for a specific reference period | Note ..: not available for a specific reference period | 84.3 |
| Alberta | Note ..: not available for a specific reference period | Note ..: not available for a specific reference period | Note ..: not available for a specific reference period | Note ..: not available for a specific reference period | Note ..: not available for a specific reference period | Note ..: not available for a specific reference period | 88.2 | Note ..: not available for a specific reference period | Note ..: not available for a specific reference period | Note ..: not available for a specific reference period | Note ..: not available for a specific reference period | Note ..: not available for a specific reference period | Note ..: not available for a specific reference period | 90.3 | Note ..: not available for a specific reference period | Note ..: not available for a specific reference period | Note ..: not available for a specific reference period | Note ..: not available for a specific reference period | Note ..: not available for a specific reference period | Note ..: not available for a specific reference period | 86.1 |
| British Columbia | Note ..: not available for a specific reference period | Note ..: not available for a specific reference period | Note ..: not available for a specific reference period | Note ..: not available for a specific reference period | Note ..: not available for a specific reference period | Note ..: not available for a specific reference period | 83.9 | Note ..: not available for a specific reference period | Note ..: not available for a specific reference period | Note ..: not available for a specific reference period | Note ..: not available for a specific reference period | Note ..: not available for a specific reference period | Note ..: not available for a specific reference period | 84.7 | Note ..: not available for a specific reference period | Note ..: not available for a specific reference period | Note ..: not available for a specific reference period | Note ..: not available for a specific reference period | Note ..: not available for a specific reference period | Note ..: not available for a specific reference period | 83.4 |
| Territories | Note ..: not available for a specific reference period | Note ..: not available for a specific reference period | Note ..: not available for a specific reference period | Note ..: not available for a specific reference period | Note ..: not available for a specific reference period | Note ..: not available for a specific reference period | 89.8 | Note ..: not available for a specific reference period | Note ..: not available for a specific reference period | Note ..: not available for a specific reference period | Note ..: not available for a specific reference period | Note ..: not available for a specific reference period | Note ..: not available for a specific reference period | Note x: suppressed to meet the confidentiality requirements of the Statistics Act | Note ..: not available for a specific reference period | Note ..: not available for a specific reference period | Note ..: not available for a specific reference period | Note ..: not available for a specific reference period | Note ..: not available for a specific reference period | Note ..: not available for a specific reference period | Note x: suppressed to meet the confidentiality requirements of the Statistics Act |
| Official language skills of principal applicant | |||||||||||||||||||||
| English only | 76.3 | 81.8 | 81.6 | 77.5 | 81.3 | 86.8 | 83.5 | 81.4 | 84.8 | 84.1 | 79.5 | 82.1 | 86.6 | 83.9 | 64.9 | 74.4 | 75.8 | 73.3 | 79.8 | 86.9 | 83.1 |
| French only | 84.4 | 89.3 | 90.8 | 91.8 | 92.0 | 92.8 | 93.3 | 89.4 | 91.6 | 92.8 | 92.8 | 93.1 | 93.3 | 94.1 | 71.2 | 83.6 | 86.3 | 89.0 | 88.7 | 91.7 | 91.9 |
| English and French | 80.2 | 87.8 | 88.5 | 86.0 | 85.6 | 87.5 | 86.4 | 84.0 | 89.6 | 89.7 | 87.3 | 86.0 | 87.7 | 85.9 | 71.6 | 84.6 | 86.6 | 83.9 | 84.7 | 87.1 | 87.1 |
| Neither English nor French | 77.8 | 86.9 | 86.7 | 83.5 | 82.1 | 85.3 | 83.0 | 88.5 | 91.5 | 89.8 | 85.2 | 82.7 | 87.5 | 91.1 | 63.3 | 79.6 | 82.3 | 81.0 | 81.2 | 82.9 | 74.4 |
| Source region of principal applicantTable 3 Note 3 | |||||||||||||||||||||
| India | 71.3 | 81.5 | 79.0 | 73.3 | 78.1 | 85.2 | 77.7 | 82.3 | 85.5 | 80.2 | 72.2 | 76.5 | 83.2 | 77.7 | 61.2 | 76.3 | 77.0 | 74.9 | 80.2 | 87.1 | 77.7 |
| Philippines | 82.0 | 93.2 | 95.2 | 94.2 | 95.1 | 97.2 | 95.8 | 90.2 | 96.1 | 96.7 | 95.4 | 96.2 | 97.6 | 96.4 | 63.0 | 85.3 | 90.1 | 89.6 | 91.3 | 96.3 | 94.6 |
| China | 77.1 | 82.3 | 81.4 | 73.9 | 76.9 | 75.3 | 69.8 | 83.7 | 85.2 | 83.7 | 76.3 | 76.2 | 70.4 | 64.3 | 71.2 | 78.8 | 78.5 | 70.4 | 77.8 | 79.8 | 74.0 |
| Nigeria | 87.5 | 89.6 | 81.9 | 84.1 | 84.6 | 90.3 | 93.7 | 87.5 | 90.7 | 82.7 | 85.2 | 85.3 | 90.8 | 94.3 | 87.5 | 86.5 | 79.6 | 81.1 | 82.0 | 88.6 | 92.3 |
| Pakistan | 77.7 | 84.5 | 83.5 | 81.1 | 80.2 | 80.2 | 78.3 | 83.4 | 87.3 | 86.1 | 83.5 | 81.7 | 81.1 | 78.4 | 51.8 | 70.9 | 73.0 | 72.4 | 74.5 | 77.4 | 78.1 |
| United States | 61.9 | 64.3 | 68.1 | 68.9 | 73.3 | 83.1 | 82.7 | 65.2 | 66.7 | 69.4 | 67.8 | 72.2 | 83.0 | 81.3 | 57.3 | 61.0 | 66.5 | 69.7 | 74.4 | 83.3 | 83.8 |
| Syria | 76.5 | 85.6 | 85.4 | 81.3 | 74.8 | 97.4 | 95.7 | 81.3 | 87.6 | 86.4 | 82.6 | 75.8 | 97.7 | 95.8 | 53.4 | 75.9 | 79.8 | 75.6 | 70.3 | 95.0 | 94.5 |
| France | 71.5 | 78.2 | 81.5 | 84.8 | 87.6 | 91.6 | 89.7 | 75.4 | 79.9 | 82.5 | 84.6 | 86.1 | 89.4 | 88.4 | 62.8 | 74.7 | 80.1 | 85.0 | 89.1 | 93.0 | 90.6 |
| United Kingdom | 72.4 | 70.8 | 81.0 | 79.3 | 76.3 | 82.3 | 83.7 | 76.0 | 73.0 | 82.9 | 79.9 | 77.2 | 83.3 | 83.0 | 63.7 | 66.3 | 77.9 | 78.3 | 74.7 | 80.9 | 84.3 |
| Iran | 76.1 | 88.3 | 89.1 | 86.8 | 83.6 | 80.8 | 87.4 | 83.8 | 90.7 | 91.9 | 89.5 | 85.2 | 81.4 | 90.5 | 54.0 | 80.3 | 83.9 | 83.1 | 81.7 | 80.2 | 85.5 |
| Asia (excluding India, the Philippines, China, Pakistan, Syria and Iran) | 77.8 | 82.3 | 83.4 | 78.6 | 79.6 | 84.9 | 85.2 | 83.8 | 85.5 | 86.1 | 80.5 | 80.2 | 85.7 | 86.3 | 60.1 | 70.1 | 74.2 | 73.1 | 77.7 | 83.2 | 83.5 |
| Africa (excluding Nigeria) | 79.5 | 86.5 | 88.2 | 87.6 | 84.7 | 88.3 | 90.6 | 83.8 | 88.2 | 89.3 | 88.6 | 85.6 | 88.6 | 91.3 | 70.4 | 82.3 | 86.0 | 85.0 | 82.1 | 87.6 | 88.9 |
| North and South America (excluding the United States) | 74.1 | 83.1 | 87.2 | 87.8 | 86.7 | 91.4 | 90.9 | 83.1 | 86.5 | 89.6 | 89.6 | 88.2 | 92.6 | 90.7 | 60.6 | 77.5 | 83.2 | 84.9 | 84.7 | 89.8 | 91.0 |
| Europe (excluding France and the United Kingdom) | 85.4 | 91.6 | 89.5 | 86.5 | 88.0 | 90.8 | 88.6 | 91.4 | 94.6 | 91.9 | 88.5 | 89.7 | 91.9 | 89.1 | 71.8 | 84.2 | 85.2 | 83.5 | 85.5 | 89.6 | 88.1 |
| Oceania and other | 79.1 | 86.3 | 78.7 | 77.6 | 76.7 | 85.0 | 80.6 | 88.0 | 91.4 | 82.5 | 78.7 | 79.1 | 84.4 | 80.3 | 64.9 | 74.7 | 72.3 | 75.8 | 73.9 | 85.5 | 80.8 |
|
.. not available for a specific reference period x suppressed to meet the confidentiality requirements of the Statistics Act
Sources: Statistics Canada, Longitudinal Immigration Database and T1 personal master file, 1993 to 2020. |
|||||||||||||||||||||
| Baseline | Controls 1 | Controls 2 | |
|---|---|---|---|
| average partial effects | |||
| Demographic characteristics at landing | |||
| Cohort | |||
| 1993 to 1996 | 0.069Note *** | 0.028Note *** | 0.012Note *** |
| 1997 to 2000 | 0.004Note * | -0.036Note *** | -0.050Note *** |
| 2001 to 2004 | -0.002 | -0.041Note *** | -0.053Note *** |
| 2005 to 2008 | 0.035Note *** | -0.004Note * | -0.014Note *** |
| 2009 to 2012 | 0.015Note *** | -0.006Note *** | -0.011Note *** |
| 2013 to 2016 | -0.028Note *** | -0.033Note *** | -0.033Note *** |
| 2017 to 2019 (ref.) | Note ...: not applicable | Note ...: not applicable | Note ...: not applicable |
| Couple had a child younger than 18 | |||
| No (ref.) | Note ...: not applicable | Note ...: not applicable | Note ...: not applicable |
| Yes | -0.056Note *** | -0.056Note *** | -0.052Note *** |
| Age group of principal applicant | |||
| 25 to 34 (ref.) | Note ...: not applicable | Note ...: not applicable | Note ...: not applicable |
| 35 to 49 | 0.009Note *** | 0.028Note *** | 0.030Note *** |
| 50 to 64 | 0.087Note *** | 0.115Note *** | 0.117Note *** |
| Education of principal applicant | |||
| High school or less | 0.001 | 0.004Note ** | -0.014Note *** |
| Some postsecondary | -0.015Note *** | -0.006Note *** | -0.020Note *** |
| Bachelor's degree (ref.) | Note ...: not applicable | Note ...: not applicable | Note ...: not applicable |
| Graduate degree | 0.079Note *** | 0.063Note *** | 0.049Note *** |
| Immigration class of principal applicant | |||
| Federal Skilled Worker Program | 0.096Note *** | 0.086Note *** | 0.087Note *** |
| Provincial programs (ref.) | Note ...: not applicable | Note ...: not applicable | Note ...: not applicable |
| Canadian Experience Class | -0.028Note *** | -0.044Note *** | -0.047Note *** |
| Other economic classes | 0.061Note *** | 0.037Note *** | 0.049Note *** |
| Family class | 0.112Note *** | 0.003Table 4 Note † | 0.003 |
| Refugee | -0.079Note *** | -0.090Note *** | -0.085Note *** |
| Other | 0.013Note *** | -0.038Note *** | -0.036Note *** |
| Destination province or territory of principal applicantTable 4 Note 1 | |||
| Newfoundland and Labrador | -0.064Note *** | -0.031Note *** | -0.023Note *** |
| Prince Edward Island | -0.024Note *** | 0.038Note *** | 0.017Note ** |
| Nova Scotia | -0.024Note *** | 0.002 | -0.001 |
| New Brunswick | -0.039Note *** | 0.020Note *** | 0.017Note *** |
| Quebec | -0.065Note *** | 0.029Note *** | 0.007Note *** |
| Ontario (ref.) | Note ...: not applicable | Note ...: not applicable | Note ...: not applicable |
| Manitoba | -0.105Note *** | -0.054Note *** | -0.032Note *** |
| Saskatchewan | -0.091Note *** | -0.042Note *** | -0.029Note *** |
| Alberta | -0.072Note *** | -0.050Note *** | -0.039Note *** |
| British Columbia | 0.006Note *** | 0.006Note *** | -0.001 |
| Territories | -0.087Note *** | -0.059Note *** | -0.031Note * |
| Official language skills of principal applicant | |||
| English only (ref.) | Note ...: not applicable | Note ...: not applicable | Note ...: not applicable |
| French only | -0.097Note *** | -0.075Note *** | Note ...: not applicable |
| English and French | -0.047Note *** | -0.037Note *** | Note ...: not applicable |
| Neither English nor French | -0.021Note *** | -0.011Note *** | Note ...: not applicable |
| Source region of principal applicantTable 4 Note 2 | |||
| India | -0.062Note *** | Note ...: not applicable | -0.025Note *** |
| Philippines | -0.223Note *** | Note ...: not applicable | -0.155Note *** |
| China | -0.050Note *** | Note ...: not applicable | -0.007Table 4 Note † |
| Nigeria | -0.173Note *** | Note ...: not applicable | -0.121Note *** |
| Pakistan | -0.090Note *** | Note ...: not applicable | -0.049Note *** |
| United States (ref.) | Note ...: not applicable | Note ...: not applicable | Note ...: not applicable |
| Syria | -0.213Note *** | Note ...: not applicable | -0.071Note *** |
| France | -0.134Note *** | Note ...: not applicable | -0.054Note *** |
| United Kingdom | -0.032Note *** | Note ...: not applicable | 0.009Note * |
| Iran | -0.121Note *** | Note ...: not applicable | -0.082Note *** |
| Asia (excluding India, the Philippines, China, Pakistan, Syria and Iran) | -0.090Note *** | Note ...: not applicable | -0.027Note *** |
| Africa (excluding Nigeria) | -0.145Note *** | Note ...: not applicable | -0.061Note *** |
| North and South America (excluding the United States) | -0.147Note *** | Note ...: not applicable | -0.068Note *** |
| Europe (excluding France and the United Kingdom) | -0.163Note *** | Note ...: not applicable | -0.091Note *** |
| Oceania and other | -0.081Note *** | Note ...: not applicable | -0.010Note * |
... not applicable
Sources: Statistics Canada, Longitudinal Immigration Database and T1 personal master file, 1993 to 2020. |
|||
References
Evra, R., & Prokopenko, E. (2022). Longitudinal Immigration Database (IMDB) Technical Report, 2021. Analytical Studies: Methods and References, no. 046. Statistics Canada Catalogue no. 11-633-X. Ottawa: Statistics Canada. https://www150.statcan.gc.ca/n1/pub/11-633-x/11-633-x2022009-eng.htm.
Messacar, D. (2017). Big Tax Data and Economic Analysis: Effects of Personal Income Tax Reassessments and Delayed Tax Filing. Canadian Public Policy 43(3): 261-283. https://doi.org/10.3138/cpp.2016-079.
Office of the Auditor General of Canada (2022). Access to Benefits for Hard-to-Reach Populations. Reports of the Auditor General of Canada to the Parliament of Canada. Ottawa: Office of the Auditor General of Canada. https://www.oag-bvg.gc.ca/internet/English/parl_oag_202205_01_e_44033.html.
Qiu, H., Hou, F., & Crossman, E. (2021). Estimating Immigrants’ Presence in Canada Within the Context of Increasingly Fluid International Migration Patterns. Analytical Studies: Methods and References, no. 032. Statistics Canada Catalogue no. 11-633-X. Ottawa: Statistics Canada. https://www150.statcan.gc.ca/n1/pub/11-633-x/11-633-x2021004-eng.htm.
Statistics Canada (2022a). Immigration as a Source of Labour Supply, 2022. The Daily. Ottawa: Statistics Canada. https://www150.statcan.gc.ca/n1/daily-quotidien/220622/dq220622c-eng.htm.
Statistics Canada (2022b). Settlement services provided to immigrants to Canada, 2020. The Daily. Ottawa: Statistics Canada. https://www150.statcan.gc.ca/n1/daily-quotidien/220602/dq220602e-eng.htm.
- Date modified: