
Economic and Social Reports
Recent developments in the Canadian economy: Fall 2023
DOI: https://doi.org/10.25318/36280001202301000006-eng
This article provides an integrated summary of recent changes in output, consumer prices, employment and household finances. It highlights changes in economic data during the first half of 2023 and into the summer months. The article also examines how economic conditions have changed as borrowing costs have risen.
The report is based on data that are publicly available as of October 4, 2023. Monthly information on government, business and financial market developments is available in the Canadian Economic News. Monthly commentary on economic developments related to the COVID-19 pandemic can be found on the Canadian Economic Dashboard and COVID-19. A new integrated data module designed to support the analysis of current economic conditions is also available on the Canadian Economic Tracker.
Authors
Guy Gellatly and Carter McCormack work with the Strategic Analysis, Publications and Training division, Analytical Studies and Modelling Branch, Statistics Canada.
Overview
Economic activity slowed toward mid-2023 as businesses and households continued to adjust to higher borrowing costs. Household spending moderated in the second quarter as outlays on consumer durables declined. Investment in housing continued to pull back as declines in new construction offset stronger activity in home resale markets. Non-residential business investment rose, buoyed by higher spending on engineering structures and aircraft. The pace of employment growth slowed during the first half of 2023 as the unmet demand for labour eased. Business labour productivity continued to trend lower.
Headline consumer inflation eased during the first half of 2023, falling below the three percent mark in June before accelerating in the summer months. Food inflation began to moderate, while prices for many household essentials remained elevated. Higher mortgage interest costs and rental prices put upward pressure on the headline rate.
Household net worth continued to increase, led by gains in the value of residential real estate. The household debt service ratio edged down in the second quarter as mortgage borrowing fell to its lowest level in 18 years. The household debt-to-income ratio also declined as incomes grew at their fastest pace in five quarters.
Economic growth stalls as consumers rein in spending
Real gross domestic product (GDP) was essentially unchanged in the second quarter of 2023 after expanding 0.6% in the first. Smaller inventory buildups and continued declines in housing investment weighed on economic activity, while increases in non-residential business investment and government spending supported growth (Chart 1).

Data table for Chart 1
| Q1 2023 | Q2 2023 | |
|---|---|---|
| percentage point contribution | ||
| imports of goods and services | -0.06 | -0.16 |
| Exports of goods and services | 0.83 | 0.03 |
| Investment in inventories | -0.39 | -0.21 |
| General governments final consumption expenditure | -0.20 | 0.13 |
| Business investment - machinery and equipment | 0.00 | 0.09 |
| Business investment - non-residential structures | 0.12 | 0.14 |
| Business investment - residential structures | -0.42 | -0.16 |
| Household final consumption expenditure | 0.63 | 0.03 |
| Gross domestic product at market prices | 0.65 | -0.05 |
|
Notes: Data on gross domestic product are quarterly growth rates; all other data are percentage-point contributions to the the quarterly growth rates in real GDP. Source: Statistics Canada, table 36-10-0104-01. |
||
The flat read on headline GDP followed gains in six out of the last eight quarters. Overall activity in the quarter was 1.1% higher than in the second quarter of 2022, and 3.5% above pre-pandemic levels observed in late 2019. Final domestic demand, supported by higher business outlays on non-residential structures, rose 0.3% in the second quarter of 2023, matching the increase in the first.
A slower pace of inventory accumulation weighed on economic activity in the second quarter, reflecting slowdowns in manufacturing and wholesale trade. The economy-wide stock-to-sales ratio reached its highest level since the COVID-19 lockdowns in the spring of 2020.
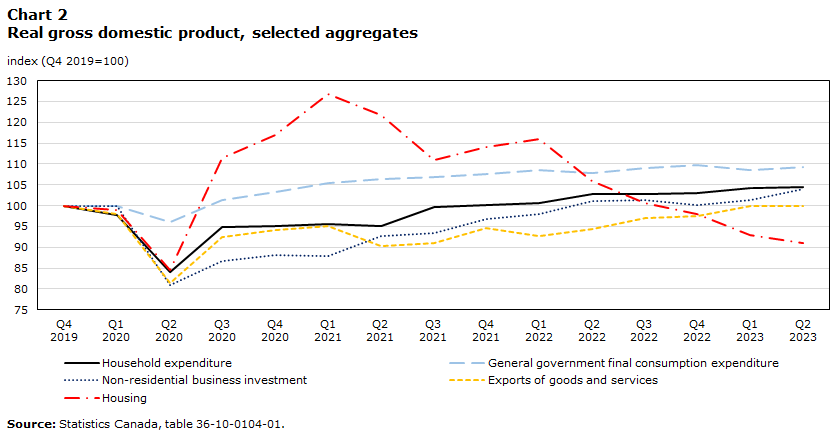
Investment in housing detracted from growth as borrowers continued to adjust to higher financing costs. Outlays on housing fell for the fifth consecutive quarter (-2.1%) reflecting declines in new construction and renovation activity (Chart 2). In contrast, ownership transfer costs rose for the first time in six quarters as activity increased in resale markets. Total residential investment in the second quarter was 28% below peak levels reported in early 2021.
Data table for Chart 2
| Household expenditure | General government final consumption expenditure | Non-residential business investment | Exports of goods and services | Housing | |
|---|---|---|---|---|---|
| index (Q4 2019=100) | |||||
| 2019 | |||||
| Q4 | 100.0 | 100.0 | 100.0 | 100.0 | 100.0 |
| 2020 | |||||
| Q1 | 97.7 | 100.0 | 99.8 | 98.1 | 98.9 |
| Q2 | 84.0 | 96.1 | 81.0 | 81.5 | 84.6 |
| Q3 | 94.9 | 101.5 | 86.8 | 92.6 | 111.4 |
| Q4 | 95.2 | 103.3 | 88.1 | 94.1 | 117.0 |
| 2021 | |||||
| Q1 | 95.7 | 105.5 | 88.0 | 95.2 | 126.8 |
| Q2 | 95.2 | 106.4 | 92.6 | 90.3 | 121.7 |
| Q3 | 99.8 | 106.9 | 93.5 | 91.1 | 110.9 |
| Q4 | 100.1 | 107.7 | 96.8 | 94.6 | 114.1 |
| 2022 | |||||
| Q1 | 100.6 | 108.5 | 97.9 | 92.6 | 115.9 |
| Q2 | 102.8 | 107.8 | 101.2 | 94.4 | 105.9 |
| Q3 | 102.9 | 109.1 | 101.4 | 97.0 | 100.7 |
| Q4 | 103.1 | 109.7 | 100.1 | 97.5 | 98.1 |
| 20223 | |||||
| Q1 | 104.3 | 108.7 | 101.5 | 99.9 | 93.0 |
| Q2 | 104.4 | 109.3 | 104.0 | 100.0 | 91.1 |
| Source: Statistics Canada, table 36-10-0104-01. | |||||
Non-residential business investment continued to strengthen toward mid-year, rising for the eighth time in nine quarters. Combined business outlays on non-residential structures and machinery and equipment (M&E) increased 2.5% in the second quarter of 2023, supported by higher outlays on engineering structures. Investment in M&E rose 2.7%, led by increases in aircraft and other transportation equipment. Business outlays on intellectual property products rose for the fifth time in the past six quarters.
Export volumes edged up 0.1% in the second quarter of 2023, after advancing 2.5% in the first. Higher exports of metal products and commercial services were offset by lower shipments of crude oil, wheat and canola. Import volumes were up 0.5%, led by higher shipments of metals, passenger vehicles and aircraft.
Household expenditures edged up 0.1% in the second quarter of 2023, after advancing 1.2% in the first. Higher spending on new trucks, vans and sport utility vehicles supported the increase as supply chain disruptions eased. Spending on other durables contracted, reflecting lower outlays on new passenger cars, furniture and furnishings, and recreation equipment. While household spending edged higher, per capita spending fell 0.7%, the third decline in the last four quarters.
Household incomes continue to rise
Household disposable income rose 2.6% as wages and salaries increased at their fastest pace in five quarters. Current dollar spending by households increased by 1.0% as the household savings rate edged above the five percent mark. Both household disposable income and savings remained well above their pre-pandemic levels. Disposable income in the quarter was 21% above its pre-pandemic baseline, while the savings rate, at 5.1%, was 2.3 percentage points higher than in late 2019.
Business productivity trends lower as labour costs rise
Business labour productivity, a measure of the volume of goods and services produced per hour worked, posted its 11th decline in the past 12 quarters. Productivity fell in both goods- and service-producing sectors, with declines in 9 of 16 industry groups. Labour productivity in the second quarter was 2.1% below its pre-pandemic baseline, while real total compensation per hour worked edged higher in recent quarters as inflationary pressures moderated (Chart 3).Note Nominal unit labour costs, which measure the payments to labour required to produce a unit of output, were 21% above levels observed in late 2019.

Data table for Chart 3
| Labour productivity | Real total compensation per hour worked | |
|---|---|---|
| index (Q1 2018=100) | ||
| 2018 | ||
| Q1 | 100.00 | 100.00 |
| Q2 | 100.54 | 99.16 |
| Q3 | 100.29 | 99.00 |
| Q4 | 100.21 | 101.95 |
| 2019 | ||
| Q1 | 100.56 | 101.63 |
| Q2 | 100.48 | 100.72 |
| Q3 | 100.58 | 101.86 |
| Q4 | 101.03 | 102.32 |
| 2020 | ||
| Q1 | 105.69 | 109.46 |
| Q2 | 119.24 | 131.43 |
| Q3 | 107.38 | 111.88 |
| Q4 | 105.72 | 108.41 |
| 2021 | ||
| Q1 | 104.71 | 104.38 |
| Q2 | 103.10 | 103.54 |
| Q3 | 101.86 | 102.83 |
| Q4 | 101.39 | 99.74 |
| 2022 | ||
| Q1 | 101.49 | 99.75 |
| Q2 | 101.14 | 97.29 |
| Q3 | 100.71 | 99.28 |
| Q4 | 100.27 | 101.24 |
| 2023 | ||
| Q1 | 99.50 | 102.10 |
| Q2 | 98.89 | 103.28 |
| Source: Statistics Canada, table 36-10-0206-01. | ||
Declines in homebuilding and retail activity toward mid-year
After widespread gains across industries supported growth in the first quarter of 2023, economy-wide output was little changed in the second. Lower wholesale, retail and construction activity detracted from growth toward mid-year, while increases in real estate activity and factory output mitigated declines. Wildfires in the spring also impacted production in several sectors, including agriculture, forestry and logging, and mining and oil and gas extraction. Measured on trend, economy-wise, output was largely unchanged from February to June (Chart 4).

Data table for Chart 4
| Gross Domestic Product (LHS) | Policy rate (RHS) | |
|---|---|---|
| month-over-month percentage growth | ||
| 2021 | ||
| June | 0.81 | 0.25 |
| July | 0.53 | 0.25 |
| August | 0.59 | 0.25 |
| September | 0.33 | 0.25 |
| October | 0.79 | 0.25 |
| November | 0.47 | 0.25 |
| December | 0.12 | 0.25 |
| 2022 | ||
| January | -0.22 | 0.25 |
| February | 0.68 | 0.25 |
| March | 0.67 | 0.50 |
| April | 0.09 | 1.00 |
| May | 0.28 | 1.00 |
| June | 0.23 | 1.50 |
| July | 0.14 | 2.50 |
| August | 0.24 | 2.50 |
| September | 0.10 | 3.25 |
| October | 0.04 | 3.75 |
| November | 0.10 | 3.75 |
| December | -0.09 | 4.25 |
| 2022 | ||
| January | 0.63 | 4.50 |
| February | 0.05 | 4.50 |
| March | 0.01 | 4.50 |
| April | -0.10 | 4.50 |
| May | 0.24 | 4.50 |
| June | -0.16 | 4.75 |
| July | 0.01 | 5.00 |
|
Notes: LHS refers to left hand scale and RHS refers to right hand scale. Policy rates are reported at month-end. Sources: Statistics Canada, table 36-10-0434-01 and Bank of Canada. |
||
Construction posted three declines during the first six months of 2023. Impacted by higher financing costs, residential construction continued to pull back steadily, contracting in 14 of the past 15 months. In June, residential activity was almost 30% below peak levels seen in spring 2021. Non-residential construction also edged down in spring 2023 and, at mid-year, was about 3% below levels observed at the end of 2022. By contrast, engineering construction continued to advance steadily during the first half of 2023.
While new builds have pulled back,Note home resale markets continued to rebound from lows early in the year. Activity at real estate agents and brokers rose steadily from February to June 2023. At mid-year, output at agents and brokers was up 23% from levels at the end of 2022, but still nearly 30% below levels observed in early 2022 before interest rates began to rise.
Retail activity slowed during the first half of 2023 as cost-of-living pressures continued to weigh on discretionary spending. Retail volumes have edged lower since February, reflecting declines at gas stations, furniture and home furnishings stores, and general merchandise stores. Accommodation and food services also edged lower toward mid-year, after reaching a pandemic-era peak in January. Wildfire activity impacted accommodation services in the spring.
Professional, scientific and technical services continued to expand steadily during the first half of 2023. Legal services, which are strongly impacted by housing market activity, partly rebounded after contracting sharply in 2022. Computer systems and design services continued to expand, albeit at a slower pace, and were 29% above pre-pandemic levels in June 2023.
Mining and oil and gas extraction rose steadily from January to April before wildfires and maintenance activities hampered production toward mid-year. Output in May was at its lowest level in four months before edging higher in June on increases in oil and gas extraction. Mining output was impacted by wildfires in June and was at its lowest level in 19 months.
Manufacturing output strengthened during the first half of 2023, buoyed by higher production at automakers and parts suppliers. Production at assembly plants rose swiftly in May and June and, at mid-year, was over one-third higher than in late 2022. Activity at parts suppliers strengthened in April and May before moderating in June. Increased auto production toward mid-year coincided with higher cross-border trade flows as supply chain challenges continue to ease.Note Measured on a volume basis, imports of motor vehicles and parts ramped up steadily into mid-year, while automotive exports essentially rebounded to pre-pandemic levels.
Real GDP was basically unchanged in July as 9 of 20 major industries posted gains. Resource extraction rebounded from declines due to wildfires, while decreases in manufacturing tempered gains. Accommodation and food services increased in July, while retail volumes continued to edge lower.
The strike at British Columbia marine ports had a negative but minimal impact on Canadian economic activity in July. Merchandise imports that were cleared at British Columbia marine ports fell 18.5% from June to July (not seasonally adjusted) as shipments from countries in the Pacific Rim—including China, Taiwan, South Korea, Peru and Japan—posted sizable declines.Note Exports leaving British Columbia ports fell to their lowest level since February 2020, in part reflecting lower shipments to Japan, South Korea and India. Over 1 in 10 Canadian manufacturing plants reported being impacted by the strike in July, primarily through shortages of raw materials and disruptions in transportation. Almost one in six retailers were affected, with motor vehicle and parts dealers reporting the largest impact.
Business openings slow at the mid-year mark
Business closures outpaced openings during the first half of 2023 as many firms continued to navigate high input costs, workforce-related challenges and higher borrowing costs. Business closures in the first half totalled 259,900, while openings totalled 254,400. Openings in June fell to their lowest level since March 2020. The number of active firms at the mid-year mark was 925,800, down about 4,000 from levels at the end of 2022.
Inflation eases but consumer prices continue to edge higher
Consumer inflation continued to ease during the first half of 2023 as base-year effects put downward pressure on the headline rate. Lower gasoline prices contributed substantially to the slower pace of headline inflation during the first half. Consumer inflation slowed to 2.8% in June, the first time in 27 months that the headline rate was below 3%. Annual price growth, excluding gasoline, declined to 4.0% in June.
Inflation accelerated in the summer months, rising to 3.3% in July and then 4.0% in August as the downward impact of lower gas prices on the headline rate moderated (Chart 5). Annual price growth, excluding gasoline, was 4.1% in both months.

Data table for Chart 5
| All-items | Food | Shelter | |
|---|---|---|---|
| year-over-year percentage change | |||
| 2019 | |||
| January | 1.4 | 2.8 | 2.4 |
| February | 1.5 | 3.2 | 2.4 |
| March | 1.9 | 3.6 | 2.7 |
| April | 2.0 | 2.9 | 2.7 |
| May | 2.4 | 3.5 | 2.7 |
| June | 2.0 | 3.5 | 2.5 |
| July | 2.0 | 3.8 | 2.3 |
| August | 1.9 | 3.6 | 2.4 |
| September | 1.9 | 3.7 | 2.3 |
| October | 1.9 | 3.7 | 2.6 |
| November | 2.2 | 3.4 | 2.5 |
| December | 2.2 | 3.0 | 2.8 |
| 2020 | |||
| January | 2.4 | 3.2 | 2.4 |
| February | 2.2 | 2.4 | 2.3 |
| March | 0.9 | 2.3 | 1.9 |
| April | -0.2 | 3.4 | 1.3 |
| May | -0.4 | 3.1 | 1.0 |
| June | 0.7 | 2.7 | 1.7 |
| July | 0.1 | 2.2 | 1.5 |
| August | 0.1 | 1.8 | 1.5 |
| September | 0.5 | 1.6 | 1.7 |
| October | 0.7 | 2.3 | 1.8 |
| November | 1.0 | 1.9 | 1.9 |
| December | 0.7 | 1.1 | 1.6 |
| 2021 | |||
| January | 1.0 | 1.0 | 1.4 |
| February | 1.1 | 1.8 | 1.4 |
| March | 2.2 | 1.8 | 2.4 |
| April | 3.4 | 0.9 | 3.2 |
| May | 3.6 | 1.5 | 4.2 |
| June | 3.1 | 1.3 | 4.4 |
| July | 3.7 | 1.7 | 4.8 |
| August | 4.1 | 2.7 | 4.8 |
| September | 4.4 | 3.9 | 4.8 |
| October | 4.7 | 3.8 | 4.8 |
| November | 4.7 | 4.4 | 4.8 |
| December | 4.8 | 5.2 | 5.4 |
| 2022 | |||
| January | 5.1 | 5.7 | 6.2 |
| February | 5.7 | 6.7 | 6.6 |
| March | 6.7 | 7.7 | 6.8 |
| April | 6.8 | 8.8 | 7.4 |
| May | 7.7 | 8.8 | 7.4 |
| June | 8.1 | 8.8 | 7.1 |
| July | 7.6 | 9.2 | 7.0 |
| August | 7.0 | 9.8 | 6.6 |
| September | 6.9 | 10.3 | 6.8 |
| October | 6.9 | 10.1 | 6.9 |
| November | 6.8 | 10.3 | 7.2 |
| December | 6.3 | 10.1 | 7.0 |
| 2023 | |||
| January | 5.9 | 10.4 | 6.6 |
| February | 5.2 | 9.7 | 6.1 |
| March | 4.3 | 8.9 | 5.4 |
| April | 4.4 | 8.3 | 4.9 |
| May | 3.4 | 8.3 | 4.7 |
| June | 2.8 | 8.3 | 4.8 |
| July | 3.3 | 7.8 | 5.1 |
| August | 4.0 | 6.8 | 6.0 |
| Source: Statistics Canada, table 18-10-0004-01. | |||
While inflation has eased considerably in 2023, prices have continued to rise. The cumulative pace of price growth over the first eight months of 2023 was similar to that observed during the first eight months of 2021, when inflationary pressures were beginning to build. Overall consumer prices, measured month over month, rose steadily from January to August 2023, and were 3.7% higher in August than at the end of 2022. In comparison, cumulative price growth over the first eight months of 2021 was 3.8%.
Higher mortgage interest costs and rising rental prices were important upward contributors to price growth during the first eight months of 2023. Mortgage interest costs, measured year over year, continued to rise steadily, reaching a record 30.9% in August as homeowners continued to adjust to the higher interest rate environment. Yearly price changes for rented accommodation, which reflect both new and existing rental contracts, averaged 5.6% from January to July, before edging up to 6.4% in August. Measured on a month-over-month basis, prices for rented accommodation have risen in 22 of the past 24 months as high rates of permanent and temporary immigration, coupled with sustained pressure on housing affordability, contributed to the strong demand for rental units.
After beginning the year in double-digit territory, food price inflation gradually eased over the first half of 2023. Food prices, measured year over year, were up 8.3% in June, before slowing to 7.8% in July and then 6.8% in August. Yearly increases in grocery prices edged below the seven percent mark in August 2023 for the first time since January 2022. Meat prices were 6.5% higher than in August 2022, while annual price increases for fresh vegetables remained under the double-digit mark for the fourth consecutive month. Fresh fruit prices were nearly unchanged year over year, while annual price increases for pasta products remained in double-digit territory for the 17th time in the past 18 months.
Broad-based inflationary pressures on food spending have begun to ease. At the end of 2022, the share of grocery spending on items that had seen price increases of more than 6.0% in the previous 12 months accounted for about 85% of the food expenditure basket, with the vast majority of that spending on items that had seen double-digit price increases. By August 2023, spending on items with annual price increases of more than 6.0% accounted for about two-thirds of grocery spending, with less than one-fifth of total spending on items in the double-digit range.Note
Data from the Canadian Survey on Business Conditions for the third quarter of 2023 underscore the challenges that many businesses continue to face from high inflation and elevated input costs. Over one-half of businesses (56.6%) expected rising inflation to be an obstacle in the coming months, while over two-fifths (44.7%) reported rising input costs to be a challenge. Over 40% of businesses also anticipated rising interest rates and debt costs to be an obstacle. One-quarter of businesses expected to raise their selling prices over the next three months, down slightly from earlier in the year.
Employment growth moderates as unemployment edges higher
The pace of employment growth has slowed after surging at the beginning of 2023. In January, employment rose by 150,000, adding to sizable gains in the last quarter of 2022.Note Monthly gains subsequently averaged 25,000 from February to August, supported by increases in transportation and warehousing, wholesale and retail trade, and health care and social assistance. Employment in construction, as of August, was down about 37,000 from levels at the start of the year. Over 80% of cumulative employment gains during the first eight months of 2023 were in full-time work. Annual growth in hourly wages averaged 4.9% over this period.
The unemployment rate edged higher in the spring, rising steadily from 5.0% in April to 5.5% in July as unemployment rose among younger, core-age and older workers. The rate held steady at 5.5% in August. The labour force data for that month also suggested that workers may be having more difficulty finding new employment opportunities, as the job-changing rate was significantly below its pre-pandemic average.Note
Population growth outpaces employment growth
Both the working-age population and labour force were expanding at a faster pace in 2023, within the context of strong population growth.Note Monthly increases in the working-age population averaged 78,000 over the first eight months of 2023, almost twice the average increase in employment (Chart 6). With population growth outpacing employment gains, the employment rate (the percentage of working-age persons who are employed) has edged lower and, at 61.9% in August, was just below its pre-pandemic baseline.

Data table for Chart 6
| 2022 | First eight months of 2023 | |
|---|---|---|
| thousands of persons | ||
| Working age population | 41.4 | 78.4 |
| Labour force | 18.1 | 57.7 |
| Employment | 34.1 | 40.5 |
| Source: Statistics Canada, table 14-10-0287-01. | ||
Unmet demand for workers continues to ease
Job vacancies trended lower in the first half of 2023 as businesses in many sectors continued to scale back their hiring intentions. Vacancies in the second quarter totalled 780,200, about 21% below peak levels reported in the second quarter of 2022. Vacancies were down 6.6% on a quarterly basis, led by declines in accommodation and food services, construction, and retail trade. Declines in sales and service occupations accounted for over half of the total reduction in vacancies in the quarter.
Vacancies remained elevated in health care and social assistance, at over twice pre-pandemic levels. Over 60% of vacancies for registered and licensed practical nurses had been ongoing for 90 days or more, signalling continued challenges around recruitment and retention.
The economy-wide job vacancy rate (vacant positions as a percentage of total labour demand) fell to 4.4% in the second quarter of 2023, the lowest rate in two years. Offered wages in the second quarter were up 4.4% on a year-over-year basis, down from 5.0% in the first.
Tightness in the labour market continued to ease steadily. In the second quarter, there were 1.4 unemployed persons for every job vacancy, up from 1.1 a year earlier. The pace at which easing is occurring is more apparent from recent monthly data. Vacancies fell to 701,300 in July, pushing the unemployment-to-vacancy ratio to 1.7, the highest level since August 2021 (Chart 7). Before the pandemic, the unemployment-to-job-vacancy ratio was typically above 2.0.

Data table for Chart 7
| Unemployment-to-job vacancy ratio (LHS) | Job vacancies (RHS) | |
|---|---|---|
| percent | number | |
| 2022 | ||
| January | 1.43 | 938,195 |
| February | 1.22 | 921,430 |
| March | 1.11 | 990,015 |
| April | 1.10 | 993,625 |
| May | 1.07 | 1,003,240 |
| June | 1.04 | 984,175 |
| July | 1.04 | 974,990 |
| August | 1.20 | 923,225 |
| September | 1.18 | 911,885 |
| October | 1.23 | 885,755 |
| November | 1.22 | 872,605 |
| December | 1.23 | 846,525 |
| 2023 | ||
| January | 1.21 | 864,125 |
| February | 1.28 | 835,385 |
| March | 1.31 | 801,475 |
| April | 1.32 | 801,440 |
| May | 1.41 | 777,425 |
| June | 1.54 | 744,370 |
| July | 1.66 | 701,305 |
|
Notes: RHS refers to right hand scale and LHS referes to left hand scale. Source: Statistics Canada, tables 14-10-0287-01 & 14-10-0432-01. |
||
Household wealth increases as mortgage borrowing slows
Household net worth rose 1.6% in the second quarter, supported by higher real estate values. Household wealth has now expanded for three consecutive quarters and has largely recovered from sizable losses during the second and third quarters of 2022. At $15.97 trillion, household net worth in the second quarter of 2023 was 28.7% above pre-pandemic levels.
Household credit market borrowing slowed during the first half of the year as households continued to adjust to higher interest rates. Mortgage borrowing in the second quarter fell to the lowest level since 2005 (Chart 8). The ratio of household credit-market debt to disposable income declined to 180.5%, while the household debt-to-asset ratio fell to 15.4%, about one percentage point under its pre-pandemic benchmark. The value of household currency and deposits edged up to $2.09 trillion and was 33% above levels observed in late 2019.

Data table for Chart 8
| Consumer credit | Non-mortgage loans | Mortgages | |
|---|---|---|---|
| billions of dollars | |||
| 2018 | |||
| Q1 | 3.3 | 3.5 | 17.3 |
| Q2 | 4.3 | 4.0 | 11.8 |
| Q3 | 4.5 | 2.4 | 13.7 |
| Q4 | 4.5 | 1.6 | 17.0 |
| 2020 | |||
| Q1 | 2.4 | 0.2 | 17.1 |
| Q2 | 2.5 | 0.0 | 18.6 |
| Q3 | 2.1 | 1.4 | 21.7 |
| Q4 | 2.7 | 1.9 | 21.8 |
| 2022 | |||
| Q1 | -6.8 | -0.3 | 30.9 |
| Q2 | -22.4 | 3.5 | 22.8 |
| Q3 | 4.8 | 1.2 | 29.6 |
| Q4 | -3.6 | 2.0 | 37.5 |
| 2022 | |||
| Q1 | -6.6 | 1.8 | 40.3 |
| Q2 | -2.8 | 2.6 | 58.2 |
| Q3 | 4.7 | 1.3 | 41.1 |
| Q4 | 4.5 | 1.5 | 46.5 |
| 2022 | |||
| Q1 | 6.8 | 0.3 | 41.6 |
| Q2 | 7.2 | -0.2 | 54.0 |
| Q3 | 5.6 | 0.8 | 32.3 |
| Q4 | 4.5 | 1.5 | 16.5 |
| 2023 | |||
| Q1 | 4.3 | 0.4 | 15.7 |
| Q2 | 4.4 | 1.2 | 11.6 |
| Source: Statistics Canada, table 38-10-0238-01. | |||
Higher living costs in recent quarters have disproportionally affected more financially vulnerable households, particularly those with lower incomes and in younger age groups. While low-income households have seen robust income gains over the past year (supported by higher transfers), these have not kept pace with rising cost-of-living expenses, leading to lower net savings. In contrast, high-income households have seen their net savings increase over the past year, supported by higher employment income and investment earnings.
Many households continue to adjust their behaviour in view of persistent inflation, elevated housing prices and rising debt service costs. As a group, younger households (those whose primary earner is younger than 35 years) have reduced their mortgage balances over the past year, leading to a decline in their debt-to-income ratio. Lower mortgage balances could reflect several factors, from potential young buyers opting out of the housing market to accelerated paydowns of existing mortgage debt in view of rising service costs. The average net worth of young households was $317,200 in the second quarter of 2023, up 0.7% from the second quarter of 2022.
References
Clarke, S., R. Lehto, and S. Sheldrick. 2023. Switching stores to cope with high inflation: Food sales at food and beverage stores and general merchandise stores. Economic and Social Reports. Catalogue no. 36-28-0001. Ottawa: Statistics Canada. DOI: https://doi.org/10.25318/36280001202300700005-eng.
Leung, D. and R. Macdonald. 2022. Real wages and productivity during the COVID-19 pandemic. Economic and Social Reports. Catalogue no. 36-28-0001. Ottawa: Statistics Canada. DOI: https://doi.org/10.25318/36280001202201000002-eng.
Li, B., R. Fair, and C. Johnston. 2023. Analysis on supply chain challenges and conditions in Canada, first quarter of 2023. Analysis in Brief. Catalogue no. 11-621-M. Ottawa: Statistics Canada.
Mitchell, T. and G. Gellatly. 2023. Assessing the rise in broad-based inflationary pressure during 2021 and 2022. Economic and Social Reports. Catalogue no. 36-28-0001. Ottawa: Statistics Canada. DOI: https://doi.org/10.25318/36280001202300200002-eng.
- Date modified: