
Economic and Social Reports
Occupational profile and work tasks of Canadian PhDs: Gender and field of study differences
DOI: https://doi.org/10.25318/36280001202201200002-eng
Skip to text
Text begins
Abstract
Most PhD (Doctor of Philosophy) graduates from Canadian universities work outside academia, but little is known about the nature of these jobs. Based on the 2016 Census, this study explores the nature of the occupations held by doctoral graduates who worked outside academia and the nature of the tasks they performed in these jobs. Outside academia, most men and women with doctorate degrees worked in various professional occupations, while a small share worked in managerial positions, and a smaller share still (around 10% on average) worked in jobs that typically do not require a university degree. Canadians with PhDs who worked outside academia generally held jobs in which analytical tasks were less important than those of university professors. In more than half of the broad fields of study examined, there were essentially no differences in the job task content between men and women, while in the remaining fields, differences were for the most part small. Compared with master’s degree graduates, doctoral graduates outside academia worked in jobs with higher importance scores for non-routine cognitive analytical tasks. Differences in the remaining tasks were generally small and varied in magnitude and direction across fields of study.
Keywords: occupation, job tasks, PhD
Authors
Aneta Bonikowska and Marc Frenette are with the Social Analysis and Modelling Division, Analytical Studies and Modelling Branch at Statistics Canada. Kristyn Frank is with the Health Analysis Division at Statistics Canada.
Acknowledgements
This study was funded by Women and Gender Equality Canada.
Introduction
Pursuing a PhD (Doctor of Philosophy degree) requires a significant investment of time and resources. Entry into a PhD program often coincides with the life stage at which individuals typically begin establishing a career and starting a family.Note In 2015, more than two-thirds of students enrolled in full-time doctoral programs in Canada were aged between 25 and 34 years (Looker, 2018). Consequently, the pursuit of a PhD is often associated with opportunity costs such as the loss of potential earnings and work experience (CCA, 2021), and the delay of family formation.
Despite these trade-offs, Canada’s postsecondary institutions have seen a steady increase in PhD enrolments, with a notable rise in women’s participation in doctoral programs (Statistics Canada, 2021a). Although there are variations across fields of study, the share of female PhD graduates rose from 41% to about 46% between 2000 and 2019 (Statistics Canada, 2021b). Women accounted for the majority of graduates in the fields of education and social sciences by 2000, and also in health and agriculture, natural resources and conservation by 2019 (Statistics Canada, 2021b).
Therefore, the costs of pursuing a doctoral degree do not appear to have been a serious barrier to pursuing a PhD, suggesting that the expected benefits are likely substantial. One of these benefits may be the careers that become available upon completion of a PhD. The decision to enter PhD programs may in fact be driven by students’ occupational aspirations. Indeed, previous research has found that the majority of PhD graduates indicated that they pursued a doctoral degree to become a professor (CCA, 2021; Etmanski et al., 2017; Maldonado et al., 2013). However, the intent to work as a professor varied by field of study, with PhD students in more applied fields such as engineering, architecture, and health indicating less interest in this career path (Edge & Munro, 2015; Etmanski et al., 2017). Gender was also a factor—women were more likely to report that they pursued a doctoral degree to become a professor than men. This finding remained true even after accounting for differences in marital status, dependent children and field of study (Etmanski et al., 2017).
Given the increase in PhD enrolments and decreasing professorship positions (Statistics Canada, 2021c), many universities are developing resources to support students transitioning into non-academic jobs, in particular for those outside of professionally oriented programs (Edge & Munro, 2015). Gender and field of study differences exist in the share of PhD students who access these services, which could affect their employment outcomes outside academia. For example, male PhD students were more likely to use these resources than their female counterparts, while engineering PhD students were more likely than PhD students from all other fields to use the career services provided by their institutions (Arnold & Smith, 2015).Note Moreover, given the imbalance between doctoral graduates and professorship opportunities, a better understanding of the opportunities and career outcomes of PhD graduates is needed (Baker & Vasseur, 2021). Therefore, information about the type of jobs held by PhD graduates employed outside academia will be useful for skill development and career planning initiatives aimed at PhD students.
This study examines gender differences in the types of jobs held by doctoral graduates who worked outside academia in 2016. In addition to comparing occupations, the analysis focuses on examining the task content of jobs. The study will answer three questions:
- What proportion of doctoral graduates worked in academia, by gender and field of study?
- What were the gender differences in the occupational profile and work tasks performed in the jobs held by doctoral graduates outside academia, by field of study?
- How did the work tasks of doctoral graduates outside academia compared with those held by master’s degree graduates, by gender and field of study?
The analysis is based on the 2016 Census data and focuses on individuals aged 30 to 59 years who held a doctoral degree obtained in Canada and were in the Canadian labour market in 2016.
Findings from this study will help to address several important knowledge gaps. First, gender differences in doctoral graduates’ occupations and work tasks will be reported by field of study, thus providing a more nuanced understanding of the work that men and women with PhDs do outside academia. Additionally, comparisons between the occupational outcomes of PhD graduates working outside academia with those of master’s degree graduates will provide insight into whether PhD graduates require higher levels of skills in their jobs and whether this differs by gender. Examining the task content of jobs held by male and female doctoral graduates (in general and compared with those of master’s degree graduates) will highlight the extent to which each group works in jobs that typically require the ability to analyze data and information, creative thinking, supervising others, etc. (i.e., non-routine cognitive tasks), as opposed to jobs that involve more routine tasks that (a) could be performed by workers with lower levels of education, and (b) are less stable because of more susceptibility than other jobs to automation (Acemoglu & Restrepo, 2021). Furthermore, since postsecondary institutions’ career services are sometimes criticized for focusing on graduate students generally rather than on the unique situation of PhD students (Edge & Munro, 2015), the results of this study can be used to provide better career resources for PhD students. Lastly, the study will also provide useful information for PhD students who may be seeking more information on non-academic career paths.
Literature review
While the structure of PhD programs is often focused on training graduates for academic positions, most PhD graduates are not employed as university professors (Edge & Munro, 2015). Additionally, there is evidence of a decline in tenure-track positions, with the number of assistant professors in Canada decreasing between 2010 and 2020 (Statistics Canada, 2021c). Nevertheless, the employment outcomes of these graduates are strong, with lower unemployment rates and higher earnings than master’s and bachelor’s degree holders (CCA, 2021; Edge & Munro, 2015). Among PhD graduates, the highest earners are represented in a range of fields of study. For women, PhD graduates who studied nursing, business administration or educational administration earned the most, while for men, PhD graduates in business administration, computer engineering or computer science were the highest earners (Frenette & Handler, 2020).
In light of decreasing professorship opportunities for PhD graduates (Statistics Canada, 2021c), postsecondary institutions have been focusing more attention on the labour market outcomes of their alumni. For example, Concordia University (2020), McGill University (2021), the University of Alberta (2019), the University of British Columbia (Porter et al., 2017) and the University of Toronto (Reithmeier et al., 2019; University of Toronto, n.d.) have been tracking the outcomes of recent PhD graduates. Much of this work draws on publicly available information that graduates have shared online, such as LinkedIn profiles or work-related web pages. Online information for the 2009 cohort of Ontario’s doctoral graduates was also analyzed to determine their employment after graduation (Jonker, 2016). Additionally, the Track Report Connect Exchange project has interviewed graduates of social sciences, humanities and fine arts PhD programs to provide more information about their pathways after completing their studies (McAlpine & Austin, 2018; TRaCE, n.d.).
These projects largely focused on whether PhD graduates were employed in or outside academia after graduation, and most examined differences by gender and field of study. Generally, women were more likely than men to work in the postsecondary education sector following graduation, although this finding did not necessarily mean they were employed in full-time tenured or tenure-track positions, or even as professors (Jonker, 2016; McGill University, 2021; University of Toronto, n.d.). In fact, despite a higher share of women working in the postsecondary sector, men were more likely than women to be full-time university professors, mainly in research-intensive positions (Baker & Vasseur, 2021; CCA, 2021; Jonker, 2016; Porter et al., 2017). Most PhD graduates who worked in academia but were not employed as professors tended to be in administrative or research support jobs or were sessional instructors (CCA, 2021; Edge & Munro, 2015). Results also showed that PhD graduates from engineering and science programs were more likely to be employed outside of academia, while PhD graduates from business, humanities and social science programs were more likely to be employed in the postsecondary education sector (Jonker, 2016; Porter et al., 2017).
Studies examining the employment of PhD graduates outside academia have mostly focused on the industry of work. Results indicated that women were more likely than their male counterparts to be working in the public or non-profit sectors, while men were more likely than their female counterparts to be working in the private sector (Concordia University, 2020, University of Toronto, n.d.). Results for field of study showed that PhD graduates from business, science and engineering programs were more likely than PhD graduates from other fields to be working in the private sector, while a higher share of arts PhD graduates worked in the non-profit sector compared with the PhD graduates of other fields (Concordia University, 2020; McGill University, 2021; University of Alberta, 2019; University of Toronto, n.d.).
One limitation of these studies is that the methodologies used result in findings that may not be representative of all PhD graduates in Canada. For example, studies that employ web-based searches and social networking sites (e.g., Jonker, 2016; Reithmeier et al., 2019) are limited to only the individuals who chose to share their work information online. These data may be skewed toward certain demographic characteristics; for example, among LinkedIn users, there is a higher proportion of men than women, and the majority of them are between the ages of 25 and 34 years (Newberry, 2021). Reliance on social networking sites may give an inaccurate estimate of the proportion of graduates who work outside academia. For example, Bauffaldi et al. (2017) found that among PhD graduates in engineering, those who were interested in non-academic jobs were more likely to have a LinkedIn account than their counterparts interested in pursuing academic jobs. It is also possible that the work information provided could be out of date at the time the study accessed their information. At the same time, interview-based studies are typically focused on graduates from specific fields of study (McAlpine & Austin, 2018; TRaCE, n.d.), resulting in findings that are not generalizable to other PhD graduates. Using census data, the current study will address the need for a national-level analysis of occupational outcomes representative of all PhD graduates in Canada.
Moreover, while these studies provide additional knowledge about the industries in which PhD graduates work, less is known about what their work entails and the skills they require to work outside academia. This information in particular is important to determine, because doctoral students commonly face a skills awareness gap (CCA, 2021: 87). This gap includes a lack of understanding of how to translate the skills developed during their program to the non-academic labour market and how to communicate these skills to potential employers (Baker & Vasseur, 2021; CCA, 2021; Edge & Munro, 2015; Rose, 2013). Although some PhD students change their career plans as they become more aware of the realities of the academic labour market (Roach & Sauermann, 2017), there is little information to inform them about the skills they may need to make that change.
Previous research has examined the occupational skill requirements of young (aged 25 to 34 years) doctoral graduates and found that their skill level requirements were generally higher than that of master’s and bachelor’s degree holders (Frenette & Frank, 2017). Doctoral degree holders had higher skill level requirements in reading comprehension, writing, science as well as in process, complex problem solving and systems skills (e.g., critical thinking, active learning, systems analysis) than workers with lower levels of education. However, lower skill requirements in resource management and technical skills were found for PhD graduates. While these results provide some clarity on the skills that doctoral graduates generally use in their jobs, those working in and outside academia were not studied separately. Therefore, a more detailed look at the occupations and work tasks of those employed in non-academic jobs is warranted, in particular considering the ongoing transformation of many occupations because of automation (Frank et al., 2021).
Data, sample and methods
This analysis is based on the 2016 Census data. The sample consists of individuals aged 30 to 59 yearsNote whose highest completed level of education is a doctorate or a master’s degree, who obtained this degree in Canada,Note and who were in the labour force during census reference week. Individuals who graduated between 2014 and 2016 or were enrolled in postsecondary education during this period were excluded from the sample. This exclusion ensures that individuals in the sample were available for full-time employment (which they likely would not have been if they were still full-time students) and have had some time to find more permanent employment. To impose the restriction on graduation year and enrolment, the Census 2016 data were linked to the Postsecondary Student Information System (PSIS), an administrative data source that contains virtually allNote postsecondary enrolments in Canadian public postsecondary institutions. Individuals in the census whose linkage key to administrative files such as PSIS is unavailable, non-permanent residents, individuals whose highest completed degree was in two broad field of study groups with very small sample sizesNote and those in occupations that could not be matched to the O*NET data (an occupational database of job descriptors described below)Note were also excluded.
Note that some doctoral graduates from Canadian universities leave Canada for jobs abroad. This study reports results that are representative of the graduates who remained in Canada and were engaged in the Canadian labour market in 2016.
The analysis starts with a comparison of broader occupation groups between men and women who hold PhDs. However, different occupation titles alone do not tell us how similar or different these jobs are from the job of a university professor in terms of the activities and responsibilities typically performed in them. Instead, the remaining analysis focuses on comparing the typical task content of jobs held by men and women who hold PhDs, and further between PhD graduated and master’s degree graduates by gender, specifically by analyzing the importance of five groups of tasks in those jobs.
The source of information on job task content is the U.S. O*NET 2018 that provides rich data on work activities, work context, abilities and skills typical of a broad range of occupations. These job descriptors have been mapped into the Canadian National Occupational Classification (NOC 2016). This study uses a subset of 16 work activities, work context and abilities from O*NET to construct measures of five task groups used to characterize jobs in previous studies (Acemoglu & Autor, 2011; Autor & Handel, 2013):Note
- non-routine cognitive analytical tasks: analyzing data or information, thinking creatively, and interpreting the meaning of information for others
- non-routine cognitive interpersonal tasks: establishing and maintaining interpersonal relationships; guiding, directing and motivating subordinates; and coaching and developing others
- routine cognitive tasks: repeating the same tasks, being exact or accurate, and structured versus unstructured work
- routine manual tasks: pace determined by speed of equipment, controlling machines and processes, and time spent making repetitive motions
- non-routine manual and physical tasks: operating vehicles, mechanized devices or equipment; time spent using hands to handle, control or feed objects, tools or controls; spatial orientation; and manual dexterity.
Each of the five task types is a simple average of the importance scales of the component O*NET work activity, work context and ability variables listed above. Each task group is measured on a scale from 1 to 5, where 5 indicates a high importance of the task for a given occupation and 1 indicates low importance.Note
The task importance scores correlate with the skill level of jobs in an intuitive way (Table 1).Note In the general population of workers aged 15 years and older in Canada, the importance of non-routine cognitive tasks is highest, on average, for managerial and professional occupations (the highest skill level), with non-routine cognitive analytical tasks being most important for professionals (an average score of 3.8 on a scale of 1 to 5), and non-routine cognitive interpersonal tasks being most important for managers (an average score of 3.9 on a scale of 1 to 5). Average scores for the importance of both types of non-routine cognitive tasks fall with the level of skill required on the job, to an average of 2.5 for analytical and 2.8 for interpersonal tasks in jobs requiring typically on-the-job training (the lowest skill level).
The opposite is true for the remaining three types of tasks. The average importance scores of routine cognitive tasks increase somewhat as the skill required on the job falls, from 2.9 among managers to 3.2 among each of the three lowest skill levels. Average importance scores for routine manual and non-routine manual and physical tasks increase by roughly a point as one moves from the most skilled jobs to the least, from an average of 1.9 to 3.0 for routine manual tasks, and from 1.9 to 2.8 for non-routine manual and physical tasks.
| Skill level A: Managers | Skill level A: Professionals | Skill level B: College or apprenticeship training | Skill level C: High school or job-specific training | Skill level D: On-the-job training | |
|---|---|---|---|---|---|
| average importance score | |||||
| Non-routine cognitive, analytical | 3.6 | 3.8 | 3.1 | 2.9 | 2.5 |
| Non-routine cognitive, interpersonal | 3.9 | 3.4 | 3.1 | 2.9 | 2.8 |
| Routine cognitive | 2.9 | 3.0 | 3.2 | 3.2 | 3.2 |
| Routine manual | 1.9 | 1.9 | 2.6 | 2.6 | 3.0 |
| Non-routine manual and physical | 1.9 | 1.8 | 2.5 | 2.5 | 2.8 |
|
Note: Sample includes individuals aged 15 and older, in the labour force, with valid occupation and O*NET information, at all education levels. Sources: Statistics Canada, Census of Population, 2016; and U.S. Department of Labor, O*NET, 2018. |
|||||
Differences in average task importance scores between men and women and between doctoral graduates and master’s degree graduates, for men and women separately, were all estimated in a regression framework. Regressions were run separately by field of study, and included the following covariates: age, age squared, an indicator for being an immigrant, and an indicator for being neither White nor Indigenous. The differences are expressed in percentage terms.Note
Share of doctoral graduates in and outside academia
Overall, nearly one-third of male and female doctoral graduates worked as university professors or lecturers (Table 2).Note This proportion varied substantially by field of study. The highest proportion of graduates to work as university professors and lecturersNote was among graduates from business, management and public administration programs (58.2% of men and 59.1% of women). The lowest was among graduates from health and related fields (16.9% of men and 22.0% of women). Within fields of study, the differences between men and women were generally small. The biggest difference was observed among graduates in social and behavioural sciences and law programs, where 30.3% of women were university professors, compared with 40.4% of men.Note
Women with PhDs were as likely as or more likely than men with PhDs to work as postsecondary teaching or research assistants, although their overall shares working in this occupation group were small (3.7% of women and 3.1% of men). The difference in their respective shares in this occupation was largest among graduates in physical and life sciences and technologies programs, where 5.0% of men and 7.4% of women worked as postsecondary teaching or research assistants.
A similarly small share of doctoral graduates worked as college and other vocational instructors (3.7% of women and 3.3% of men).Note The highest share of graduates working in that occupation group was found among graduates in humanities programs, at 11.1% and 11.7% among men and women, respectively.
This means that a little over 61% of men and women holding PhDs worked in various other occupations.
| University professors and lecturers | Post-secondary teaching and research assistants | College and other vocational instructors | Occupations outside academia | |
|---|---|---|---|---|
| percent | ||||
| Men | ||||
| Education | 44.5 | 1.5 | 4.1 | 49.9 |
| Visual and performing arts, and communications technologies | 42.5 | Note x: suppressed to meet the confidentiality requirements of the Statistics Act | Note x: suppressed to meet the confidentiality requirements of the Statistics Act | 52.5 |
| Humanities | 47.1 | 0.7 | 11.1 | 41.2 |
| Social and behavioural sciences and law | 40.4 | 1.9 | 3.4 | 54.3 |
| Business, management and public administration | 58.2 | Note x: suppressed to meet the confidentiality requirements of the Statistics Act | Note x: suppressed to meet the confidentiality requirements of the Statistics Act | 39.5 |
| Physical and life sciences and technologies | 26.8 | 5.0 | 2.6 | 65.6 |
| Mathematics, computer and information sciences | 38.9 | 2.4 | 5.6 | 53.1 |
| Architecture, engineering, and related technologies | 25.1 | 3.1 | 2.0 | 69.8 |
| Agriculture, natural resources and conservation | 25.5 | 5.9 | 1.7 | 66.9 |
| Health and related fields | 16.9 | 2.7 | 0.6 | 79.8 |
| Total (all fields of study) | 31.6 | 3.1 | 3.3 | 61.9 |
| Women | ||||
| Education | 45.9 | 2.1 | 4.6 | 47.4 |
| Visual and performing arts, and communications technologies | 35.1 | Note x: suppressed to meet the confidentiality requirements of the Statistics Act | Note x: suppressed to meet the confidentiality requirements of the Statistics Act | 61.3 |
| Humanities | 52.3 | 2.1 | 11.7 | 33.9 |
| Social and behavioural sciences and law | 30.3 | 2.1 | 3.2 | 64.4 |
| Business, management and public administration | 59.1 | Note x: suppressed to meet the confidentiality requirements of the Statistics Act | Note x: suppressed to meet the confidentiality requirements of the Statistics Act | 39.1 |
| Physical and life sciences and technologies | 23.1 | 7.4 | 3.2 | 66.3 |
| Mathematics, computer and information sciences | 38.6 | 4.3 | 6.4 | 50.7 |
| Architecture, engineering, and related technologies | 29.0 | 4.9 | 2.2 | 63.9 |
| Agriculture, natural resources and conservation | 22.6 | Note x: suppressed to meet the confidentiality requirements of the Statistics Act | Note x: suppressed to meet the confidentiality requirements of the Statistics Act | 71.1 |
| Health and related fields | 22.0 | 2.8 | 0.8 | 74.4 |
| Total (all fields of study) | 31.6 | 3.7 | 3.7 | 61.1 |
|
x suppressed to meet the confidentiality requirements of the Statistics Act Note: Percentages may not add up to 100.0% because of rounding. Sources: Statistics Canada, Census of Population, 2016 and Postsecondary Student Information System. |
||||
Characteristics of Canadian doctoral graduates who worked outside academia
The highest number of doctoral graduates who worked outside academia obtained their degree in the broad area of physical and life sciences and technologiesNote at 30.3% (Table 3). In second place was the area of social and behavioural sciences and law with 21.1% of graduates.Note Relatively few individuals held doctorates in visual and performing arts, and communications technologies (1.2% of graduates) and agriculture, natural resources and conservation (2.9%).
The share of doctoral graduates who were women varied substantially by field of study. It was highest among graduates from education programs (66.1%), followed by social and behavioural sciences and law programs (63.9%) and health and related fields (52.6%). This share fell to under one-quarter among graduates from mathematics and computer and information sciences programs, and a low of less than 15% among graduates from architecture, engineering and related technologies programs (essentially engineering).
| Percent of total | Percent of women | Men | Women | Men | Women | Did not report being White or having an Indigenous identity | ||
|---|---|---|---|---|---|---|---|---|
| Men | Women | |||||||
| percent | mean age | percent of immigrant | percent | |||||
| Education | 2.9 | 66.1 | 50.4 | 49.3 | 20.4 | 24.4 | 12.8 | 12.3 |
| Visual and performing arts, and communications technologies | 1.2 | 49.2 | 44.5 | 45.3 | 18.7 | 24.1 | Note ...: not applicable | Note ...: not applicable |
| Humanities | 5.5 | 42.2 | 48.4 | 47.0 | 26.0 | 26.0 | Note ...: not applicable | Note ...: not applicable |
| Humanities and visual and performing arts, and communications technologies | Note ...: not applicable | Note ...: not applicable | Note ...: not applicable | Note ...: not applicable | Note ...: not applicable | Note ...: not applicable | 10.3 | 11.0 |
| Social and behavioural sciences and law | 21.1 | 63.9 | 46.0 | 43.9 | 24.0 | 16.9 | 17.6 | 12.9 |
| Business, management and public administration | 2.2 | 47.3 | 47.4 | 46.8 | 43.6 | 34.8 | 32.4 | 20.3 |
| Physical and life sciences and technologies | 30.3 | 37.0 | 46.7 | 44.2 | 34.4 | 33.2 | 25.0 | 20.8 |
| Mathematics, computer and information sciences | 4.2 | 23.4 | 44.1 | 43.5 | 58.7 | 76.0 | 43.9 | 46.0 |
| Architecture, engineering, and related technologies | 15.2 | 13.4 | 45.3 | 42.8 | 65.8 | 71.1 | 55.2 | 59.0 |
| Agriculture, natural resources and conservation | 2.9 | 39.7 | 48.6 | 46.6 | 42.7 | 37.2 | 34.3 | 24.5 |
| Health and related fields | 14.5 | 52.6 | 46.4 | 43.7 | 26.9 | 21.7 | 22.4 | 19.7 |
|
... not applicable Sources: Statistics Canada, Census of Population, 2016 and Postsecondary Student Information System. |
||||||||
Men and women within a given field of study differed in several characteristics that could affect the types of jobs they held. Women with doctorates were generally younger than men, particularly in the science fields. A higher proportion of women than men were immigrants in several fields of study, particularly among graduates in mathematics and computer and information sciences where 76% of women were immigrants, over 17 percentage points higher than the corresponding share of men. In most fields, a higher share of women than men either reported being White or reported an Indigenous identity; the highest gender gaps of 10 percentage points or more were found among graduates in business, management and public administration and agriculture, natural resources and conservation.
Occupations of Canadian doctoral graduates who worked outside academia
Around three-quarters of PhD graduates who worked outside academia worked in professional occupations, with that proportion being slightly higher among women than men (Chart 1). A further 16.0% of men and 13.3% of women worked as middle or senior managers. Finally, around 10% of both men and women with PhDs worked in jobs that generally do not require a university education, with most of them in jobs that require college or apprenticeship training and few in jobs that require no more than a high school education or on-the-job training.

Data table for Chart 1
| Men | Women | |
|---|---|---|
| Skill level A: Professional occupations | 73.7 | 76.1 |
| Skill level A: Managers | 16.0 | 13.3 |
| Skill level B: Occupations requiring college or apprenticeship training |
7.6 | 7.5 |
| Skill levels C and D: Occupations requiring high school, job-specific training or on-the-job training |
2.8 | 3.2 |
| Sources: Statistics Canada, Census of Population, 2016 and Postsecondary Student Information System. | ||
The distribution across occupation skill groups (shown in Chart 1) varied somewhat across fields of study. Furthermore, differences in the occupation distribution between men and women were pronounced in some fields but not others (Table 4-1 and 4-2).
In most fields, the majority of men and women with PhDs worked in professional occupations. Furthermore, a high proportion of doctoral graduates worked in professional occupations in areas that appear aligned with the broad field of their doctorate. However, in some fields, different proportions of women and men worked in different types of professional jobs. For example, more women than men in some fields worked in professional occupations such as policy researchers, consultants or program officers (the majority of jobs held under the broad category of professional occupations in law and social community and government services), while more men than women worked in jobs classified as professional occupations in a particular field (e.g., chemist, electrical engineer, specialist physician, accountant). This was the case among doctoral graduates in the fields of business, management and public administration; physical and life sciences and technologies; architecture, engineering and related technologies; and health and related technologies.Note When examining those with PhDs in education who worked in professional occupations in education services, most worked as high school or elementary school teachers, with a higher share of women than men in the latter category. In other cases, more detailed occupation titles revealed individuals with multiple degrees whose line of work did not directly align with the field of study of their PhD but rather a different professional degree (e.g., individuals with a PhD in chemistry who worked as lawyers).
A substantial share of graduates in business, management and public administration and in education—around one-quarter—worked in occupations in specialized middle management.Note Among graduates in the remaining fields, the corresponding shares were lower than 13%, with the lowest proportions found among PhDs in health and related fields. Proportions of doctoral graduates in senior management occupations were in the single digits for both men and women in all fields. Overall, women with PhDs were less likely to hold management positions of any kind than were men with PhDs—by nearly 3 percentage points—although drawing decisive conclusions about gender differences in this respect within many fields of study is difficult given the relatively small sample sizes.
The proportion of PhD graduates who worked in occupations that do not generally require a university degree varied by field of study. It was highest among individuals with PhDs in visual and performing arts, communications technologies, and in humanities, where more than one in five graduates worked in jobs that do not require a university education. This share was the lowest, at less than 7%, among people with PhDs in health and related fields, and social and behavioural sciences and law. The types of jobs of PhD graduates from different fields included various administrative occupations. Some individuals worked in technical, rather than professional, occupations in particular fields. For example, some doctoral graduates from science fields worked in technical occupations related to natural and applied sciences and health. Similarly, graduates from non-science fields could be found in paraprofessional occupations in legal, social, community and education services. Gender differences in the share of PhD graduates who worked in lower-skilled occupations do not appear substantial, with more detailed comparisons being again hindered by small sample sizes, except for graduates from visual and performing arts and communications technologies, where a little over 10% of men worked in such jobs, compared with almost one-third of women. It is worth reminding that the smallest share of Canadian PhD graduates obtained their degrees in that broad field.
While most PhD graduates worked in professional occupations, and most in occupations that appear aligned with their broad field of study, it is difficult to understand the differences between jobs held by men and women with PhDs through a more granular examination of occupation titles given the large range of occupations represented and the small numbers of PhD graduates who worked in them. Instead, the remaining analysis focuses on a different dimension of jobs; it will not examine the job title or field of expertise, but rather the nature of the tasks that are most important in a particular job. The focus will be on understanding the extent to which these jobs differ from academic jobs for which doctoral programs prepare their students and the degree to which it may differ for men and women in different fields of study.
| Education | Visual and performing arts, and communications technologies | Humanities | Social and behavioural sciences and law | Business, management and public administration | Physical and life sciences and technologies | |||||||
|---|---|---|---|---|---|---|---|---|---|---|---|---|
| Men | Women | Men | Women | Men | Women | Men | Women | Men | Women | Men | Women | |
| Managers | ||||||||||||
| Senior management occupations | 4.0 | 3.5 | Note x: suppressed to meet the confidentiality requirements of the Statistics Act | Note x: suppressed to meet the confidentiality requirements of the Statistics Act | 6.0 | 1.9 | 3.5 | 2.5 | 4.4 | 8.5 | 4.8 | 2.4 |
| Specialized middle management occupations | 30.6 | 25.2 | Note x: suppressed to meet the confidentiality requirements of the Statistics Act | 11.4 | 10.9 | 11.5 | 9.6 | 6.4 | 24.1 | 25.2 | 10.6 | 12.3 |
| Middle management occupations in retail and wholesale trade and customer services | Note x: suppressed to meet the confidentiality requirements of the Statistics Act | Note x: suppressed to meet the confidentiality requirements of the Statistics Act | Note x: suppressed to meet the confidentiality requirements of the Statistics Act | Note x: suppressed to meet the confidentiality requirements of the Statistics Act | 2.4 | Note x: suppressed to meet the confidentiality requirements of the Statistics Act | 0.5 | Note x: suppressed to meet the confidentiality requirements of the Statistics Act | 3.7 | Note x: suppressed to meet the confidentiality requirements of the Statistics Act | 1.1 | 1.4 |
| Middle management occupations in trades, transportation, production and utilities | Note x: suppressed to meet the confidentiality requirements of the Statistics Act | Note x: suppressed to meet the confidentiality requirements of the Statistics Act | Note x: suppressed to meet the confidentiality requirements of the Statistics Act | Note x: suppressed to meet the confidentiality requirements of the Statistics Act | Note x: suppressed to meet the confidentiality requirements of the Statistics Act | Note x: suppressed to meet the confidentiality requirements of the Statistics Act | 0.9 | 0.3 | 3.8 | Note x: suppressed to meet the confidentiality requirements of the Statistics Act | 1.4 | 0.7 |
| Professionals | ||||||||||||
| Professional occupations in business and finance | 5.5 | 2.9 | Note x: suppressed to meet the confidentiality requirements of the Statistics Act | Note x: suppressed to meet the confidentiality requirements of the Statistics Act | 5.0 | 4.1 | 5.2 | 2.5 | 28.4 | 14.7 | 2.9 | 2.3 |
| Professional occupations in natural and applied sciences | Note x: suppressed to meet the confidentiality requirements of the Statistics Act | Note x: suppressed to meet the confidentiality requirements of the Statistics Act | Note x: suppressed to meet the confidentiality requirements of the Statistics Act | Note x: suppressed to meet the confidentiality requirements of the Statistics Act | 3.1 | Note x: suppressed to meet the confidentiality requirements of the Statistics Act | 4.3 | 1.1 | 5.5 | Note x: suppressed to meet the confidentiality requirements of the Statistics Act | 46.0 | 33.8 |
| Professional occupations in nursing | Note x: suppressed to meet the confidentiality requirements of the Statistics Act | Note x: suppressed to meet the confidentiality requirements of the Statistics Act | Note x: suppressed to meet the confidentiality requirements of the Statistics Act | Note x: suppressed to meet the confidentiality requirements of the Statistics Act | Note x: suppressed to meet the confidentiality requirements of the Statistics Act | Note x: suppressed to meet the confidentiality requirements of the Statistics Act | Note x: suppressed to meet the confidentiality requirements of the Statistics Act | 0.3 | Note x: suppressed to meet the confidentiality requirements of the Statistics Act | Note x: suppressed to meet the confidentiality requirements of the Statistics Act | Note x: suppressed to meet the confidentiality requirements of the Statistics Act | Note x: suppressed to meet the confidentiality requirements of the Statistics Act |
| Professional occupations in health (except nursing) | Note x: suppressed to meet the confidentiality requirements of the Statistics Act | Note x: suppressed to meet the confidentiality requirements of the Statistics Act | Note x: suppressed to meet the confidentiality requirements of the Statistics Act | Note x: suppressed to meet the confidentiality requirements of the Statistics Act | Note x: suppressed to meet the confidentiality requirements of the Statistics Act | Note x: suppressed to meet the confidentiality requirements of the Statistics Act | Note x: suppressed to meet the confidentiality requirements of the Statistics Act | 0.8 | Note x: suppressed to meet the confidentiality requirements of the Statistics Act | Note x: suppressed to meet the confidentiality requirements of the Statistics Act | 7.5 | 8.6 |
| Professional occupations in education services | 26.0 | 29.1 | 13.0 | 6.8 | 8.6 | 8.5 | 1.0 | 0.9 | Note x: suppressed to meet the confidentiality requirements of the Statistics Act | Note x: suppressed to meet the confidentiality requirements of the Statistics Act | 1.5 | 2.1 |
| Professional occupations in law and social, community and government services | 14.4 | 17.4 | Note x: suppressed to meet the confidentiality requirements of the Statistics Act | Note x: suppressed to meet the confidentiality requirements of the Statistics Act | 27.8 | 27.6 | 64.0 | 78.7 | 16.0 | 23.9 | 12.1 | 18.2 |
| Professional occupations in art and culture | Note x: suppressed to meet the confidentiality requirements of the Statistics Act | 5.4 | 67.0 | 44.1 | 14.1 | 17.5 | 1.5 | 1.0 | Note x: suppressed to meet the confidentiality requirements of the Statistics Act | Note x: suppressed to meet the confidentiality requirements of the Statistics Act | 0.9 | 3.4 |
| Occupations requiring less than a university education | ||||||||||||
| Administrative and financial supervisors and administrative occupations | 5.9 | 5.5 | Note x: suppressed to meet the confidentiality requirements of the Statistics Act | Note x: suppressed to meet the confidentiality requirements of the Statistics Act | 4.4 | 9.5 | 3.0 | 2.3 | Note x: suppressed to meet the confidentiality requirements of the Statistics Act | 7.2 | 1.4 | 3.7 |
| Finance, insurance and related business administrative occupations | Note x: suppressed to meet the confidentiality requirements of the Statistics Act | Note x: suppressed to meet the confidentiality requirements of the Statistics Act | Note x: suppressed to meet the confidentiality requirements of the Statistics Act | Note x: suppressed to meet the confidentiality requirements of the Statistics Act | Note x: suppressed to meet the confidentiality requirements of the Statistics Act | Note x: suppressed to meet the confidentiality requirements of the Statistics Act | Note x: suppressed to meet the confidentiality requirements of the Statistics Act | Note x: suppressed to meet the confidentiality requirements of the Statistics Act | Note x: suppressed to meet the confidentiality requirements of the Statistics Act | Note x: suppressed to meet the confidentiality requirements of the Statistics Act | Note x: suppressed to meet the confidentiality requirements of the Statistics Act | 0.4 |
| Technical occupations related to natural and applied sciences | Note x: suppressed to meet the confidentiality requirements of the Statistics Act | Note x: suppressed to meet the confidentiality requirements of the Statistics Act | Note x: suppressed to meet the confidentiality requirements of the Statistics Act | Note x: suppressed to meet the confidentiality requirements of the Statistics Act | Note x: suppressed to meet the confidentiality requirements of the Statistics Act | Note x: suppressed to meet the confidentiality requirements of the Statistics Act | 0.9 | Note x: suppressed to meet the confidentiality requirements of the Statistics Act | Note x: suppressed to meet the confidentiality requirements of the Statistics Act | Note x: suppressed to meet the confidentiality requirements of the Statistics Act | 3.8 | 3.0 |
| Technical occupations in health | Note x: suppressed to meet the confidentiality requirements of the Statistics Act | Note x: suppressed to meet the confidentiality requirements of the Statistics Act | Note x: suppressed to meet the confidentiality requirements of the Statistics Act | Note x: suppressed to meet the confidentiality requirements of the Statistics Act | Note x: suppressed to meet the confidentiality requirements of the Statistics Act | Note x: suppressed to meet the confidentiality requirements of the Statistics Act | Note x: suppressed to meet the confidentiality requirements of the Statistics Act | Note x: suppressed to meet the confidentiality requirements of the Statistics Act | Note x: suppressed to meet the confidentiality requirements of the Statistics Act | Note x: suppressed to meet the confidentiality requirements of the Statistics Act | 0.6 | 0.6 |
| Paraprofessional occupations in legal, social, community and education services | Note x: suppressed to meet the confidentiality requirements of the Statistics Act | 2.5 | Note x: suppressed to meet the confidentiality requirements of the Statistics Act | Note x: suppressed to meet the confidentiality requirements of the Statistics Act | 2.6 | 3.7 | Note x: suppressed to meet the confidentiality requirements of the Statistics Act | 0.3 | Note x: suppressed to meet the confidentiality requirements of the Statistics Act | Note x: suppressed to meet the confidentiality requirements of the Statistics Act | 0.3 | 0.6 |
| Technical occupations in art, culture, recreation and sport | Note x: suppressed to meet the confidentiality requirements of the Statistics Act | Note x: suppressed to meet the confidentiality requirements of the Statistics Act | 7.9 | Note x: suppressed to meet the confidentiality requirements of the Statistics Act | 1.4 | Note x: suppressed to meet the confidentiality requirements of the Statistics Act | Note x: suppressed to meet the confidentiality requirements of the Statistics Act | 0.8 | Note x: suppressed to meet the confidentiality requirements of the Statistics Act | Note x: suppressed to meet the confidentiality requirements of the Statistics Act | 0.5 | 1.1 |
| Retail sales supervisors and specialized sales occupations | Note x: suppressed to meet the confidentiality requirements of the Statistics Act | Note x: suppressed to meet the confidentiality requirements of the Statistics Act | Note x: suppressed to meet the confidentiality requirements of the Statistics Act | Note x: suppressed to meet the confidentiality requirements of the Statistics Act | Note x: suppressed to meet the confidentiality requirements of the Statistics Act | Note x: suppressed to meet the confidentiality requirements of the Statistics Act | Note x: suppressed to meet the confidentiality requirements of the Statistics Act | 0.3 | Note x: suppressed to meet the confidentiality requirements of the Statistics Act | Note x: suppressed to meet the confidentiality requirements of the Statistics Act | 0.8 | 0.9 |
| Industrial, electrical and construction trades | Note x: suppressed to meet the confidentiality requirements of the Statistics Act | Note x: suppressed to meet the confidentiality requirements of the Statistics Act | Note x: suppressed to meet the confidentiality requirements of the Statistics Act | Note x: suppressed to meet the confidentiality requirements of the Statistics Act | 1.3 | Note x: suppressed to meet the confidentiality requirements of the Statistics Act | Note x: suppressed to meet the confidentiality requirements of the Statistics Act | Note x: suppressed to meet the confidentiality requirements of the Statistics Act | Note x: suppressed to meet the confidentiality requirements of the Statistics Act | Note x: suppressed to meet the confidentiality requirements of the Statistics Act | 0.3 | Note x: suppressed to meet the confidentiality requirements of the Statistics Act |
| Maintenance and equipment operation trades | Note x: suppressed to meet the confidentiality requirements of the Statistics Act | Note x: suppressed to meet the confidentiality requirements of the Statistics Act | Note x: suppressed to meet the confidentiality requirements of the Statistics Act | Note x: suppressed to meet the confidentiality requirements of the Statistics Act | Note x: suppressed to meet the confidentiality requirements of the Statistics Act | Note x: suppressed to meet the confidentiality requirements of the Statistics Act | Note x: suppressed to meet the confidentiality requirements of the Statistics Act | Note x: suppressed to meet the confidentiality requirements of the Statistics Act | Note x: suppressed to meet the confidentiality requirements of the Statistics Act | Note x: suppressed to meet the confidentiality requirements of the Statistics Act | Note x: suppressed to meet the confidentiality requirements of the Statistics Act | Note x: suppressed to meet the confidentiality requirements of the Statistics Act |
| Processing, manufacturing and utilities supervisors and central control operators | Note x: suppressed to meet the confidentiality requirements of the Statistics Act | Note x: suppressed to meet the confidentiality requirements of the Statistics Act | Note x: suppressed to meet the confidentiality requirements of the Statistics Act | Note x: suppressed to meet the confidentiality requirements of the Statistics Act | Note x: suppressed to meet the confidentiality requirements of the Statistics Act | Note x: suppressed to meet the confidentiality requirements of the Statistics Act | Note x: suppressed to meet the confidentiality requirements of the Statistics Act | Note x: suppressed to meet the confidentiality requirements of the Statistics Act | Note x: suppressed to meet the confidentiality requirements of the Statistics Act | Note x: suppressed to meet the confidentiality requirements of the Statistics Act | 0.5 | Note x: suppressed to meet the confidentiality requirements of the Statistics Act |
| Office support occupations | Note x: suppressed to meet the confidentiality requirements of the Statistics Act | Note x: suppressed to meet the confidentiality requirements of the Statistics Act | Note x: suppressed to meet the confidentiality requirements of the Statistics Act | Note x: suppressed to meet the confidentiality requirements of the Statistics Act | Note x: suppressed to meet the confidentiality requirements of the Statistics Act | 3.4 | Note x: suppressed to meet the confidentiality requirements of the Statistics Act | 0.3 | Note x: suppressed to meet the confidentiality requirements of the Statistics Act | Note x: suppressed to meet the confidentiality requirements of the Statistics Act | 0.6 | 1.7 |
| Care providers and educational, legal and public protection support occupations | Note x: suppressed to meet the confidentiality requirements of the Statistics Act | Note x: suppressed to meet the confidentiality requirements of the Statistics Act | Note x: suppressed to meet the confidentiality requirements of the Statistics Act | Note x: suppressed to meet the confidentiality requirements of the Statistics Act | Note x: suppressed to meet the confidentiality requirements of the Statistics Act | Note x: suppressed to meet the confidentiality requirements of the Statistics Act | Note x: suppressed to meet the confidentiality requirements of the Statistics Act | Note x: suppressed to meet the confidentiality requirements of the Statistics Act | Note x: suppressed to meet the confidentiality requirements of the Statistics Act | Note x: suppressed to meet the confidentiality requirements of the Statistics Act | Note x: suppressed to meet the confidentiality requirements of the Statistics Act | 0.7 |
| Sales representatives and salespersons—Wholesale and retail trade | Note x: suppressed to meet the confidentiality requirements of the Statistics Act | Note x: suppressed to meet the confidentiality requirements of the Statistics Act | Note x: suppressed to meet the confidentiality requirements of the Statistics Act | Note x: suppressed to meet the confidentiality requirements of the Statistics Act | 1.2 | Note x: suppressed to meet the confidentiality requirements of the Statistics Act | Note x: suppressed to meet the confidentiality requirements of the Statistics Act | Note x: suppressed to meet the confidentiality requirements of the Statistics Act | Note x: suppressed to meet the confidentiality requirements of the Statistics Act | Note x: suppressed to meet the confidentiality requirements of the Statistics Act | 0.4 | Note x: suppressed to meet the confidentiality requirements of the Statistics Act |
| Service representatives and other customer and personal services occupations | Note x: suppressed to meet the confidentiality requirements of the Statistics Act | Note x: suppressed to meet the confidentiality requirements of the Statistics Act | Note x: suppressed to meet the confidentiality requirements of the Statistics Act | Note x: suppressed to meet the confidentiality requirements of the Statistics Act | 2.7 | Note x: suppressed to meet the confidentiality requirements of the Statistics Act | Note x: suppressed to meet the confidentiality requirements of the Statistics Act | Note x: suppressed to meet the confidentiality requirements of the Statistics Act | Note x: suppressed to meet the confidentiality requirements of the Statistics Act | 3.4 | 0.3 | Note x: suppressed to meet the confidentiality requirements of the Statistics Act |
| Transport and heavy equipment operation and related maintenance occupations | Note x: suppressed to meet the confidentiality requirements of the Statistics Act | Note x: suppressed to meet the confidentiality requirements of the Statistics Act | Note x: suppressed to meet the confidentiality requirements of the Statistics Act | Note x: suppressed to meet the confidentiality requirements of the Statistics Act | Note x: suppressed to meet the confidentiality requirements of the Statistics Act | Note x: suppressed to meet the confidentiality requirements of the Statistics Act | 0.7 | Note x: suppressed to meet the confidentiality requirements of the Statistics Act | 4.3 | Note x: suppressed to meet the confidentiality requirements of the Statistics Act | 0.2 | Note x: suppressed to meet the confidentiality requirements of the Statistics Act |
| Total share of occupations requiring less than a university education | 8.0 | 14.0 | 11.8 | 31.9 | 20.8 | 25.4 | 8.8 | 5.2 | 13.0 | 17.2 | 11.2 | 14.5 |
|
x suppressed to meet the confidentiality requirements of the Statistics Act Notes: Two-digit NOC 2016 occupation groups. Occupation groups with zero counts or sample sizes too small for publication in all field-of-study—gender cells not shown in table. Sources: Statistics Canada, Census of Population, 2016 and Postsecondary Student Information System. |
||||||||||||
| Mathematics, computer and information sciences | Architecture, engineering, and related technologies | Agriculture, natural resources and conservation | Health and related fields | |||||
|---|---|---|---|---|---|---|---|---|
| Men | Women | Men | Women | Men | Women | Men | Women | |
| Managers | ||||||||
| Senior management occupations | 3.9 | Note x: suppressed to meet the confidentiality requirements of the Statistics Act | 5.5 | 3.0 | Note x: suppressed to meet the confidentiality requirements of the Statistics Act | Note x: suppressed to meet the confidentiality requirements of the Statistics Act | 1.7 | 1.2 |
| Specialized middle management occupations | 7.3 | 6.1 | 8.6 | 6.1 | 8.5 | 9.6 | 2.9 | 5.6 |
| Middle management occupations in retail and wholesale trade and customer services | Note x: suppressed to meet the confidentiality requirements of the Statistics Act | Note x: suppressed to meet the confidentiality requirements of the Statistics Act | 1.0 | Note x: suppressed to meet the confidentiality requirements of the Statistics Act | Note x: suppressed to meet the confidentiality requirements of the Statistics Act | Note x: suppressed to meet the confidentiality requirements of the Statistics Act | 0.6 | Note x: suppressed to meet the confidentiality requirements of the Statistics Act |
| Middle management occupations in trades, transportation, production and utilities | Note x: suppressed to meet the confidentiality requirements of the Statistics Act | Note x: suppressed to meet the confidentiality requirements of the Statistics Act | 1.1 | 2.0 | 6.6 | Note x: suppressed to meet the confidentiality requirements of the Statistics Act | 0.6 | Note x: suppressed to meet the confidentiality requirements of the Statistics Act |
| Professionals | ||||||||
| Professional occupations in business and finance | 5.8 | 6.5 | 1.3 | Note x: suppressed to meet the confidentiality requirements of the Statistics Act | 2.3 | Note x: suppressed to meet the confidentiality requirements of the Statistics Act | Note x: suppressed to meet the confidentiality requirements of the Statistics Act | 1.2 |
| Professional occupations in natural and applied sciences | 60.9 | 66.1 | 68.0 | 60.3 | 43.0 | 44.7 | 9.2 | 5.6 |
| Professional occupations in nursing | Note x: suppressed to meet the confidentiality requirements of the Statistics Act | Note x: suppressed to meet the confidentiality requirements of the Statistics Act | Note x: suppressed to meet the confidentiality requirements of the Statistics Act | Note x: suppressed to meet the confidentiality requirements of the Statistics Act | Note x: suppressed to meet the confidentiality requirements of the Statistics Act | Note x: suppressed to meet the confidentiality requirements of the Statistics Act | Note x: suppressed to meet the confidentiality requirements of the Statistics Act | 2.3 |
| Professional occupations in health (except nursing) | Note x: suppressed to meet the confidentiality requirements of the Statistics Act | Note x: suppressed to meet the confidentiality requirements of the Statistics Act | 0.4 | Note x: suppressed to meet the confidentiality requirements of the Statistics Act | 2.6 | Note x: suppressed to meet the confidentiality requirements of the Statistics Act | 71.6 | 66.1 |
| Professional occupations in education services | Note x: suppressed to meet the confidentiality requirements of the Statistics Act | Note x: suppressed to meet the confidentiality requirements of the Statistics Act | 0.4 | Note x: suppressed to meet the confidentiality requirements of the Statistics Act | Note x: suppressed to meet the confidentiality requirements of the Statistics Act | Note x: suppressed to meet the confidentiality requirements of the Statistics Act | 0.5 | Note x: suppressed to meet the confidentiality requirements of the Statistics Act |
| Professional occupations in law and social, community and government services | 8.8 | 5.8 | 4.6 | 9.4 | 20.3 | 22.5 | 5.2 | 10.1 |
| Professional occupations in art and culture | Note x: suppressed to meet the confidentiality requirements of the Statistics Act | Note x: suppressed to meet the confidentiality requirements of the Statistics Act | Note x: suppressed to meet the confidentiality requirements of the Statistics Act | Note x: suppressed to meet the confidentiality requirements of the Statistics Act | Note x: suppressed to meet the confidentiality requirements of the Statistics Act | Note x: suppressed to meet the confidentiality requirements of the Statistics Act | 0.6 | 0.5 |
| Occupations requiring less than a university education | ||||||||
| Administrative and financial supervisors and administrative occupations | Note x: suppressed to meet the confidentiality requirements of the Statistics Act | Note x: suppressed to meet the confidentiality requirements of the Statistics Act | 0.5 | Note x: suppressed to meet the confidentiality requirements of the Statistics Act | 2.6 | Note x: suppressed to meet the confidentiality requirements of the Statistics Act | 0.8 | 1.4 |
| Finance, insurance and related business administrative occupations | Note x: suppressed to meet the confidentiality requirements of the Statistics Act | Note x: suppressed to meet the confidentiality requirements of the Statistics Act | Note x: suppressed to meet the confidentiality requirements of the Statistics Act | Note x: suppressed to meet the confidentiality requirements of the Statistics Act | Note x: suppressed to meet the confidentiality requirements of the Statistics Act | Note x: suppressed to meet the confidentiality requirements of the Statistics Act | Note x: suppressed to meet the confidentiality requirements of the Statistics Act | Note x: suppressed to meet the confidentiality requirements of the Statistics Act |
| Technical occupations related to natural and applied sciences | 1.9 | Note x: suppressed to meet the confidentiality requirements of the Statistics Act | 3.4 | 2.1 | 5.1 | 5.3 | Note x: suppressed to meet the confidentiality requirements of the Statistics Act | Note x: suppressed to meet the confidentiality requirements of the Statistics Act |
| Technical occupations in health | Note x: suppressed to meet the confidentiality requirements of the Statistics Act | Note x: suppressed to meet the confidentiality requirements of the Statistics Act | Note x: suppressed to meet the confidentiality requirements of the Statistics Act | Note x: suppressed to meet the confidentiality requirements of the Statistics Act | Note x: suppressed to meet the confidentiality requirements of the Statistics Act | Note x: suppressed to meet the confidentiality requirements of the Statistics Act | 1.7 | 1.0 |
| Paraprofessional occupations in legal, social, community and education services | Note x: suppressed to meet the confidentiality requirements of the Statistics Act | Note x: suppressed to meet the confidentiality requirements of the Statistics Act | Note x: suppressed to meet the confidentiality requirements of the Statistics Act | Note x: suppressed to meet the confidentiality requirements of the Statistics Act | Note x: suppressed to meet the confidentiality requirements of the Statistics Act | Note x: suppressed to meet the confidentiality requirements of the Statistics Act | Note x: suppressed to meet the confidentiality requirements of the Statistics Act | Note x: suppressed to meet the confidentiality requirements of the Statistics Act |
| Technical occupations in art, culture, recreation and sport | 1.9 | Note x: suppressed to meet the confidentiality requirements of the Statistics Act | Note x: suppressed to meet the confidentiality requirements of the Statistics Act | Note x: suppressed to meet the confidentiality requirements of the Statistics Act | Note x: suppressed to meet the confidentiality requirements of the Statistics Act | Note x: suppressed to meet the confidentiality requirements of the Statistics Act | Note x: suppressed to meet the confidentiality requirements of the Statistics Act | Note x: suppressed to meet the confidentiality requirements of the Statistics Act |
| Retail sales supervisors and specialized sales occupations | Note x: suppressed to meet the confidentiality requirements of the Statistics Act | Note x: suppressed to meet the confidentiality requirements of the Statistics Act | 0.6 | Note x: suppressed to meet the confidentiality requirements of the Statistics Act | Note x: suppressed to meet the confidentiality requirements of the Statistics Act | Note x: suppressed to meet the confidentiality requirements of the Statistics Act | 1.1 | Note x: suppressed to meet the confidentiality requirements of the Statistics Act |
| Industrial, electrical and construction trades | Note x: suppressed to meet the confidentiality requirements of the Statistics Act | Note x: suppressed to meet the confidentiality requirements of the Statistics Act | 0.4 | Note x: suppressed to meet the confidentiality requirements of the Statistics Act | Note x: suppressed to meet the confidentiality requirements of the Statistics Act | Note x: suppressed to meet the confidentiality requirements of the Statistics Act | Note x: suppressed to meet the confidentiality requirements of the Statistics Act | Note x: suppressed to meet the confidentiality requirements of the Statistics Act |
| Maintenance and equipment operation trades | Note x: suppressed to meet the confidentiality requirements of the Statistics Act | Note x: suppressed to meet the confidentiality requirements of the Statistics Act | 0.5 | Note x: suppressed to meet the confidentiality requirements of the Statistics Act | Note x: suppressed to meet the confidentiality requirements of the Statistics Act | Note x: suppressed to meet the confidentiality requirements of the Statistics Act | Note x: suppressed to meet the confidentiality requirements of the Statistics Act | Note x: suppressed to meet the confidentiality requirements of the Statistics Act |
| Processing, manufacturing and utilities supervisors and central control operators | Note x: suppressed to meet the confidentiality requirements of the Statistics Act | Note x: suppressed to meet the confidentiality requirements of the Statistics Act | 0.6 | Note x: suppressed to meet the confidentiality requirements of the Statistics Act | Note x: suppressed to meet the confidentiality requirements of the Statistics Act | Note x: suppressed to meet the confidentiality requirements of the Statistics Act | Note x: suppressed to meet the confidentiality requirements of the Statistics Act | Note x: suppressed to meet the confidentiality requirements of the Statistics Act |
| Office support occupations | Note x: suppressed to meet the confidentiality requirements of the Statistics Act | Note x: suppressed to meet the confidentiality requirements of the Statistics Act | Note x: suppressed to meet the confidentiality requirements of the Statistics Act | Note x: suppressed to meet the confidentiality requirements of the Statistics Act | Note x: suppressed to meet the confidentiality requirements of the Statistics Act | Note x: suppressed to meet the confidentiality requirements of the Statistics Act | Note x: suppressed to meet the confidentiality requirements of the Statistics Act | 0.7 |
| Care providers and educational, legal and public protection support occupations | Note x: suppressed to meet the confidentiality requirements of the Statistics Act | Note x: suppressed to meet the confidentiality requirements of the Statistics Act | Note x: suppressed to meet the confidentiality requirements of the Statistics Act | Note x: suppressed to meet the confidentiality requirements of the Statistics Act | Note x: suppressed to meet the confidentiality requirements of the Statistics Act | Note x: suppressed to meet the confidentiality requirements of the Statistics Act | Note x: suppressed to meet the confidentiality requirements of the Statistics Act | Note x: suppressed to meet the confidentiality requirements of the Statistics Act |
| Sales representatives and salespersons—Wholesale and retail trade | Note x: suppressed to meet the confidentiality requirements of the Statistics Act | Note x: suppressed to meet the confidentiality requirements of the Statistics Act | Note x: suppressed to meet the confidentiality requirements of the Statistics Act | Note x: suppressed to meet the confidentiality requirements of the Statistics Act | Note x: suppressed to meet the confidentiality requirements of the Statistics Act | Note x: suppressed to meet the confidentiality requirements of the Statistics Act | Note x: suppressed to meet the confidentiality requirements of the Statistics Act | Note x: suppressed to meet the confidentiality requirements of the Statistics Act |
| Service representatives and other customer and personal services occupations | Note x: suppressed to meet the confidentiality requirements of the Statistics Act | Note x: suppressed to meet the confidentiality requirements of the Statistics Act | Note x: suppressed to meet the confidentiality requirements of the Statistics Act | Note x: suppressed to meet the confidentiality requirements of the Statistics Act | Note x: suppressed to meet the confidentiality requirements of the Statistics Act | Note x: suppressed to meet the confidentiality requirements of the Statistics Act | Note x: suppressed to meet the confidentiality requirements of the Statistics Act | Note x: suppressed to meet the confidentiality requirements of the Statistics Act |
| Transport and heavy equipment operation and related maintenance occupations | Note x: suppressed to meet the confidentiality requirements of the Statistics Act | Note x: suppressed to meet the confidentiality requirements of the Statistics Act | 0.3 | Note x: suppressed to meet the confidentiality requirements of the Statistics Act | Note x: suppressed to meet the confidentiality requirements of the Statistics Act | Note x: suppressed to meet the confidentiality requirements of the Statistics Act | Note x: suppressed to meet the confidentiality requirements of the Statistics Act | Note x: suppressed to meet the confidentiality requirements of the Statistics Act |
| Total share of occupations requiring less than a university education | 10.8 | 7.5 | 9.0 | 13.5 | 13.2 | 12.0 | 6.3 | 6.4 |
|
x suppressed to meet the confidentiality requirements of the Statistics Act Notes: Two-digit NOC 2016 occupation groups. Occupation groups with zero counts or sample sizes too small for publication in all field-of-study—gender cells not shown in table. Sources: Statistics Canada, Census of Population, 2016 and Postsecondary Student Information System. |
||||||||
Task content of jobs held by doctoral graduates
Analytical tasks carry the highest importance score of all five tasks examined in the job of a university professor or lecturer. The average importance score for analyzing data or information, thinking creatively, and interpreting the meaning of information for others is 4.2 on a 1-to-5 scale for these jobs (Chart 2). Interpersonal tasks—such as establishing and maintaining relationships with others and supervising others—carry a somewhat lower importance score, at 3.6, while routine cognitive and other manual tasks all score below 3. Compared against this benchmark, jobs in which PhD graduates worked outside academia had on average lower importance scores for analytical tasks (3.8), but had only marginally lower average scores for interpersonal tasks (3.5). The importance of routine cognitive tasks (e.g., tasks typically performed in clerical jobs), routine manual tasks (e.g., tasks associated with production or machine operation) and non-routine manual and physical tasks (e.g., tasks associated with many service jobs) was generally higher among graduates working outside academia than for university professors.

Data table for Chart 2
| Non-routine cognitive, analytical | Non-routine cognitive, interpersonal | Routine cognitive | Routine manual | Non-routine manual and physical | |
|---|---|---|---|---|---|
| University professors and lecturers | 4.2 | 3.6 | 2.7 | 1.7 | 1.5 |
| Post-secondary teaching and research assistants | 3.6 | 3.4 | 2.7 | 1.8 | 1.6 |
| College and other vocational instructors | 3.7 | 4.0 | 2.8 | 2.0 | 1.7 |
| Other jobs | 3.8 | 3.5 | 3.0 | 2.0 | 1.8 |
| Sources: Statistics Canada, Census of Population, 2016; U.S. Department of Labor, O*NET, 2018; and Statistics Canada, Postsecondary Student Information System. | |||||
Gender gap in job task content among doctoral graduates working outside academia
Comparing the average importance scores of non-routine cognitive tasks in jobs held by men and women with PhDs working outside academia, one salient observation is that in most fields of study these gaps were relatively small and mostly not statistically significant (Chart 3). The biggest gender differences in job tasks were observed among graduates in social and behavioural sciences and law. In this field of study, women were employed in occupations with a higher importance of both analytical and interpersonal tasks than men. This broad field of study, however, hides more nuanced differences. Among psychology graduates (more than half of those with PhDs in social and behavioural sciences and law), women held jobs with higher analytical task importance (by nearly 7%) and interpersonal task importance (by 4.5%) than did men. Among graduates from fields other than psychology, there was no statistically significant gap in the importance of analytical tasks. However, women held jobs in which interpersonal tasks received on average a nearly 14% higher importance rating than in jobs held by men.
Interpersonal tasks are generally more important in management positions than in most, but not all, other occupations. To evaluate the degree to which observed gender gaps in the importance of interpersonal tasks reflect that a higher (or lower) share of men than women with PhDs worked in management jobs, the regressions underlying Chart 3 were rerun, this time controlling for the skill level of the occupation (i.e., whether the job was a management job or a job not typically requiring a university education, with professional occupations as the reference group). The estimated gender gap was reduced in magnitude among graduates from education, visual and performing arts and communications technologies and humanities, suggesting that the gap can be partially accounted for by more men than women with PhDs in these fields working in management occupations. In the remaining fields, the gender gap either remained mostly unchanged or increased somewhat in the latter case implying that the gender gap in interpersonal tasks stems from differences in the types of occupations held by men and women within the broader occupation skill levels.
Somewhat bigger gender gaps were observed in routine manual and non-routine manual and physical tasks, with higher importance scores generally observed in jobs held by men than in those held by women (Chart 4) in many fields. However, these gaps, too, were not statistically significant for graduates from many fields of study. The 7.9% gap observed among graduates of social and behavioural sciences and law was only somewhat lowered after the skill level of occupations was controlled for in models. The gaps among PhD graduates in health and related fields in routine manual and non-routine manual and physical tasks also remained after controlling for occupation skill level and were still evident among the subsample of graduates who worked in professional occupations. These results suggest that some gender differences exist in occupations held by individuals who obtained PhDs from the same broad field of study, but that these are by and large rather small.
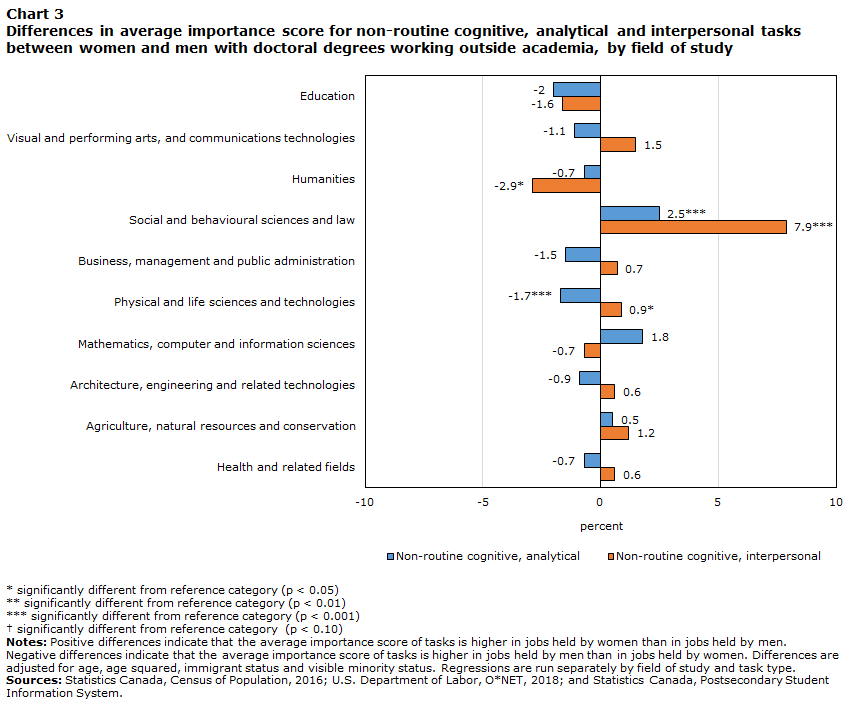
Data table for Chart 3
| Non-routine cognitive, analytical | percent | |
|---|---|---|
| Education | -2.0 | -2 |
| Visual and performing arts, and communications technologies | -1.1 | -1.1 |
| Humanities | -0.7 | -0.7 |
| Social and behavioural sciences and law | 2.5Note *** | 2.5Note *** |
| Business, management and public administration | -1.5 | -1.5 |
| Physical and life sciences and technologies | -1.7Note *** | -1.7Note *** |
| Mathematics, computer and information sciences | 1.8 | 1.8 |
| Architecture, engineering and related technologies | -0.9 | -0.9 |
| Agriculture, natural resources and conservation | 0.5 | 0.5 |
| Health and related fields | -0.7 | -0.7 |
| Non-routine cognitive, interpersonal | ||
| Education | -1.6 | -1.6 |
| Visual and performing arts, and communications technologies | 1.5 | 1.5 |
| Humanities | -2.9Note * | -2.9Note * |
| Social and behavioural sciences and law | 7.9Note *** | 7.9Note *** |
| Business, management and public administration | 0.7 | 0.7 |
| Physical and life sciences and technologies | 0.9Note * | 0.9Note * |
| Mathematics, computer and information sciences | -0.7 | -0.7 |
| Architecture, engineering, and related technologies | 0.6 | 0.6 |
| Agriculture, natural resources and conservation | 1.2 | 1.2 |
| Health and related fields | 0.6 | 0.6 |
Notes: Positive differences indicate that the average importance score of tasks is higher in jobs held by women than in jobs held by men. Negative differences indicate that the average importance score of tasks is higher in jobs held by men than in jobs held by women. Differences are adjusted for age, age squared, immigrant status and visible minority status. Regressions are run separately by field of study and task type. Sources: Statistics Canada, Census of Population, 2016; U.S. Department of Labor, O*NET, 2018; and Statistics Canada, Postsecondary Student Information System. |
||
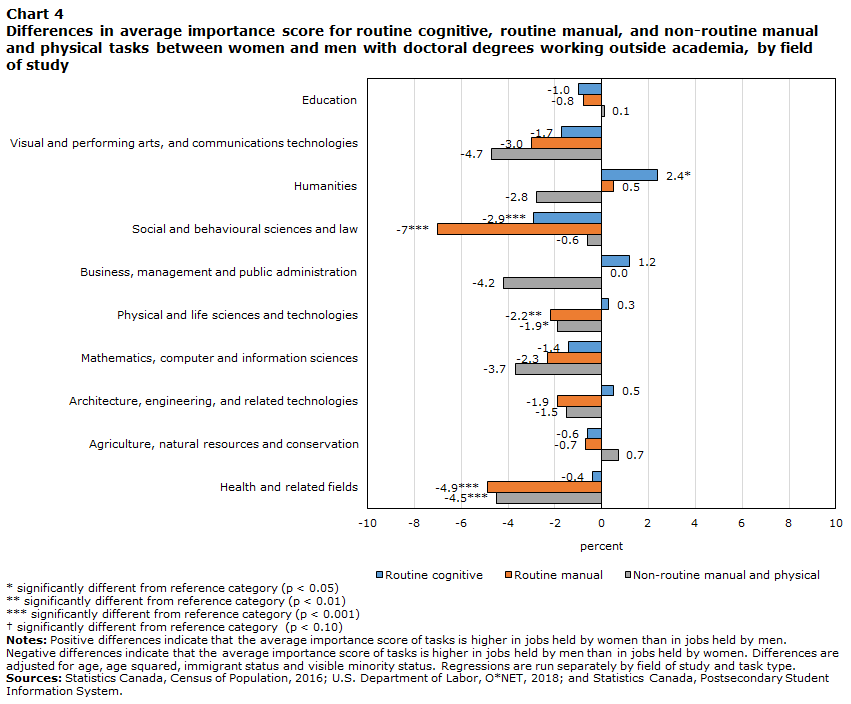
Data table for Chart 4
| Routine cognitive | percent | |
|---|---|---|
| Education | -1.0 | -1.0 |
| Visual and performing arts, and communications technologies | -1.7 | -1.7 |
| Humanities | 2.4Note * | 2.4Note * |
| Social and behavioural sciences and law | -2.9Note * | -2.9Note *** |
| Business, management and public administration | 1.2 | 1.2 |
| Physical and life sciences and technologies | 0.3 | 0.3 |
| Mathematics, computer and information sciences | -1.4 | -1.4 |
| Architecture, engineering, and related technologies | 0.5 | 0.5 |
| Agriculture, natural resources and conservation | -0.6 | -0.6 |
| Health and related fields | -0.4 | -0.4 |
| Routine manual | ||
| Education | -0.8 | -0.8 |
| Visual and performing arts, and communications technologies | -3.0 | -3.0 |
| Humanities | 0.5 | 0.5 |
| Social and behavioural sciences and law | -7.0Note *** | -7.0Note *** |
| Business, management and public administration | 0.0 | 0.0 |
| Physical and life sciences and technologies | -2.2Note ** | -2.2Note ** |
| Mathematics, computer and information sciences | -2.3 | -2.3 |
| Architecture, engineering, and related technologies | -1.9 | -1.9 |
| Agriculture, natural resources and conservation | -0.7 | -0.7 |
| Health and related fields | -4.9Note *** | -4.9Note *** |
| Non-routine manual and physical | ||
| Education | 0.1 | 0.1 |
| Visual and performing arts, and communications technologies | -4.7 | -4.7 |
| Humanities | -2.8 | -2.8 |
| Social and behavioural sciences and law | -0.6 | -0.6 |
| Business, management and public administration | -4.2 | -4.2 |
| Physical and life sciences and technologies | -1.9Note * | -1.9Note * |
| Mathematics, computer and information sciences | -3.7 | -3.7 |
| Architecture, engineering, and related technologies | -1.5 | -1.5 |
| Agriculture, natural resources and conservation | 0.7 | 0.7 |
| Health and related fields | -4.5Note *** | -4.5Note *** |
Notes: Positive differences indicate that the average importance score of tasks is higher in jobs held by women than in jobs held by men. Negative differences indicate that the average importance score of tasks is higher in jobs held by men than in jobs held by women. Differences are adjusted for age, age squared, immigrant status and visible minority status. Regressions are run separately by field of study and task type. Sources: Statistics Canada, Census of Population, 2016; U.S. Department of Labor, O*NET, 2018; and Statistics Canada, Postsecondary Student Information System. |
||
Differences in task content of jobs held by doctoral and master’s graduates
A doctoral degree is a multi-year investment of time compared with a master’s degree, so the natural question to ask next is: Outside academia, do doctoral graduates work in different types of jobs than do master’s degree graduates, and does this vary by gender? In most fields of study, PhD graduates working outside academia worked in occupations where the importance of analytical tasks was on average higher than that of occupations in which master’s degree graduates worked (Table 5). This was true of both men and women. Fewer fields of study saw differences in mean importance scores for interpersonal tasks between jobs held by PhD and master’s degree graduates. Among male and female graduates in social and behavioural sciences and law, PhD graduates held jobs in which interpersonal tasks received higher importance scores than jobs held by master’s degree graduates. The opposite was true among male and female graduates in health and related technologies, where PhD graduates held jobs with lower importance scores for interpersonal tasks.Note Among women, but not men, small but statistically significant differences were also observed between the two degree types in science-related fields.
Among men, differences in importance scores for routine cognitive tasks were observed between PhD and master’s degree graduates in more fields than was the case among women. The direction of those differences depended on the field. Jobs held by male and female PhD graduates tended to have, in most fields, no different or lower importance scores for routine manual and non-routine manual and physical tasks.
| Non-routine cognitive, analytical | Non-routine cognitive, interpersonal | Routine cognitive | Routine manual | Non-routine manual and physical | |
|---|---|---|---|---|---|
| percent | |||||
| Men | |||||
| Education | 3.6Note ** | -1.8 | 4.0Note *** | 2.3 | 0.0 |
| Visual and performing arts, and communications technologies | -0.7 | -0.8 | 2.4 | -2.0 | -3.0 |
| Humanities | 2.1Note ** | -0.1 | 3.5Note *** | 1.6 | -0.8 |
| Social and behavioural sciences and law | 4.2Note *** | 2.3Note *** | -1.5Note *** | -4.9Note *** | -5.0Note *** |
| Business, management and public administration | 1.8 | 0.5 | -3.4Note ** | -3.2Table 5 Note † | 0.4 |
| Physical and life sciences and technologies | 2.5Note *** | 0.6 | -0.5Note * | -0.5 | -2.6Note *** |
| Mathematics, computer and information sciences | 0.8 | -1.2 | -0.8 | -4.0Note *** | -4.7Note *** |
| Architecture, engineering, and related technologies | 1.1Note *** | -0.5 | -1.3Note *** | -0.3 | -2.1Note *** |
| Agriculture, natural resources and conservation | 2.9Note ** | -0.5 | -0.6 | -0.5 | 1.8 |
| Health and related fields | 0.9Note * | -3.2Note *** | 3.8Note *** | 0.4 | 2.0Note * |
| Women | |||||
| Education | 2.2Note ** | -0.4 | 3.5Note *** | 2.6Note * | 0.0 |
| Visual and performing arts, and communications technologies | -3.3Table 5 Note † | -1.1 | 2.1 | 0.5 | -0.3 |
| Humanities | 1.8Table 5 Note † | -0.1 | 0.8 | 0.7 | -0.7 |
| Social and behavioural sciences and law | 8.0Note *** | 6.6Note *** | -2.8Note *** | -9.1Note *** | -4.1Note *** |
| Business, management and public administration | 1.8 | 1.5 | -1.1 | -0.1 | -0.4 |
| Physical and life sciences and technologies | 2.6Note *** | 1.4Note ** | -0.4 | -1.2Table 5 Note † | -1.9Note ** |
| Mathematics, computer and information sciences | 4.4Note *** | -3.3Note * | 1.4 | -4.8Note * | -5.3Note ** |
| Architecture, engineering, and related technologies | 0.6 | -2.2Note * | -1.0Table 5 Note † | -0.1 | -2.2Table 5 Note † |
| Agriculture, natural resources and conservation | 3.8Note ** | 1.5 | -1.1 | 2.3 | 7.0Note ** |
| Health and related fields | -0.9Note ** | -2.9Note *** | 6.1Note *** | -1.0 | 0.3 |
Sources: Statistics Canada, Census of Population, 2016; U.S. Department of Labor, O*NET, 2018; and Statistics Canada, Postsecondary Student Information System. |
|||||
Conclusion
With increasing numbers of students enrolling in PhD programs and a declining number of tenured positions at universities, doctoral graduates who remained in the Canadian labour market are increasingly engaged in alternative career paths. This study examined the types of occupations that graduates from Canadian doctoral programs held outside academia in 2016 and the task content associated with these jobs.
The proportion of doctoral graduates who worked as professors or lecturers at a university varied across fields of study, being the highest among graduates of business, management and public administration programs at just shy of 60% for both men and women and lowest among graduates in health and related fields, at under one-quarter. Smaller differences were observed between men and women from the same broad field of study, the largest of which being among graduates in social and behavioural sciences and law where a share of men 10 percentage point higher than that of women worked as university professors or lecturers.
Outside academia, a large proportion of doctoral graduates worked in professional occupations related to their broad field of study or professional occupations in policy research or consulting. In some fields, more women than men were found in the latter type of jobs. Apart from graduates in education and business, management and public administration, relatively small shares of doctoral graduates worked in management occupations. The share of PhD graduates who worked in jobs that typically do not require a university education was highest among individuals with degrees in visual and performing arts, communications technologies, and humanities (one in five). The gender gap in these shares was generally small except for graduates from visual and performing arts, and communications technologies, where a share of women nearly three times higher than that of men worked in jobs that did not require a university education.
Moving beyond occupation titles and specialization and looking more closely at the nature of jobs in terms of their task content, the occupations in which doctoral graduates outside academia worked were, on average, less specialized in analytical tasks compared with the job of a university professor or lecturer. Gender differences in job tasks were small compared with differences in the average task content of occupations across skill groups. In 6 out of 10 broad fields of study, differences in job task content between men and women were not statistically significant. In the remaining fields, differences in tasks varied in magnitude, direction and statistical significance. The largest gender differences were observed among graduates in social and behavioural sciences and law, mainly in terms of analytical and interpersonal tasks. Across many fields, men tended to work in jobs with somewhat higher importance of routine manual and non-routine manual and physical tasks than women.
Doctoral graduates generally worked in occupations with a higher analytical task content than did graduates with a master’s degree in the same broad field of study. They also had jobs with lower importance scores for interpersonal tasks, although such differences appeared in more fields of study among women than men.
References
Acemoglu, D., & Autor, D. (2011). Skills, tasks and technologies: Implications for employment and earnings. In Handbook of Labor Economics (Vol. 4. pp. 1043–1171). Elsevier.
Autor, D. H. (2013). “The ‘task approach’ to labor markets: an overview.” Journal for Labour Market Research, 46(3), 185–199.
Autor, D. H., & Handel, M. J. (2013). “Putting tasks to the test: Human capital, job tasks, and wages.” Journal of Labor Economics, 31 (S1), S59—S96.
no. Autor, D. H., & Restrepo, P. (2021). Tasks, Automation, and the Rise in US Wage Inequality (NBER Working Paper Series, No. 28920). National Bureau of Economic Research.
Arnold, H., & Smith, C. (2015). Students Weigh In: National Analysis of Results from the 2013 Canadian Graduate and Professional Student Survey. Higher Education Quality Council of Ontario.
Baker, J. & Vasseur, L. (2021). Women and Post-doctorates: Life after Graduation. Canadian Commission for UNESCO.
Bauffaldi, S.H., DiMaio, G., & Landoni, P. (2017). “Determinants of PhD holders’ use of social media networking sites: An analysis based on LinkedIn.” Research Policy, 46(4), 740–750.
Council of Canadian Academies. (2012). Strengthening Canada’s Research Capacity: The Gender Dimension. Council of Canadian Academies.
Concordia University. (2020). Global Impact: Concordia 2009–2019 PhD Career Outcomes. School of Graduate Studies.
Council of Canadian Academies. (2021). Degrees of Success, Ottawa (ON). The Expert Panel on the Labour Market Transition of PhD Graduates, Council of Canadian Academies.
Edge, J., & Munro, D. (2015). Inside and Outside the Academy: Valuing and Preparing PHDs for Careers. The Conference Board of Canada.
Etmanski, B., Walters, D., & Zarifa, D. (2017). “Not What I Expected: Early Career Prospects of Doctoral Graduates in Academia.” Canadian Journal of Higher Education, 47(3), 152–169.
Frank, K., Yang, Z., & Frenette, M. (2021). The changing nature of work in Canada amid recent advances in automation technology. Economic and Social Reports, 1(1). https://doi.org/10.25318/36280001202100100004-eng
Frenette, M., & Frank, K. (2017). Do Postsecondary Graduates Land High-Skill Jobs? (Analytical Studies Branch Research Paper Series, No. 388). Statistics Canada. https://www150.statcan.gc.ca/n1/pub/11f0019m/11f0019m2017388-eng.htm
Frenette, M., & Handler, T. (2020). Which Doctoral Degree Programs were Associated with the Highest Pay Prior to the COVID-19 Pandemic? A Focus on Very Detailed Fields of Study (Economic Insights, No. 122). Statistics Canada. https://www150.statcan.gc.ca/n1/pub/11-626-x/11-626-x2020020-eng.htm
Jonker, L. (2016). Ontario’s PhD Graduates from 2009: Where are they now? Higher Education Quality Council of Ontario.
Looker, E. D. (2018). 44th Statistical Report: Part 1. Canadian Association for Graduate Studies. https://cags.ca/statisticalreports/
McAlpine, L., & Austin, N. (2018). “Humanities PhD Graduates: Desperately Seeking Careers?” Canadian Journal of Higher Education, 48(2), 1–19. https://doi.org/10.7202/1057100ar
McGill University. (2021). TRaCE McGill Project. McGill Graduate and Postdoctoral Studies. http://tracemcgill.com/wp-content/uploads/2021/03/TRaCE_McGill_2103023-1.pdf
Newberry, C. (2021). 38 LinkedIn Statistics Marketers Should Know in 2021. https://blog.hootsuite.com/linkedin-statistics-business/
Porter, S., Mol, L., Locher, J., & Johnston, M. (2017). UBC PhD Career Outcomes: Graduates from 2005 to 2013 UBC Vancouver Campus. University of British Columbia Faculty of Graduates and Postdoctoral Studies.
Reithmeier, R., O’Leary, L., Zhu, X., Dales, C., Abdulkarim, A., Aquil, A., Brouillard, L., Chang, S., Miller, S., Shi, W., & Vu, N. (2019). “The 10,000 PhDs project at the University of Toronto: Using employment outcome data to inform graduate education.” PLoS One, 14(1), e0209898.
Roach, M., & Sauermann, H. (2017). “The Declining Interest in an Academic Career.” PLoS One, 12(9), e0184130.
Rose, M. (2013). Preparing for Life “Beyond Academe”: Professional Skills Development for Graduate Students in Canadian Universities.” ESC: English Studies in Canada, 39(4), 4–8.
Statistics Canada. (2014). “Fertility: Fewer Children, Older Moms.” Canadian Megatrends. https://www150.statcan.gc.ca/n1/pub/11-630-x/11-630-x2014002-eng.htm
Statistics Canada. (2020). Table 37-10-0199-01 Postsecondary graduates, by province of residence at interview, level of study, field of study and sex [Data table]. Retrieved August 22, 2022. https://doi.org/10.25318/3710019901-eng
Statistics Canada. (2021a). Table 31-10-0018-01 Postsecondary enrolments, by registration status, institution type, status of student in Canada and gender [Data table]. Retrieved August 22, 2022. Postsecondary enrolments, by registration status, institution type, status of student in Canada and gender (statcan.gc.ca)
Statistics Canada. (2021b). Table 37-10-0135-01 Postsecondary graduates, by field of study, International Standard Classification of Education, age group and gender [Data table]. Retrieved August 22, 2022. Postsecondary graduates, by field of study, International Standard Classification of Education, age group and gender (statcan.gc.ca)
Statistics Canada. (2021c). Table 37-10-0077-01 Number and median age of full-time teaching staff at Canadian universities, by highest degree earned, staff functions, rank, sex [Data table]. Retrieved August 22, 2022. Number and median age of full-time teaching staff at Canadian universities, by highest earned degree, staff functions, rank, gender (statcan.gc.ca)
TRaCE. No date (n.d.). About TRaCE. http://tracephd.com/about-trace/
University of Alberta. (2019). The University of Alberta’s PhD Alumni: Researchers, Innovators, and Leaders. Faculty of Graduate Studies and Research. https://www.ualberta.ca/graduate-studies/media-library/professional-development/phd-alumni-study/20190627-phd-alumni-study-web-final.pdf
University of British Columbia. (2021). Demographics—Age. University of British Columbia Graduate and Postdoctoral Studies. https://www.grad.ubc.ca/about-us/graduate-education-analysis-research/demographics-age
University of Toronto. No date (n.d.). 10,000 PhDs Project. University of Toronto, School of Graduate Studies. https://www.sgs.utoronto.ca/about/explore-our-data/10000-phds-project/
- Date modified: