
Economic and Social Reports
Improving the measurement of the contribution of women to the economy: Estimates of gross domestic product by gender
DOI: https://doi.org/10.25318/36280001202201000003-eng
Skip to text
Text begins
Abstract
This paper employs a novel approach for estimating gross domestic product (GDP) by gender based on administrative microfiles. GDP is the most common measure of production used for economic analysis, and it is designed to measure the value of production occurring in Canada. However, it is focused on activities outside the home and statements about differences in contributions to total production need to be interpreted with caution because measurement based on GDP will tend to overstate men’s contributions and understate women’s contributions due to differences in work done in the home. In the current literature on estimating GDP by gender, women’s and men’s contributions to GDP are allocated based on average wages. This assumes that all components of GDP (capital income, mixed income and labour income) are allocated proportionally to labour compensation. This study uses production-unit-level data to allocate the capital and mixed income components of GDP based on firm ownership, providing a more complete picture of women’s contributions to the market economy. The study finds that from 2008 to 2018, women’s contribution to Canadian GDP increased from 25.7% to 28.5%. Moreover, the paper illustrates important differences in the share of GDP attributable to men and women across industries and provinces and territories. Men’s share of GDP is highest in the construction and agriculture, forestry, fishing, hunting and trapping industries, while women’s share of GDP is highest in public sector industries (health, education, public administration).
Keywords: Gender, women employment, women entrepreneurship
Authors
Hassan Faryaar, Ryan Macdonald and Jenny Watt are with the Economic Analysis Division at Statistics Canada.
Acknowledgments
This study was funded by Women and Gender Equality Canada.
Introduction
This paper estimates and examines the contribution to Canadian gross domestic product (GDP) by men and women from 2008 to 2018. It provides information on the rising share of activity attributable to women and documents those areas of GDP where women make the largest and smallest contributions. It builds on work showing that, over the last 40 years, there have been increases in the level of women’s education and women’s participation in the market-based economy.
In Canada, increases in the educational attainment of women and their participation in the market economy are reflected in education and labour market statistics. The share of women with a university degree or certificate increased from 15% in 1991 to 35% in 2015. In comparison, it increased from 19% to 30% for men during the same period (Ferguson, 2016). The labour force participation rate of women increased from 65.2% in 1983 to 82.0% in 2015. Men’s labour force participation rate declined from 93.5% to 90.9% during the same period (Moyser, 2017).
Although studies have found that the participation of women in the labour market increased significantly in the past decades, these studies are only partially informative about changes in the share of women’s role in economic progress because they are silent about women’s contribution to the value added, i.e., the GDP, of the economy. An emerging literature (Schaffer, 2008; Woetzel et al., 2015) seeks to provide estimates of GDP by gender. However, this literature imputes gender shares of GDP based on labour compensation. The result is that the current literature does not treat capital income differently from labour compensation. Instead, it imposes an assumption that a gender’s capital income, and hence its capital ownership, is proportional to a gender’s labour income share. Moreover, the current literature starts with aggregate-level data, and so relies on average wages for analysis. Both of these will lead to mis-measured values.
In an effort to improve measurement of GDP by gender, this paper uses administrative microfiles to allocate GDP components based on gender. Measures of GDP by gender are then compiled based on the income approach to estimating GDP. Under this approach, income components of GDP—gross mixed income, labour income (wages and salaries, employer social contributions) and capital income (gross operating surplus, taxes less subsidies on production)—are assigned to a gender when possible. The gender shares of GDP are then determined by summing the different income components by gender within Canada and the provinces and territories or within industries.Note
Importantly, the income approach for estimating GDP by gender makes it possible to include women’s and men’s contributions across all firms and to include the public sector. Covering the public sector is particularly important since this is where a significant share of women’s employment is located. For example, from 2008 to 2018, an average of 38.3% of women’s full-time employment was in the public sector compared with an average of 13.4% of men’s full-time employment (Statistics Canada, 2022b). The exclusion and inclusion of these industries therefore importantly affects measurement of the relative contributions of men and women to the Canadian economy.
When Canadian GDP is measured by gender using administrative microfiles, the results show that women’s contribution to the Canadian economy generally increased from 2008 to 2018, while men’s contribution was relatively steady overall. The share of women’s contributions to GDP increased from 25.7% to 28.5%, while the share of men’s contribution increased from 48.7% to 49.2%. The unallocated proportion of GDP decreased over time from 25.6% to 22.4%. Compared with the method that uses labour compensation to allocate GDP, the income-based method used in this paper allocates relatively more GDP to men because it takes into account that men own more capital than women. Considering only the GDP that can be allocated to a gender, the income-based method allocated 63.3% of GDP to men (and 36.7% to women) in 2018. The method based only on labour remuneration would allocate 60.4% of GDP to men (and 39.6% to women) in 2018. Under the income-based method, women’s GDP contribution increased over time in all provinces and territories except Nunavut, and the increase was greater than the increase in men’s GDP contribution. Men’s GDP contributions declined in New Brunswick, Ontario and British Columbia. Among the 20 industries examined, women’s GDP contributions increased in 15 of them, whereas men’s contribution increased in 10 of them.
There are several caveats to this study and limitations for GDP as a measure of a group’s contribution to the economy. Notably, GDP does not include the production of services (outside of housing services) that households produce for their own consumption. In practical terms, this means that activities such as meals prepared at home, child care, yard work or cleaning services are not included in the production unless they are purchased on markets. In addition, since women do more unpaid work in the home than men (Milan et al., 2011; Moyser and Burlock, 2018; Gu, 2022), statements about differences in contributions to total production need to be interpreted with caution because measurement will tend to overstate men’s contributions and understate women’s contributions. Nevertheless, GDP, which is the most common measure of production used for economic analysis, is informative about the relative contributions of men and women to production outside the home. This paper therefore contributes to the emerging literature on measuring GDP by gender by developing estimates for the contribution of women and men to the Canadian economy based on administrative microfiles.
The remainder of the paper is structured as follows. Section 2 explains the methodology employed, while Section 3 describes the datasets used as inputs and Section 4 provides the results. Finally, Section 5 concludes.
Measuring the contribution of women and men to gross domestic product
Measuring the contribution of anything to the economy can be difficult because the context of the comparison greatly influences the outcome. For example, research and development may contribute a relatively small amount to GDP in the current period, but it is critical for supporting and raising living standards and for future GDP values. Similarly, child care service providers may have a smaller contribution to GDP (see Archer et al., 2021), but their support of parents’ ability to work is critical for the functioning of numerous firms and industries.
Here, the current dollar shares of GDP by gender are the metrics used for comparison. GDP is designed to provide an unduplicated measure of production that is comparable over time and across different groupings, such as industries, sectors, firm types and sizes, regions, or genders. GDP is assumed to occur within institutional units (households, firms, institutions and governments), which transform intermediate inputs, capital and labour into outputs. The output may be sold on markets (e.g., a car) or provided free of charge for use (e.g., public roads).
The typical interpretation of GDP is that it measures the size of an economy, and changes from period to period can be used to determine whether an economy is growing or contracting (Statistics Canada, 2020c). In the context of this analysis, the GDP generated by women can be used to determine the contribution of women to the economy, while changes over time can be used to determine whether that contribution is growing or diminishing. The GDP generated by women can also be compared with the GDP generated by men to analyze the relative contribution of women to the economy (outside of household own-account services production), for Canada, by industry or for the provinces and territories.
As a convention, most services generated for own consumption by households are excluded from the notion of production in the 2008 System of National Accounts (United Nations et al., 2009). This has the effect of excluding activities such as cooking, cleaning, transportation, yard work or child care that households produce for themselves. Therefore, the results of this analysis should be interpreted carefully. The numbers presented in this study are not taken to represent the total contribution of women to the production of goods and services because the value of non-marketed household services is not included in the measure. In fact, research shows that women make disproportionately high contributions to unpaid home production (Albanesi and Olivetti, 2009; Gu, 2022). For instance, Moyser and Burlock (2018) show that, on average, in 2015, women spent 3.9 hours per day on unpaid work compared with the 2.4 hours that men spent. So, although the gender-based estimates of contribution to GDP provide information about a large aspect of economic activity, it will underestimate women’s contribution to total production in Canada.
Measuring gross domestic product
There are three methods for measuring GDP: the value-added approach, the income approach and the expenditure approach (Statistics Canada, 2020c). In theory, these methods are equivalent, and in practice, the results achieved with each are highly similar; thus, it is practical to choose a method based on the data available. The value-added approach involves determining the value of output and then subtracting the value of the goods and services that were used up in the process of generating that output. The expenditure approach involves summing all final expenditures on goods and services (whether the expenditure is from households, government or other institutions). Finally, the income approach involves summing all of the incomes generated by production within institutional units (households, firms, governments) that accrue to persons or to capital.
This project uses the income approach to measuring GDP because administrative records permit detailed calculations of the various income components by gender. The administrative files are used in one of two ways, depending on whether the institutional unit’s values are derived from a T2 Corporate Tax Return or an unincorporated business declaration filed as part of a T1 Individual Tax Return. Depending on whether or not an institutional unit is incorporated, the GDP for unit in period is estimated as:
For equation (1), available measures of wages and salaries, employer social contributions, gross operating surplus, and taxes less subsidies on production are derived for large institutional units based on T2 income tax filings. These are usually larger institutional units than those that report unincorporated returns, and they include the large multinational corporations and governments in Canada.
For equation (2), the measure of gross mixed income represents the sum of wages and salaries, employer social contributions, gross operating surplus, and taxes less subsidies on production, which is reported as aggregated values in T1 tax declarations. The gross mixed income cannot be split between payments to labour and capital, and it is predominantly recorded for smaller firms that are typically self-employed individuals.
Disaggregating gross domestic product by gender
This paper assigns labour income, capital income and mixed income components to a gender at the institutional-unit level, and then aggregates the results to the industry, region or national level. Under this approach, GDP is disaggregated into three categories:
- women’s contribution to GDP
- men’s contribution to GDP
- unable to allocate
In the case of T2 incorporated units, tax filings are used to assign labour income (wages and salaries plus employer social contributions) to the gender of the individual receiving the remuneration. Additionally, when the gender of the ownership can be assigned, the sum of gross operating surplus plus subsidies less taxes on production is assigned to the share of the unit owned by a given gender. For example, if 60% of a firm is owned by women and 40% by men, the gross operating surplus is accordingly assigned 60% to women and 40% to men. In the case of T1 unincorporated firms, the value of gross mixed income can be assigned based on the shares of the owners of the firm. For organizations in the public sector, where a large portion of women receive income, capital income generally cannot be allocated. However, a large portion of the value added by the public sector occurs in the form of labour income. This income is captured using T4 data and can be reliably allocated based on the gender of the employee.
In some cases, it is not possible to assign a gender to capital income of a production unit. This occurs when there is incomplete information on ownership of an institutional unit, in particular when owners of capital cannot be identified or do not have a gender. The owners of capital, and hence institutional units, cannot be identified in cases such as governments and some large firms, such as publicly traded firms, where the owners are shareholders. While there are cases where men or women own shares directly, this ownership information is not available, and in some cases, capital ownership does not have a gender. For instance, when shares are owned by investment funds, pension funds or other corporations, assigning gender to them is impossible. As a result, a considerable share of gross operating surplus cannot be attributed to gender, and it is reported as the unallocated share of GDP. For T1 unincorporated firms, on the other hand, there is almost always complete information on gender of ownership, so the gross mixed income generated by these firms can reliably be assigned to a gender.
Data
This study uses the Canadian Employer–Employee Dynamics Database (CEEDD) from the Analytical Studies and Modelling Branch of Statistics Canada (Statistics Canada, 2020b) in combination with the Business Register (Statistics Canada, 2010, 2020a) maintained by the Data Integration Infrastructure Division of Statistics Canada. The CEEDD is a linked data environment containing tax data on tax-filing production units in Canada. It covers incorporated firms, unincorporated firms and governments. The CEEDD is not a survey, but a set of linked administrative tax files that comprise a census of active production units in Canada. It includes information on firms (revenue, payroll, profits, etc.), ownership structures and employees, as well as the reported gender of owners and employees.Note A major advantage of using the CEEDD is that it contains information on incorporated and unincorporated firms, where unincorporated firms represent self-employed individuals.
The underlying data sources for incorporated firms are their T2 corporate income tax filings, as well as the various schedules on which firms report information on salaries and wages, employer social contributions, and profits. This information can be combined to calculate the income generated from production on an annual basis.
The underlying data source for unincorporated firms is the T1 Business Declaration, where self-employed individuals report their financial surplus or deficit. This self-employment income is referred to as mixed income when measuring GDP, since it is not possible to separate payments to labour and capital for these firms. In other words, for self-employed individuals, the income they generate represents both payments for their work and returns to their entrepreneurship.
Results
This section reports GDP contributions based on income received by gender. It starts with a discussion of the gender share of the total economy and then reports on the contributions to GDP by gender in the provinces and territories and by industry.
For the total economy, men’s GDP was relatively steady from 2008 to 2018, moving from 48.7% to 49.2% (Table 1). In contrast, the share of women’s GDP increased from 25.7% in 2008 to 28.5% in 2018. The increase in the share of women’s GDP is roughly equal to the GDP from the manufacturing sector in Canada (Statistics Canada, 2020d). This illustrates that the gap between women’s and men’s contributions to GDP declined over the study period. The results also show that around 23% of GDP cannot be assigned to a gender because, at least using the current data, it is not possible to determine the gender of capital owners, or to assign capital income from government and some large firms by gender.
| 2008 | 2009 | 2010 | 2011 | 2012 | 2013 | 2014 | 2015 | 2016 | 2017 | 2018 | |
|---|---|---|---|---|---|---|---|---|---|---|---|
| percent | |||||||||||
| Men | 48.7 | 50.2 | 49.2 | 49.1 | 49.4 | 49.5 | 49.4 | 49.9 | 49.5 | 49.2 | 49.2 |
| Women | 25.7 | 27.6 | 27.6 | 27.4 | 27.7 | 27.9 | 27.5 | 28.3 | 28.9 | 28.5 | 28.5 |
| Unallocated | 25.6 | 22.3 | 23.2 | 23.5 | 22.9 | 22.6 | 23.1 | 21.8 | 21.6 | 22.3 | 22.4 |
| Sources: Statistics Canada, Canadian Employer–Employee Dynamics Database and authors’ calculations. | |||||||||||
From 2008 to 2018, women’s share increased for all components of GDP (Table 2). The changes in shares are consistent with the studies and data that find an increase in women’s participation rate relative to men. For example, from 2008 to 2018, women’s participation rate relative to men increased from 83% to 85% (Statistics Canada, 2022a).Note Growth in women’s participation in the labour market not only increases the share of their labour income, but also allows women to own more capital and increase their share of operating surplus. Although the contributions of women to GDP converge towards those of men, women still have a lower share of GDP relative to their participation in labour markets. On the labour income side, this may result from differences in pay by gender (Moyser, 2019; Pelletier et al., 2019; Morissette et al., 2013) or from differences in full-time and part-time work. Another driving factor is that men still own a greater proportion of capital than women. When only income that can be allocated is considered, 24.8% of capital income is allocated to women, whereas 39.6% of labour income is allocated to women.
| 2008 | 2009 | 2010 | 2011 | 2012 | 2013 | 2014 | 2015 | 2016 | 2017 | 2018 | |
|---|---|---|---|---|---|---|---|---|---|---|---|
| percent | |||||||||||
| Capital income share | |||||||||||
| Men | 21.8 | 23.8 | 23.7 | 24.4 | 24.1 | 25.1 | 25 | 24.1 | 25.3 | 25.2 | 24.8 |
| Women | 6.4 | 7.1 | 7.2 | 7.6 | 7.7 | 8.1 | 7.9 | 7.9 | 8.4 | 8.4 | 8.2 |
| Unallocated | 71.9 | 69.2 | 69.0 | 68.0 | 68.2 | 66.9 | 67.1 | 68 | 66.3 | 66.4 | 67.0 |
| Labour income share | |||||||||||
| Men | 62.1 | 60.8 | 61.0 | 61.2 | 61.3 | 61.3 | 61.5 | 61.2 | 60.3 | 60.5 | 60.4 |
| Women | 37.9 | 39.2 | 39.0 | 38.8 | 38.7 | 38.7 | 38.5 | 38.8 | 39.7 | 39.5 | 39.6 |
| Mixed income share | |||||||||||
| Men | 70.3 | 71.2 | 66.8 | 66.2 | 66.2 | 64.5 | 65.5 | 66.0 | 65.0 | 65.0 | 65.4 |
| Women | 29.5 | 28.8 | 33.2 | 33.8 | 33.8 | 35.5 | 34.4 | 33.9 | 35.0 | 35.0 | 34.6 |
| Sources: Statistics Canada, Canadian Employer–Employee Dynamics Database and authors’ calculations. | |||||||||||
Gross domestic product by gender in the provinces and territories
Across provinces and territories, women’s share of GDP in 2018 varies from 23.3% in Alberta to 38.3% in Yukon. Men’s share of GDP varies from 42.2% in the Northwest Territories to 55.1% in Prince Edward Island (Table 3). Men’s share of GDP tends to be higher in provinces and territories where extractive industries are more important to economic activity, such as Alberta. Women’s share of GDP tends to reflect differences in the participation of women in the labour force, as well as locations where services are more prominent and, in particular, where public sector services are more prominent. The latter occurs in the provinces and territories where education, health care and social assistance, as well as public administration, constitute a large share of GDP.
| Men | Women | Unallocated | |
|---|---|---|---|
| percent | |||
| Newfoundland and Labrador | 43.2 | 26.4 | 30.4 |
| Prince Edward Island | 55.1 | 33.4 | 11.5 |
| Nova Scotia | 50.3 | 33.7 | 15.9 |
| New Brunswick | 52.7 | 30.3 | 17 |
| Quebec | 50.8 | 28.9 | 20.3 |
| Ontario | 48.5 | 29.5 | 21.9 |
| Manitoba | 50.6 | 29.8 | 19.6 |
| Saskatchewan | 45.7 | 25.5 | 28.8 |
| Alberta | 46.1 | 23.3 | 30.6 |
| British Columbia | 52.9 | 30.5 | 16.6 |
| Yukon | 53.5 | 38.3 | 8.2 |
| Northwest Territories | 42.2 | 30.1 | 27.7 |
| Nunavut | 47.4 | 32.7 | 19.9 |
| Sources: Statistics Canada, Canadian Employer–Employee Dynamics Database and authors’ calculations. | |||
Over time, women’s GDP contribution increased in all provinces and territories except for Nunavut (Panel 1). Women’s share of GDP increased the most rapidly in the Northwest Territories (21.4% to 30.1%) and Newfoundland and Labrador (18.7% to 26.4%). The changes in men’s share of GDP tended to be smaller in magnitude, except in Saskatchewan, where the share increased from 40.8% to 45.7%, and in Nunavut, where the share decreased from 55.7% to 52.7%. The decrease in Nunavut was driven by an increase in the share of unallocated GDP, rather than an increase in the GDP contribution share for women.
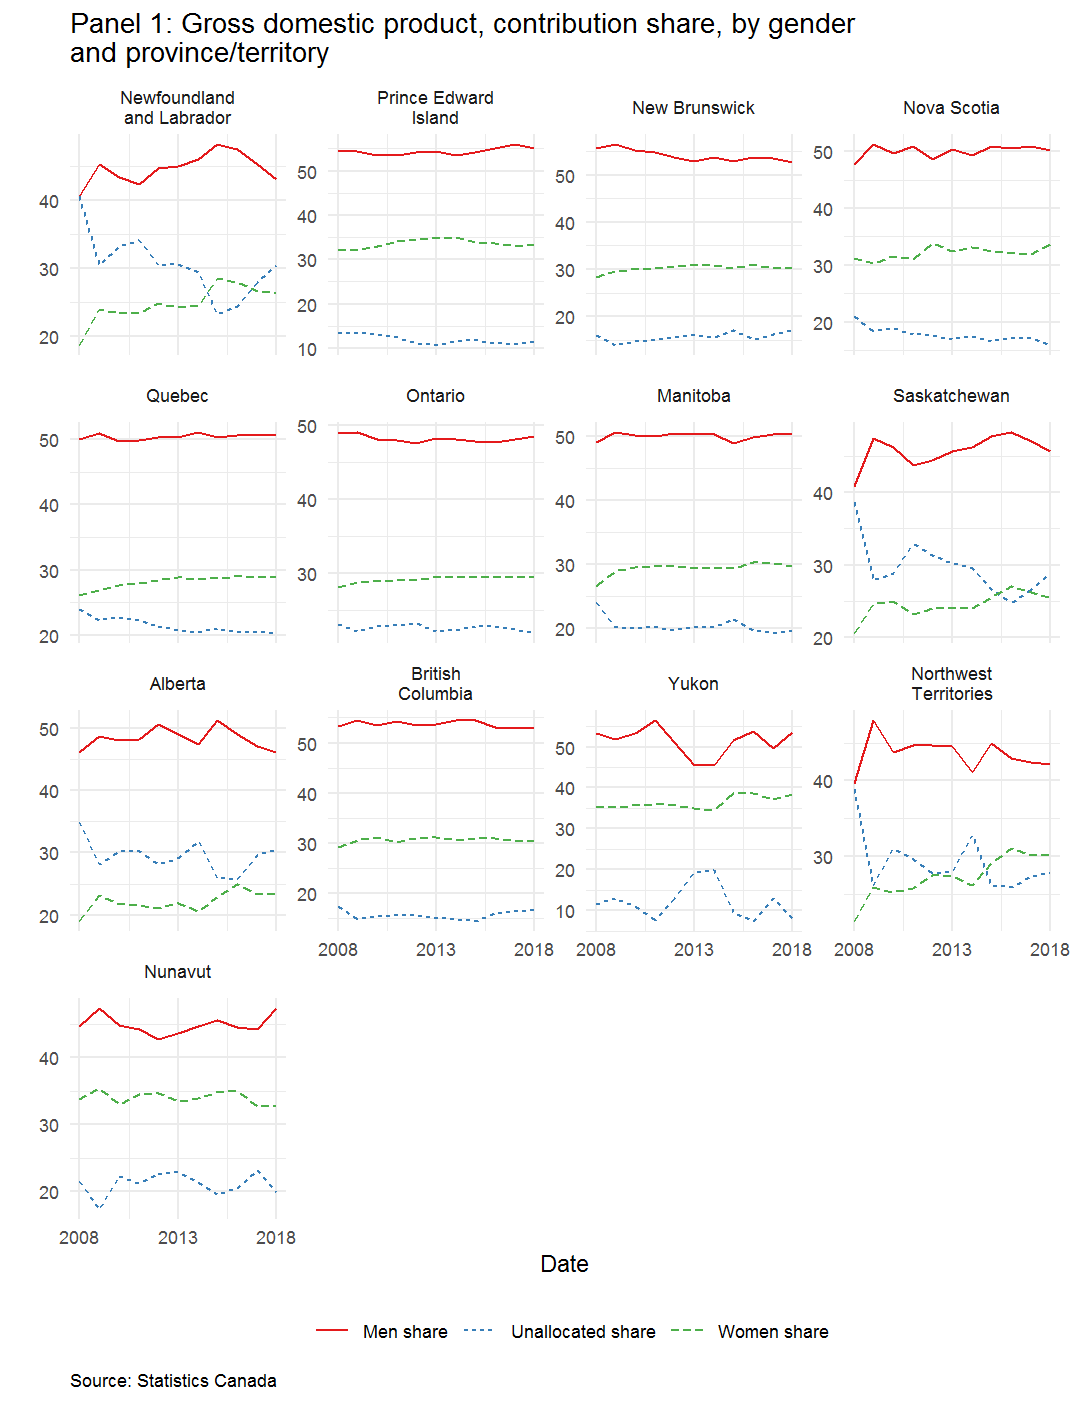
Description for Panel 1
Panel 1 shows line graphs for each province and territory, starting with Newfoundland and Labrador and ending with Nunavut. There are a total of 13 graphs. The graphs show the share of gross domestic product (GDP) from men, the share of GDP from women and the share of GDP that was unallocated for the period from 2008 to 2018. The share from men is shown as a solid red line. The share from women is shown as a dotted green line, and the unallocated share is shown as a dashed blue line. The y-axes of the graphs are independent and have the following ranges:
Newfoundland and Labrador: 15% to 55%
Prince Edward Island: 10% to 60%
Nova Scotia: 15% to 55%
New Brunswick: 15% to 60%
Quebec: 20% to 55%
Ontario: 20% to 50%
Manitoba: 15% to 55%
Saskatchewan: 20% to 50%
Alberta: 15% to 55%
British Columbia: 15% to 60%
Yukon: 5% to 55%
Northwest Territories: 10% to 55%
Nunavut: 15% to 50%
The x-axes of the graphs are years, starting with 2008 and ending with 2018.
The data are available in CSV format
Gross domestic product by gender and industry
Among the 20 industries examined, women’s GDP contribution is the highest in public sector industries (education, health care and social assistance, public administration) and in service sector industries (Chart 1). These are industries that have more women working in them and, in the case of public sector industries, can have more women than men working in them (Moyser, 2017). As a result, the pattern in the proportion of GDP attributable to women across industries reflects patterns in employment. This is not unexpected since approximately two-thirds of GDP at the national level is derived from the compensation of employees.
The pattern in the proportion of GDP attributed to women is also determined by the proportion of unallocated GDP in each industry. In the health care and social assistance sector, only a small proportion of GDP is unallocated (4.9%), and women contribute the majority of GDP (59.2%). In the public administration sector, by comparison, relatively more GDP is unallocated (22.5%), so women do not contribute the majority of GDP, even though they contribute slightly more than men (39.4% versus 38.5%). The mining, quarrying, and oil and gas extraction sector has the highest proportion of unallocated GDP (68.4%), so neither men nor women have particularly large shares. However, this is still the sector where women have the lowest share relative to men (4.6% versus 26.9%).
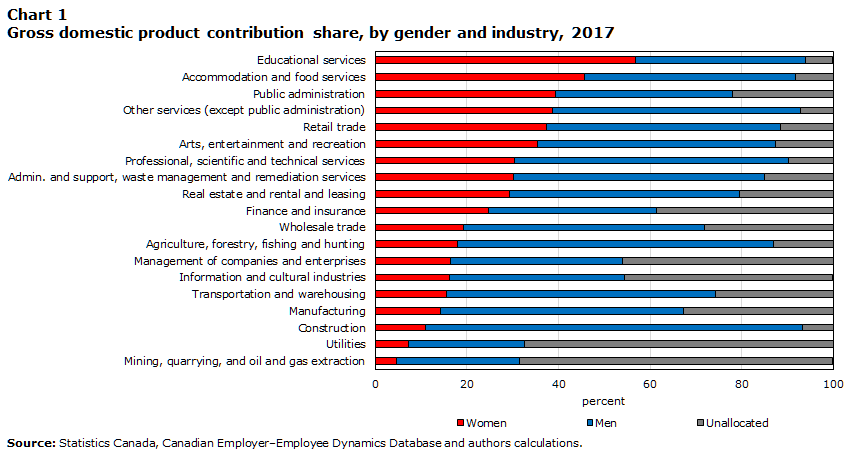
Data table for Chart 1
| Women | Men | Unallocated | |
|---|---|---|---|
| percent | |||
| Educational services | 56.9 | 37.0 | 6.0 |
| Accommodation and food services | 45.7 | 46.1 | 8.2 |
| Public administration | 39.4 | 38.5 | 22.1 |
| Other services (except public administration) | 38.6 | 54.3 | 7.1 |
| Retail trade | 37.4 | 51.0 | 11.6 |
| Arts, entertainment and recreation | 35.3 | 52.0 | 12.7 |
| Professional, scientific and technical services | 30.4 | 59.9 | 9.7 |
| Admin. and support, waste management and remediation services | 30.1 | 54.8 | 15.1 |
| Real estate and rental and leasing | 29.3 | 50.2 | 20.5 |
| Finance and insurance | 24.8 | 36.6 | 38.6 |
| Wholesale trade | 19.3 | 52.6 | 28.1 |
| Agriculture, forestry, fishing and hunting | 18.0 | 68.9 | 13.1 |
| Management of companies and enterprises | 16.4 | 37.6 | 46.0 |
| Information and cultural industries | 16.1 | 38.4 | 45.4 |
| Transportation and warehousing | 15.5 | 58.8 | 25.7 |
| Manufacturing | 14.2 | 53.1 | 32.8 |
| Construction | 11.0 | 82.2 | 6.8 |
| Utilities | 7.2 | 25.4 | 67.4 |
| Mining, quarrying, and oil and gas extraction | 4.6 | 26.9 | 68.4 |
| Sources: Statistics Canada, Canadian Employer–Employee Dynamics Database and authors calculations. | |||
Over the study period, women’s contribution to GDP increased in 15 industries and declined in the other 5 (Panel 2). Women’s contribution to GDP grew the most in health care and social assistance (51.2% to 59.2%); educational services (51.4% to 56.9%); and arts, entertainment and recreation (30.8% to 35.3%). In the industries where women’s contribution to GDP decreased, the share changed by less than one percentage point, except for in the administrative and support, and waste management and remediation services sector (32.0% to 30.1%). Conversely, in industries where men’s contribution decreased, the change was larger than one percentage point in six industries. The three sectors with the largest decreases were management of companies and enterprises (44.4% to 37.6%), health care and social assistance (42.4% to 36.0%), and public administration (43.7% to 38.5%).
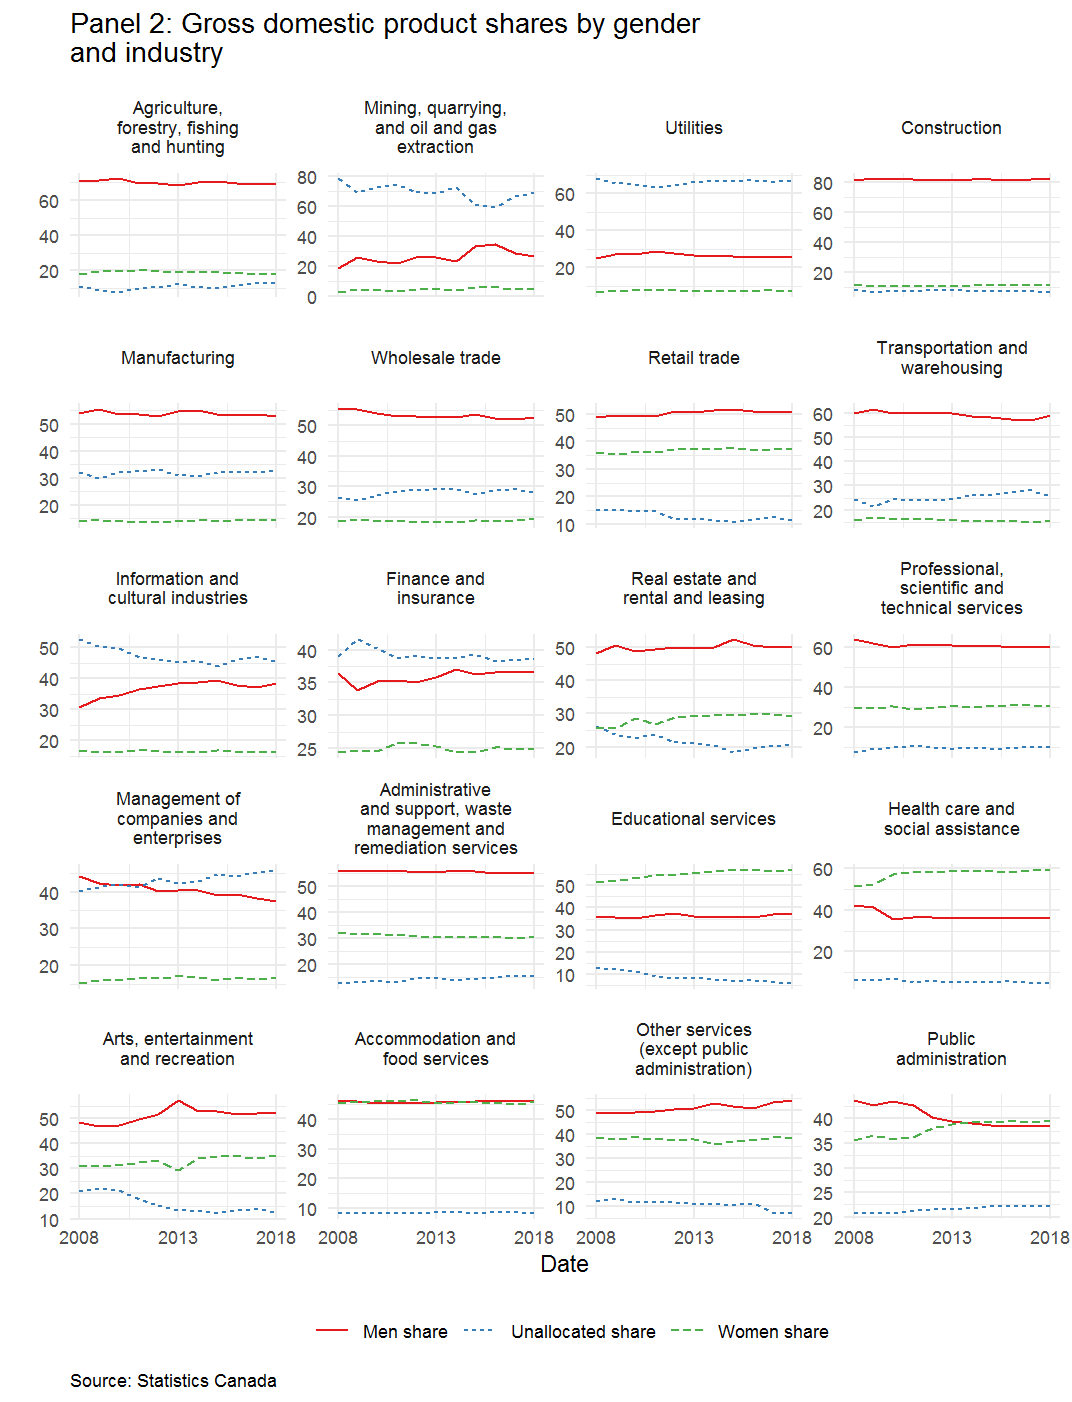
Description for Panel 2
Panel 2 shows line graphs for North American Industry Classification System (NAICS) industries, starting with agriculture, forestry, fishing and hunting, and ending with public administration. There are a total of 20 graphs. The graphs show the share of gross domestic product (GDP) from men, the share of GDP from women and the share of GDP that was unallocated for the period from 2008 to 2018. The share from men is shown as a solid red line. The share from women is shown as a dotted green line, and the unallocated share is shown as a dashed blue line. The y-axes of the graphs are independent and have the following ranges:
Agriculture, forestry, fishing and hunting: 10% to 70%
Mining, quarrying, and oil and gas extraction: 0% to 80%
Utilities: 10% to 70%
Construction: 10% to 85%
Manufacturing: 10% to 55%
Wholesale trade: 15% to 60%
Retail trade: 10% to 55%
Transportation and warehousing: 10% to 70%
Information and cultural industries: 10% to 60%
Finance and insurance: 20% to 55%
Real estate and rental and leasing: 15% to 55%
Professional, scientific and technical services: 5% to 65%
Management of companies and enterprises: 15% to 50%
Administrative and support, waste management and remediation services: 10% to 55%
Educational services: 10% to 60%
Health care and social assistance: 5% to 60%
Arts, entertainment and recreation: 10% to 60%
Accommodation and food services: 5% to 60%
Other services (except public administration): 5% to 55%
Public administration: 20% to 50%
The x-axes of the graphs are years, starting with 2008 and ending with 2018.
The data are available in CSV format.
Conclusion
Recent improvements in administrative data files permit the calculation of the income received within a firm by gender, as well as an examination of the contributions of men and women to GDP. In particular, new administrative data files enable researchers to determine both labour and capital income of a gender. Capital income, at the aggregate level, makes up more than 35% of Canadian GDP. The current literature on GDP by gender relies on gender shares of labour income when partitioning GDP between genders and must assume that capital income, i.e., gross operating surplus, is proportional to labour remuneration. Capital ownership and labour remuneration are not necessarily equated, and women’s share of capital income is different from men’s. This paper therefore contributes to emerging literature on GDP by gender, assigning gender to both labour income and capital income when possible.
The results show that women’s contribution to Canadian GDP increased from 25.7% to 28.5%, while men’s contribution to GDP increased from 48.7% to 49.2% (while the percentage of unallocated GDP decreased). The findings indicate that the gap between women’s and men’s contributions to GDP declined over the study period. This result is consistent with the studies that found an increase in women’s participation in the labour market over time in Canada (Moyser, 2017). However, the changes in GDP shares do not completely align with changes in labour market activity. This may be because of gender wage differences, differences in full-time and part-time employment patterns, or the share of gross operating surplus that could not be assigned. The study reports that around 23% of GDP cannot be assigned to gender because of incomplete information or because it comes from large firms and public sector entities where a gender of ownership cannot be determined.
Finally, this paper highlights challenges for allocating GDP components by gender. The paper argues that using data on firm ownership allows for a more complete picture of women’s contribution to the economy, since it does not assume that capital income is allocated proportionally to labour income. However, the paper also makes clear that it is not immediately obvious how some components of capital income should be allocated. This is particularly the case for large multinational corporations and governments, both of which play significant roles in the economy. Without a method for determining a full allocation, it is difficult to move to gender-based examinations of other measures of economic progress, such as productivity growth or investment.
References
Archer, J., Duhamel, D., Macdonald, R., Watt, J., & Yam, H.N. (2021). The early learning and child care industry in Canada: Business characteristics and industry gross domestic product. Economic and Social Reports, 1(8).
Albanesi, S., & Olivetti, C. (2009). Home production, market production and the gender wage gap: Incentives and expectations. Review of Economic Dynamics, 12(1), 80-107.
Ferguson, S. J. (2016). Women and Education: Qualifications, Skills and Technology (Women in Canada: A Gender-Based Statistical Report). Statistics Canada.
Gu, W. (2022). The value of unpaid childcare and paid employment by gender: What are the impacts of the low-fee universal childcare program? Economic and Social Reports, 2(7).
Milan, A. M., Keown, L. A., & Uruijo, C. R. (2011). Families, Living Arrangements and Unpaid Work (Women in Canada: A Gender-Based Statistical Report). Statistics Canada.
Morissette, R., Garnett P., & Lu, Y. (2013). The Evolution of Canadian Wages over the Last Three Decades(Analytical Studies Branch Research Paper Series, No. 347). Statistics Canada.
Moyser, M. (2017). Women and Paid Work (Women in Canada: A Gender-Based Statistical Report). Statistics Canada.
Moyser, M. (2019). Measuring and Analyzing the Gender Pay Gap: A Conceptual and Methodological Overview (Studies on Gender and Intersecting Identities). Statistics Canada.
Moyser, M., & Burlock, A. (2018). Time use: Total work burden, unpaid work, and leisure (Women in Canada: A Gender-Based Statistical Report). Statistics Canada Catalogue Number 89-503-X.
Pelletier, R., & Patterson, M., & Moyser, M. (2019). The gender wage gap in Canada: 1998 to 2018 (Labour Statistics: Research Papers).
Risman, B. (2004). Gender as a social structure: theory wrestling with activism. Gender and Society, 18(4): 429-450.
Schaffer, A. (2008). Women's and Men's Contributions to Satisfying Consumers' Needs: A Combined Time Use and Input–Output Analysis. Interdisciplinary Information Sciences, 14(1): 61-88.
Statistics Canada. (2010). A brief guide to the Business Register.
Statistics Canada. (2020a). Business Register (BR).
Statistics Canada. (2020b). Canadian Employer-Employee Dynamics Database.
Statistics Canada. (2020c). Gross Domestic Product.
Statistics Canada. (2020d). Gross domestic product (GDP) at basic prices, by industry, annual average (x 1,000,000) [Data table].
Statistics Canada. (2021). Supply and use tables, summary level, provincial and territorial (x 1,000,000) [Data table].
Statistics Canada. (2022a). Table 14-10-0020-01 Unemployment rate, participation rate and employment rate by educational attainment, annual [Data table].
Statistics Canada. (2022b). Table 14-10-0023-01 Labour force characteristics by industry, annual (x 1,000) [Data table].
United Nations, European Commission, International Monetary Fund, Organisation for Economic Co-operation and Development, and World Bank. (2009). System of National Accounts, 2008. United Nations.
Woetzel, J., Madgavkar, A., Ellingrud, K., Labaye, E., Devillard, S., Kutcher, E., Manyika, J., Dobbs, R., & Krishnan, M. (2015). The power of parity: how advancing women’s equality can add $12 trillion to global growth. McKinsey Global Institute.
- Date modified: