
Correction notice
A correction has been made to this product. In Table 6, the unit of measure was updated from “millions of dollars” to “dollars.” We regret any inconvenience this may have caused.
DOI: https://doi.org/10.25318/36280001202100800006-eng
Skip to text
Text begins
Abstract
This paper examines child care in Canada, and in the provinces and territories, which is provided by firms through markets, as well as early learning services that are funded by governments through junior kindergarten and kindergarten. The latter can serve as substitutes for child care provided by firms and needs to be included to facilitate interprovincial and interterritorial comparisons. The paper uses administrative datasets to identify firms that provide child care services in Canada. The child care firms are then used as a basis to examine the revenue and gross domestic product of the child care industry based on the type of firm (incorporated versus unincorporated) generating the income. Business dynamics measures for entry, exit and survival, as well as firm characteristics, such as the mixture of small and large firms, the geographic distribution of firms, and the gender structure of ownership, are also examined.
Keywords: business dynamics, child care, early learning, gross domestic product
Authors
Jeff Archer is with the Producers Prices Division, Economy-wide Statistics, Statistics Canada. Bradley Duhamel and Hong Nei (Connie) Yam are with the Public Sector Statistics Division, Statistics Canada. Jenny Watt is with the Centre for Population Health Data, Statistics Canada. Ryan Macdonald is with the Economic Analysis Division, Statistics Canada.
Introduction
Child care supports labour force attachment for parents, particularly mothers, and represents a critical service for two-income families and single-earner families with children. If the child care is of high quality, it can support language learning, early learning and the social development of children before they enter the school system. However, there has been little consistent, comparable information on the economic values and firm characteristics of the early learning and child care industry across the provinces and territories.
To address the lack of comparable information, Archer et al. have developed methods for using Statistics Canada data holdings to report on the business and economic characteristics of child care businesses in Canada. The study focuses on child care businesses for children aged 5 and younger, as well as early learning in junior kindergarten and kindergarten for the period from 2008 to 2016. Children aged 5 and younger are used in the definition here, as these are the ages after which primary education begins, and because this supports international comparability of estimates.Note 1 The novel contribution of Archer et al. is to provide business values (revenue, payroll, profit and gross domestic product [GDP]), firm dynamics measures (entry, exit and survival) and firm characteristics (e.g., incorporation status, size, age and location) for the child care industry.
The results show that the child care industry is composed predominantly of small, unincorporated, women-owned firms. The study identifies approximately 100,000 child care firms per year. Of these, small firms constitute over 99% of all identified firms and are typically unincorporated, with an average annual income of around $22,000 and a mode of around $8,000. The small firms correspond to the small home daycares found throughout Canada. Alongside the large number of small firms are a small number of large firms that offer child care at multiple locations and/or in multiple provinces. These firms, of which there are typically around 100 to 120, are incorporated entities that can have revenues in excess of $1 million per year excluding subsidies.
GDP is the standard measure of production used when examining industry size and growth. The GDP of child care firms and child care in the education system was $15.1 billion in 2016.Note 2 Of this, about one-third of the GDP ($4.9 billion) comes from child care businesses, another third ($5.6 billion) comes from junior kindergarten and kindergarten (an imputation for child care in the education system), and the final third comes from government expenditures and subsidies on early learning and child care. Although the imputation for junior kindergarten and kindergarten uses a basic model, it size speaks to the important role of the school system as a source of early learning for 4- and 5-year-olds. It also illustrates the importance of including early learning that is provided by the school system and that may partially replace the need for child care when making comparisons across provinces and territories, as the structure of publicly funded early childhood education varies across the country. In terms of GDP, it is not possible to compare early learning and child care structures without taking the school system into account.
Within businesses, daycare firms are differentiated based on their tax filing structures, and this affects the type of information that is available. Unincorporated firms file T1 tax declarations, and the T1 business declarations are used as the source of information on revenue and income. Incorporated firms file T2 corporate income tax declarations, and the associated T2 schedules are used to calculate revenue and income. Between the two groups, unincorporated firms tend to be smaller and are likely to correspond to unregulated home daycares. Incorporated firms tend to be larger and have employees, and they are likely to be regulated. In terms of GDP, unincorporated firms generated $1.1 billion in 2016. This is a little less than one-third of the $3.8 billion in GDP created by incorporated firms, excluding subsidies.
The results also show that the child care market has a high degree of turnover. Entry rates for small firms range between 18% and 33% depending on the year, and exit rates range between 16% and 26%. Entry and exit is predominantly a small-firm phenomenon, and these small child care firms tend to be short-lived. For the cohorts of entrants between 2008/2009 and 2012/2013, approximately two-thirds of firms exited the market within three years. This means that the average child care firm for that cohort was active for less than three years. Based on the cohorts from 2008/2009 to 2014/2015, firm survival rates are decreasing over time, meaning that entrants remain active for fewer years on average than they used to.
The next section of this paper describes the data sources and how early learning and child care are measured for this report. The penultimate section presents the results and is followed by a final section that summarizes and provides some discussion of the strengths and weaknesses of the data.
Methodology
The values reported here are tabulated based on the methodology of Archer et al. A summary of the methodology is provided here.
To produce business values, measures of firm dynamics and measures of firm characteristics, Statistics Canada’s Business Register (BR) is used to identify child care businesses and child care locations across Canada based on firms or locations being categorized into the child day-care services industry under the North American Industry Classification System code 624410 (Statistics Canada 2010; Statistics Canada 2020a; Statistics Canada 2010b). For the identified businesses, values are then attached to the child care business (or the location within a business) based on T2 corporate income tax returns and T1 business declarations.
The base dataset from the BR and administrative files is augmented with two sets of imputations to promote interprovincial and interterritorial comparisons of child care.Note 3 The imputation models and their outputs are reported separately to distinguish between information from reported sources and information derived from imputation models.
The first set of imputations is for child care locations in businesses whose main activity is not child care. These represent daycares that are part of a larger organization, such as an office that has an on-site daycare provided by the employer. In these cases, it is not possible to determine financial variables such as revenue, employment and profit for the daycare location; this is because values reported on tax forms for the firm will reflect all of its business activities rather than only those from daycare service provision.
For these locations, an imputation model based on the average values from daycare businesses in the same province or territory is used.
The second set of imputations is for pre-kindergarten and kindergarten. This study aims to focus on spending on child care and child care in education for children aged 5 and younger. In Canada, this includes kindergarten programs. Additionally, some provinces provide junior kindergarten through the public school system, which is not available in other provinces and territories. These programs can be part-time or full-time, and this can change over time within a province or territory. In Canada, a set of nationally comparable values based on junior kindergarten and kindergarten does not exist. As a result, to make comparisons between Canadian jurisdictions, and to make international comparisons, it is necessary to make an imputation for the value of pre-kindergarten and kindergarten.
Results
Results are provided in three sections. In the first section, business characteristics are reported. In the second section, estimates for GDP and revenue are reported, while the third section contains business dynamics measures.
Business characteristics
The child care industry has incorporated and unincorporated businesses, non-profit institutions serving households, and government participation, as well as informal child care arrangements within households. The results below focus on business activity (incorporated and unincorporated businesses) and certain forms of government participation via kindergarten and pre-kindergarten schooling, as well as government expenses on early learning and child care. Non-profit institutions serving households, which include charities and religious institutions, both of which provide child care in Canada, are excluded unless their daycares are incorporated as subsidiary businesses. As a result, the data presented in this study may be imperfect, but they still provide the most comprehensive portrait of the Canadian child care industry to date. They should be interpreted as providing information about the business sector activity of daycare businesses that participate in competitive markets, the support that governments offer for these activities (which is measured with some imprecision), and the related early learning activities provided by provincial and territorial school systems.
| 2008 | 2009 | 2010 | 2011 | 2012 | 2013 | 2014 | 2015 | 2016 | |
|---|---|---|---|---|---|---|---|---|---|
| unit counts | |||||||||
| Enterprises | |||||||||
| Simple | 84,791 | 93,326 | 102,766 | 109,642 | 111,023 | 111,692 | 111,595 | 109,578 | 104,696 |
| Complex child care | 120 | 115 | 114 | 114 | 114 | 113 | 108 | 109 | 104 |
| Complex non-child care with child care locations | 39 | 39 | 21 | 16 | 22 | 25 | 22 | 24 | 23 |
| Total | 84,950 | 93,480 | 102,901 | 109,772 | 111,159 | 111,830 | 111,725 | 109,711 | 104,823 |
| Locations | |||||||||
| Simple | 84,791 | 93,326 | 102,766 | 109,642 | 111,023 | 111,692 | 111,595 | 109,578 | 104,696 |
| Complex child care | 306 | 296 | 297 | 417 | 322 | 323 | 306 | 302 | 294 |
| Complex non-child care with child care locations | 273 | 275 | 259 | 252 | 233 | 238 | 219 | 224 | 207 |
| Total | 85,370 | 93,897 | 103,321 | 110,307 | 111,571 | 112,246 | 112,110 | 110,088 | 105,165 |
| Source: Statistics Canada, authors' calculations. | |||||||||
Within the business sector portion of the child care industry, the majority of firms are small and simple (Table 1). These constitute over 99% of identified child care firms in every year from 2008 to 2016. For complex firms that provide child care, the majority of child care firms (75% to 81%, depending on the year) are enterprises where the main business activity is child care. The other 19% to 25% of enterprises identified as having child care locations are those whose main business activity is not child care. A small number of complex child care firms are identified, and their locations make up 0.5% of locations.
| 2008 | 2009 | 2010 | 2011 | 2012 | 2013 | 2014 | 2015 | 2016 | |
|---|---|---|---|---|---|---|---|---|---|
| unit counts | |||||||||
| Enterprises | |||||||||
| Incorporated | 7,094 | 7,080 | 7,292 | 7,433 | 7,886 | 8,510 | 8,756 | 8,888 | 9,125 |
| Unincorporated | 77,856 | 86,400 | 95,609 | 102,339 | 103,273 | 103,320 | 102,969 | 100,823 | 95,698 |
| Total | 84,950 | 93,480 | 102,901 | 109,772 | 111,159 | 111,830 | 111,725 | 109,711 | 104,823 |
| Locations | |||||||||
| Incorporated | 7,514 | 7,497 | 7,714 | 7,976 | 8,312 | 8,940 | 9,160 | 9,297 | 9,531 |
| Unincorporated | 77,856 | 86,400 | 95,609 | 102,339 | 103,273 | 103,320 | 102,969 | 100,823 | 95,698 |
| Total | 85,370 | 93,897 | 103,323 | 110,315 | 111,585 | 112,260 | 112,129 | 110,120 | 105,229 |
| Source: Statistics Canada, authors' calculations. | |||||||||
The majority of business sector child care locations (about 90%) are of unincorporated businesses (Table 2). These businesses tend to be owned by entrepreneurs who run localized businesses that are smaller in scale than incorporated businesses, and they are less likely to have employees beyond the entrepreneur themselves. In the context of discussions about the types of child care providers that are active in Canada, these firms tend to be home daycares that may or may not be licensed. Around 10% of child care locations are of incorporated businesses. The majority of incorporated businesses have a single location, and the average number of locations per enterprise is 1.05.
By far, the majority of child care firms are women-owned and unincorporated with a single owner and no employees (Table 3). Gender information for unincorporated firms is determined by linking administrative records, but this information is occasionally missing. For incorporated firms, gender information may be missing, or the firm may have a diverse ownership structure that does not allow individual owners to be identified; for example, the firm may be publicly traded or foreign-owned. Nevertheless, gender is identified for the majority of firms (about 94% in 2016).
| 2008 | 2009 | 2010 | 2011 | 2012 | 2013 | 2014 | 2015 | 2016 | |
|---|---|---|---|---|---|---|---|---|---|
| number of businesses | |||||||||
| Total | 84,950 | 93,480 | 102,901 | 109,772 | 111,159 | 111,830 | 111,725 | 109,711 | 104,823 |
| Gender | |||||||||
| Women-owned | 73,823 | 80,965 | 89,038 | 95,165 | 96,098 | 96,505 | 96,407 | 94,542 | 90,065 |
| Men-owned | 4,200 | 5,510 | 6,647 | 7,168 | 7,429 | 7,380 | 7,304 | 7,167 | 6,665 |
| Equal ownership | 1,607 | 1,790 | 1,864 | 2,054 | 2,060 | 2,191 | 2,164 | 2,196 | 2,101 |
| Unable to assign | 5,320 | 5,215 | 5,352 | 5,385 | 5,572 | 5,754 | 5,850 | 5,806 | 5,992 |
| Legal status | |||||||||
| Incorporated | 7,094 | 7,080 | 7,293 | 7,437 | 7,893 | 8,517 | 8,765 | 8,904 | 9,157 |
| Unincorporated | 77,856 | 86,400 | 95,608 | 102,335 | 103,266 | 103,313 | 102,960 | 100,807 | 95,666 |
| Size (employment) | |||||||||
| 0/Undetermined | 75,638 | 83,956 | 92,811 | 99,431 | 100,593 | 101,801 | 101,589 | 99,605 | 94,651 |
| 1 to 5 | 4,687 | 4,838 | 5,309 | 5,435 | 5,559 | 4,664 | 4,578 | 4,411 | 4,288 |
| 6 to 20 | 3,016 | 3,026 | 3,059 | 3,143 | 3,212 | 3,509 | 3,691 | 3,761 | 3,884 |
| More than 20 | 1,609 | 1,660 | 1,722 | 1,763 | 1,795 | 1,856 | 1,867 | 1,934 | 2,000 |
| Labour compositionTable 3 Note 1 | |||||||||
| 0% to 25% women | 3,581 | 4,825 | 5,984 | 6,768 | 6,747 | 6,552 | 6,527 | 6,397 | 5,786 |
| 26% to 50% women | 1,172 | 1,271 | 1,372 | 1,524 | 1,535 | 1,585 | 1,549 | 1,541 | 1,431 |
| 51% to 75% women | 216 | 242 | 232 | 214 | 202 | 245 | 264 | 235 | 232 |
| 76% to 100% women | 76,499 | 83,618 | 91,333 | 97,057 | 97,896 | 99,537 | 99,572 | 97,885 | 93,610 |
| GeographyTable 3 Note 2 | |||||||||
| Newfoundland and Labrador | 662 | 755 | 796 | 846 | 888 | 916 | 950 | 970 | 960 |
| Prince Edward Island | 363 | 372 | 373 | 375 | 347 | 340 | 355 | 349 | 348 |
| Nova Scotia | 1,496 | 1,603 | 1,696 | 1,813 | 1,776 | 1,756 | 1,720 | 1,704 | 1,697 |
| New Brunswick | 1,548 | 1,638 | 1,695 | 1,774 | 1,740 | 1,811 | 1,824 | 1,776 | 1,694 |
| Quebec | 24,857 | 26,971 | 29,957 | 32,721 | 34,988 | 36,281 | 36,409 | 36,038 | 35,202 |
| Ontario | 32,762 | 37,380 | 41,558 | 43,810 | 43,155 | 42,532 | 41,762 | 39,961 | 36,396 |
| Manitoba | 2,380 | 2,397 | 2,513 | 2,569 | 2,617 | 2,652 | 2,671 | 2,657 | 2,651 |
| Saskatchewan | 2,652 | 2,820 | 3,085 | 3,197 | 3,221 | 3,273 | 3,267 | 3,228 | 3,308 |
| Alberta | 8,412 | 9,072 | 10,013 | 10,604 | 10,685 | 10,885 | 11,424 | 11,794 | 11,798 |
| British Columbia | 9,634 | 10,287 | 11,014 | 11,865 | 11,555 | 11,188 | 11,147 | 11,029 | 10,576 |
| Yukon | 63 | 67 | 63 | 68 | 61 | 65 | 60 | 67 | 66 |
| Northwest Territories | 88 | 82 | 101 | 89 | 87 | 92 | 92 | 97 | 85 |
| Nunavut | 29 | 31 | 32 | 35 | 35 | 35 | 40 | 37 | 40 |
|
|||||||||
Most child care firms have zero employees. If a firm does have employees, it is most likely to have one to five employees, and only a small portion of firms have more than 20 employees. To calculate labour composition of a firm by gender, if there are no employees, it is assumed that the owner or owners supply all of the labour for the firm, and the gender of the owners is used to calculate this statistic. Women make up over 75% of employees in the majority of firms (about 90% in 2016).
Generally, the number of child care firms in each province is proportional to the population in that province. An exception is Quebec, which has a proportionally larger number of child care firms. This is consistent with higher child care funding in the province (Sinha 2014). The number of firms in Nunavut is proportionally low, with the territory having noticeably fewer firms than Yukon, despite similar population counts over the 2009-2016 period.
Gross domestic product and revenue
Gross domestic product
GDP measures the value added created by production activities within an economy. It can be measured in three ways.Note 4 For the child care industry, an income approach to measuring GDP is used for business sector child care businesses, in conjunction with final expenditures by governments and a set of imputations where direct measurement is not feasible.Note 5
To measure income-based GDP from administrative files, a different approach is needed for incorporated and unincorporated businesses. For incorporated businesses, compensation of employees and gross operating surplus represent remuneration to labour and capital from production, respectively. These values can be measured separately from T2 tax filings and are reported separately in Table 4. For unincorporated businesses, the T1 business declaration does not distinguish between the labour remuneration of the entrepreneur and the payment to their capital. In this case, the combined value of operating surplus and compensation of employees is referred to as mixed income and is reported as a separate entry in Table 4.
Together, these values constitute a measure of GDP at factor cost. When subsidies without taxes are included, the standard measure of GDP at basic prices is calculated. Investigation of tax files did not return employable measures of subsidies or taxes on production from child care firms. Consequently, the early learning and child care expenditures from government ledger files are used to provide an indication of the level of public sector support for private provision of child care spaces, and taxes on production are assumed to be zero. This approach makes it difficult to assign subsidy values to specific firms, so the government support is reported as a separate line item that, when included, allows GDP to be calculated at basic prices.
From 2009 to 2016, all components of GDP for early learning and child care businesses increased (Table 4). The largest increase came from the imputation for provincially and territorially provided services for junior kindergarten and kindergarten, which increased 11.7% per year to reach $5.56 billion in 2016. This period corresponded to a number of changes in provincial and territorial school programs, including the implementation of full day junior and senior kindergarten in Ontario.
Business sector GDP at factor cost increased by 53.4% from 2009 to 2016. Compensation of employees in incorporated firms increased by 53.0% (or 6.3% per annum) to reach $3.54 billion in 2016. Mixed income, which corresponds to income declared for daycare businesses in unincorporated firms (most likely small home daycares), increased by 47.2% (or 5.7% per annum) to reach $1.12 billion in 2016. Gross operating surplus (excluding subsidies) rose over the sample period to reach $242 million.
| 2008 | 2009 | 2010 | 2011 | 2012 | 2013 | 2014 | 2015 | 2016 | |
|---|---|---|---|---|---|---|---|---|---|
| millions of dollars | |||||||||
| Corporate (T2) compensation of employees | 2,183 | 2,312 | 2,416 | 2,561 | 2,704 | 2,938 | 3,104 | 3,304 | 3,537 |
| Corporate (T2) gross operating surplus | 155 | 121 | 127 | 134 | 94 | 140 | 129 | 138 | 242 |
| Unincorporated (T1) mixed income | 651 | 760 | 855 | 1,035 | 1,062 | 1,109 | 1,143 | 1,131 | 1,119 |
| GDP at factor cost | 2,989 | 3,193 | 3,398 | 3,730 | 3,860 | 4,187 | 4,376 | 4,573 | 4,898 |
| Plus: Government ELCC expenses, including transfers and subsidies to business and charities | Note ...: not applicable | 3,432 | 3,771 | 4,305 | 4,791 | 5,369 | 5,218 | 4,694 | 4,525 |
| Subtotal for directly measured GDP at basic prices | Note ...: not applicable | 6,625 | 7,169 | 8,035 | 8,651 | 9,556 | 9,594 | 9,267 | 9,423 |
| Plus: Imputation for non-child care enterprises with child care locations | 102 | 107 | 100 | 71 | 86 | 97 | 95 | 114 | 107 |
| Plus: Imputation for kindergarten and pre-kindergarten | 2,365 | 2,554 | 3,096 | 3,787 | 4,309 | 4,806 | 5,253 | 5,373 | 5,556 |
| ELCC GDP at basic prices | Note ...: not applicable | 9,286 | 10,365 | 11,893 | 13,046 | 14,459 | 14,942 | 14,754 | 15,086 |
|
... not applicable Notes: GDP: gross domestic product; ELCC: early learning and child care. Source: Statistics Canada, authors' calculations. |
|||||||||
Government expenditures on early learning and child care increased by 31.8% from 2009 to 2016 to reach $4.53 billion. This represented slightly faster growth than GDP in the business sector over this period. However, caution needs to be used, as government GDP includes subsidies to private businesses that should be measured as part of business sector GDP, leading to an imprecision in comparisons between the two sectors.
Across the provinces and territories, the largest expenditures are in Quebec and Ontario, while the smallest expenditures are in the territories (Table 5). This pattern generally reflects the population distribution, as well as some differences in the structure of child care provision, such as daycare programs in Quebec and junior kindergarten programs in certain provinces. From 2009 to 2016, the largest growth in early learning and child care GDP occurred in Prince Edward Island (13.0% per annum), while Nova Scotia had a growth rate of 11.8% per annum, and Newfoundland and Labrador had a growth rate of 10.0% per annum. Ontario and British Columbia both had a growth rate of 9.3% per annum. Manitoba (7.4%), Saskatchewan (6.9%), Alberta (7.1%) and the Northwest Territories (6.7%) were in the middle of the range of provincial and territorial growth rates. Quebec (4.8%), New Brunswick (4.3%), Nunavut (4.1%) and Yukon (4.0%) had the lowest growth rates.
| 2008 | 2009 | 2010 | 2011 | 2012 | 2013 | 2014 | 2015 | 2016 | |
|---|---|---|---|---|---|---|---|---|---|
| millions of dollars | |||||||||
| Canada | Note ...: not applicable | 9,283.1 | 10,362.0 | 11,890.5 | 13,042.5 | 14,458.8 | 14,941.3 | 14,750.7 | 15,083.5 |
| Newfoundland and Labrador | Note ...: not applicable | 51.7 | 56.7 | 62.6 | 69.1 | 96.6 | 102.1 | 105.0 | 100.6 |
| Prince Edward Island | Note ...: not applicable | 18.2 | 27.2 | 34.4 | 33.8 | 36.0 | 37.6 | 39.6 | 42.7 |
| Nova Scotia | Note ...: not applicable | 92.0 | 99.0 | 144.9 | 167.4 | 177.1 | 185.2 | 191.2 | 201.1 |
| New Brunswick | Note ...: not applicable | 126.3 | 131.0 | 135.0 | 143.8 | 153.0 | 158.3 | 158.0 | 169.0 |
| Quebec | Note ...: not applicable | 4,111.9 | 4,433.4 | 4,882.1 | 5,053.6 | 5,372.1 | 5,559.5 | 5,644.6 | 5,712.0 |
| Ontario | Note ...: not applicable | 3,270.9 | 3,790.5 | 4,465.7 | 5,261.7 | 6,136.6 | 6,323.3 | 5,966.6 | 6,114.3 |
| Manitoba | Note ...: not applicable | 267.7 | 273.6 | 357.2 | 380.4 | 377.4 | 391.0 | 412.3 | 442.6 |
| Saskatchewan | Note ...: not applicable | 180.2 | 193.1 | 214.7 | 236.1 | 249.8 | 262.5 | 268.6 | 287.2 |
| Alberta | Note ...: not applicable | 537.0 | 573.6 | 638.5 | 701.9 | 826.5 | 887.3 | 876.6 | 866.2 |
| British Columbia | Note ...: not applicable | 583.9 | 737.2 | 906.3 | 943.0 | 979.0 | 978.2 | 1,031.0 | 1,087.0 |
| Yukon | Note ...: not applicable | 17.2 | 18.3 | 18.5 | 19.4 | 20.1 | 20.1 | 20.1 | 22.5 |
| Northwest Territories | Note ...: not applicable | 14.4 | 16.2 | 17.1 | 18.2 | 20.8 | 22.1 | 22.6 | 22.8 |
| Nunavut | Note ...: not applicable | 11.7 | 12.3 | 13.4 | 14.2 | 13.9 | 14.2 | 14.4 | 15.6 |
|
... not applicable Source: Statistics Canada, authors' calculations. |
|||||||||
On a per child basis, the highest GDP for early learning and child care is in Quebec, Ontario, Yukon and the Northwest Territories (Table 6). Quebec has the highest per-child GDP by a wide margin in all years, and it was approximately $3,700 higher per child than in Ontario in 2016. GDP values in Yukon and the Northwest Territories are higher than the Canadian average, but this comparison needs to be interpreted with caution, as no adjustment is taken for the differences in price level between the north and the south. In the same vein, the relatively low value per child in Nunavut may reflect changes in institutional structures, such as the use of informal daycare arrangements within families or the provision of early learning and child care that is incorporated into cultural learning and that is not delineated separately.
| 2008 | 2009 | 2010 | 2011 | 2012 | 2013 | 2014 | 2015 | 2016 | |
|---|---|---|---|---|---|---|---|---|---|
| dollars | |||||||||
| Canada | Note ...: not applicable | 4,242 | 4,651 | 5,247 | 5,679 | 6,240 | 6,431 | 6,345 | 6,455 |
| Newfoundland and Labrador | Note ...: not applicable | 1,776 | 1,921 | 2,103 | 2,346 | 3,315 | 3,541 | 3,708 | 3,612 |
| Prince Edward Island | Note ...: not applicable | 2,131 | 3,144 | 3,921 | 3,833 | 4,142 | 4,328 | 4,573 | 4,870 |
| Nova Scotia | Note ...: not applicable | 2,138 | 2,282 | 3,320 | 3,801 | 4,050 | 4,286 | 4,506 | 4,759 |
| New Brunswick | Note ...: not applicable | 2,397 | 2,472 | 2,541 | 2,697 | 2,887 | 3,025 | 3,049 | 3,280 |
| Quebec | Note ...: not applicable | 8,393 | 8,792 | 9,429 | 9,581 | 10,068 | 10,393 | 10,598 | 10,737 |
| Ontario | Note ...: not applicable | 3,864 | 4,439 | 5,181 | 6,068 | 7,066 | 7,311 | 6,920 | 7,061 |
| Manitoba | Note ...: not applicable | 2,992 | 2,987 | 3,819 | 3,988 | 3,892 | 3,983 | 4,142 | 4,367 |
| Saskatchewan | Note ...: not applicable | 2,305 | 2,394 | 2,581 | 2,756 | 2,849 | 2,955 | 2,992 | 3,149 |
| Alberta | Note ...: not applicable | 1,919 | 1,990 | 2,154 | 2,294 | 2,624 | 2,759 | 2,691 | 2,638 |
| British Columbia | Note ...: not applicable | 2,239 | 2,787 | 3,393 | 3,512 | 3,631 | 3,616 | 3,784 | 3,936 |
| Yukon | Note ...: not applicable | 7,614 | 7,901 | 7,723 | 7,703 | 8,001 | 7,806 | 7,644 | 8,333 |
| Northwest Territories | Note ...: not applicable | 3,730 | 4,124 | 4,309 | 4,632 | 5,437 | 5,904 | 5,875 | 5,833 |
| Nunavut | Note ...: not applicable | 2,596 | 2,604 | 2,749 | 2,841 | 2,737 | 2,751 | 2,743 | 3,016 |
|
... not applicable Source: Statistics Canada, authors' calculations. |
|||||||||
The growth rates from 2009 to 2016 follow roughly the same pattern as the provincial and territorial early learning and child care GDP values (Chart 1). This suggests that, with the possible exception of Yukon and Nunavut, the number of children may not be the predominant influence on changes in the dollar value of GDP. Because a deflator is not currently available, it is not clear whether the increases stem from changes in prices or from changes in the quantity of child care (for example, from increased time spent in child care).
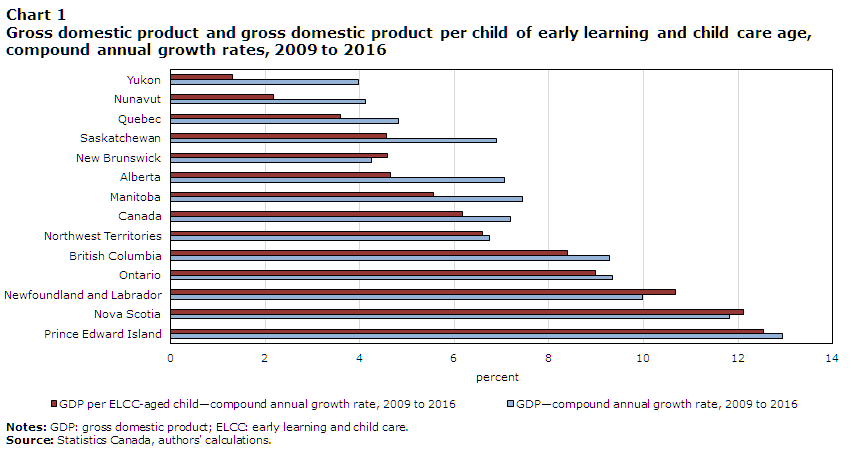
Data table for Chart 1
| GDP—compound annual growth rate, 2009 to 2016 | GDP per ELCC-aged child—compound annual growth rate, 2009 to 2016 | |
|---|---|---|
| percent | ||
| Yukon | 3.97 | 1.30 |
| Nunavut | 4.13 | 2.16 |
| Quebec | 4.81 | 3.58 |
| Saskatchewan | 6.89 | 4.56 |
| New Brunswick | 4.25 | 4.59 |
| Alberta | 7.07 | 4.65 |
| Manitoba | 7.45 | 5.55 |
| Canada | 7.18 | 6.18 |
| Northwest Territories | 6.75 | 6.60 |
| British Columbia | 9.28 | 8.40 |
| Ontario | 9.35 | 8.99 |
| Newfoundland and Labrador | 9.99 | 10.68 |
| Nova Scotia | 11.82 | 12.11 |
| Prince Edward Island | 12.93 | 12.53 |
|
Notes: GDP: gross domestic product; ELCC: early learning and child care. Source: Statistics Canada, authors' calculations. |
||
Child care revenue
Ideally, to measure revenue for child care businesses, the payments businesses receive from parents would be combined with subsidies or transfers that these firms receive from governments, and the value of taxes on production would be subtracted. This would then represent the revenue that firms receive for providing child care services. Because the government ledger files do not permit a full disaggregation of subsidies and transfers across provinces and territories, it is not currently possible to fully delineate the revenue of child care firms. What can be delineated is the revenue paid by parents, as is shown in Table 7 as separate line items. The value of total government expenses on early learning and child care, which are the same values from Table 4, is reported as potential revenue in lieu of direct measures of subsidies or transfers. An imputed value of junior kindergarten and kindergarten, as well as child care locations in non-child care firms, is also included.
Overall, revenue for child care and school system expenses for kindergarten and junior kindergarten increased by 59.5% (or 6.9% per annum) from 2009 to 2016, reaching $18.77 billion in 2016 (Table 6). Revenue for unincorporated child care businesses increased by 40.1% from 2009 to 2016, reaching $2.4 billion in 2016. This was slower than the growth in incorporated businesses, the revenue of which increased 57.4% over the same period to reach $5.77 billion. The imputation included for non-child care enterprises was essentially flat, while the imputation for expenditures on junior kindergarten and kindergarten roughly doubled to reach $5.9 billion in 2016.
| 2008 | 2009 | 2010 | 2011 | 2012 | 2013 | 2014 | 2015 | 2016 | |
|---|---|---|---|---|---|---|---|---|---|
| millions of dollars | |||||||||
| Corporate (T2) revenue from clients | 3,504 | 3,669 | 3,898 | 4,182 | 4,490 | 4,883 | 5,096 | 5,386 | 5,774 |
| Unincorporated (T1) revenue from clients | 1,549 | 1,710 | 1,930 | 2,237 | 2,293 | 2,367 | 2,421 | 2,415 | 2,395 |
| Government transfers and expenditures on early learning and child care predominantly provided to businesses | Note ...: not applicable | 3,432 | 3,771 | 4,305 | 4,791 | 5,369 | 5,218 | 4,694 | 4,525 |
| Imputation for non-child care enterprises with child care locations | 174 | 178 | 169 | 106 | 157 | 163 | 154 | 171 | 170 |
| Imputation for kindergarten and pre-kindergartenTable 7 Note 1 | 2,614 | 2,777 | 3,385 | 4,104 | 4,728 | 5,217 | 5,669 | 5,716 | 5,904 |
| Total revenue | Note ...: not applicable | 11,766 | 13,153 | 14,934 | 16,459 | 17,999 | 18,558 | 18,382 | 18,768 |
... not applicable
|
|||||||||
For revenue earned by businesses, the relatively small number of incorporated businesses received the majority of the total revenue. The larger number of small, unincorporated child care businesses received less than half of the child care revenue despite constituting more than 99% of child care firms. Since the data do not include the number of spaces, the percentage of child care spaces provided by these firms cannot be estimated, but revenue estimates suggest that small, unincorporated firms do not provide the majority of spaces.
Business dynamics
Measures of entry and exit provide information about the firm population dynamics in an industry or economy. Entry is important because of the potential for growth of the sector. Exit is important because exiting firms are typically less efficient firms that are not able to compete in markets as effectively as firms whose market share is increasing. Entrants are firms that are present in a given year but were not present the year before, while exits are firms that are not present in a given year but were present the year before.
To examine entry and exit rates for child care firms, the focus is on small, simple firms since they form a large part of the industry. These firms are the major determinant of entry and exit dynamics, and their churn is the main reason that the number of firms in an industry or economy will change. Child care firms have high entry rates and high exit rates relative to the business sector total. The entry rate has declined over time, from 33.0% in 2008/2009 to 17.9% in 2015/2016 (Table 8). At the same time, the exit rate has trended upward from 19.2% to 25.9%. As a result, the number of child care firms increased from 2009 to 2016 and declined thereafter.
| 2008-2009 | 2009-2010 | 2010-2011 | 2011-2012 | 2012-2013 | 2013-2014 | 2014-2015 | 2015-2016 | |
|---|---|---|---|---|---|---|---|---|
| percent | ||||||||
| Early learning and child care firms | ||||||||
| Entry rate | 33.0 | 27.1 | 25.5 | 23.7 | 22.3 | 20.9 | 19.5 | 17.9 |
| Exit | 19.2 | 16.3 | 18.2 | 21.5 | 21.9 | 22.0 | 23.1 | 25.9 |
| Business sector total of all private firms | ||||||||
| Entry rate | 13.4 | 13.5 | 13.3 | 13.1 | 12.7 | 12.8 | 12.4 | 12.2 |
| Exit | 12.4 | 11.7 | 11.5 | 11.6 | 11.6 | 11.4 | 11.4 | 11.9 |
| Sources: Statistics Canada, authors' calculations and Table 33-10-0164-01. | ||||||||
When firms enter a market, they immediately face competition and those firms least able to compete begin to exit the market. This process is well-documented for Canada (Archambault and Song 2018; Macdonald 2012; Baldwin et al. 2000). The rate at which new firms exit is typically examined using a survival curve. The survival curve is calculated for a particular cohort. In year 0, the cohort enters the market. The survival curve then shows the proportion of firms that remain in each subsequent year. Recent estimates for the Canadian business sector show that approximately half of new entrants exit the market within four years (Archambault and Song 2018).
For the 2008/2009 to 2014/2015 cohorts of child care firms, the survival curves are shown in Chart 2. Child care firms have steep survival curves, with more than two-thirds of all child care businesses from a given cohort having exited within three years. The high attrition rate means that the majority of child care businesses are active for less than three years, and that only around one in five firms are still active after seven years.
The survival curves also present a declining pattern over time, with survival curves for more recent cohorts lying below those of earlier cohorts. The pattern suggests that the attrition rate for new child care businesses is rising over time, so new firms in 2014/2015 would be less likely to survive three years than firms from the 2008/2009 cohort.

Data table for Chart 2
| Years after entry | ||||||||
|---|---|---|---|---|---|---|---|---|
| 0 | 1 | 2 | 3 | 4 | 5 | 6 | 7 | |
| percent | ||||||||
| Small businesses, Canada | 100 | 92 | 83 | 75 | 68 | 63 | 58 | 54 |
| 2008-2009 cohort | 100 | 72 | 56 | 44 | 36 | 30 | 25 | 20 |
| 2009-2010 cohort | 100 | 70 | 51 | 40 | 33 | 27 | 22 | Note ...: not applicable |
| 2010-2011 cohort | 100 | 69 | 51 | 41 | 33 | 26 | Note ...: not applicable | Note ...: not applicable |
| 2011-2012 cohort | 100 | 64 | 46 | 36 | 27 | Note ...: not applicable | Note ...: not applicable | Note ...: not applicable |
| 2012-2013 cohort | 100 | 62 | 45 | 32 | Note ...: not applicable | Note ...: not applicable | Note ...: not applicable | Note ...: not applicable |
| 2013-2014 cohort | 100 | 60 | 40 | Note ...: not applicable | Note ...: not applicable | Note ...: not applicable | Note ...: not applicable | Note ...: not applicable |
| 2014-2015 cohort | 100 | 55 | Note ...: not applicable | Note ...: not applicable | Note ...: not applicable | Note ...: not applicable | Note ...: not applicable | Note ...: not applicable |
|
... not applicable Sources: Statistics Canada, authors' calculations and National Accounts Longitudinal Microdata File. |
||||||||
The combination of high entry and exit rates, as well as a steep survival curve, indicates that child care firms exhibit a lot of churning. This is consistent with an industry with limited barriers to entry and where exit costs are low. It is also consistent with an industry where many small firms exist and where it is difficult to generate economies of scale.
Conclusion
The early learning and child care industry in Canada is a critical industry that supports children’s development and the workforce attachment of parents across the economy. The estimates from Archer et al. reported here show that it had an estimated GDP of $15.1 billion in 2016. The industry is composed predominantly of small firms that typically earn less than $10,000 in income per annum. These firms are predominantly owned by women and have short life spans. Typically, over two-thirds of all firms that enter in a given year exit the market within three years. Combined with the short life span of the firms, the entry and exit rates for child care providers are above the rates of entry and exit for the business sector. As a consequence, the child care industry exhibits a large degree of churning.
Within the early learning and child care industry, there is a mixture of large and small firms, as well as public sector participation. Small firms make up over 99% of all active firms and a similar proportion of locations in the child care industry. The scale of these firms tends to be small. They almost always earn less than $60,000 per year and tend to earn from $4,000 to $8,000. These firms tend to be unincorporated and likely correspond to the small home daycares that are ubiquitous in the child care market in Canada.
Larger firms tend to earn more; some have more than $1 million in revenue. These firms are the exception in the industry. They are incorporated firms that are likely to be licensed daycare businesses and have multiple locations where child care is offered.
The public sector provides direct support for child care in two ways.
One way is through directly providing early learning educational services through junior kindergarten and kindergarten that serve pre-primary-aged children for full or partial days depending on the province and year. While statistics on the cost of junior kindergarten and kindergarten are not provided separately, an imputation based on the proportion of students in these classes is provided so that rough expenditures on these activities can be included in cross-provincial comparisons. Based on the imputations, the public sector portion of child care has a GDP that is slightly larger than the factor-cost GDP of the private sector, and its GDP has been growing quickly.
The other way that the public sector provides direct support for child care is through subsidies and transfers. Here, the measurement is less precise, as government ledger files identify expenditures based on programs, as opposed to goods or services that are purchased. Furthermore, expenses are not recorded across provinces and territories in a systematically comparable fashion. As a result, the value for government support includes non-child care expenses for things like running government departments that are needed to make program expenditures or for activities such as child protective services. This affects the measurement of subsidies and transfers by creating an overestimate, but still allows for consistent estimation to compare expenditures across provinces and territories and to calculate an estimate for Canada as a whole. The support from the government for early learning and child care activities, including residential (foster) care, is approximately one-third of the total early learning and child care GDP for Canada.
While this study can provide information on child care business characteristics, it cannot provide information about many aspects of the child care industry. The use of administrative data captures a large number of firms, and imputations for the role of the school system allow for interprovincial comparisons. However, the data may be incomplete. It is not currently clear how charities structure their daycare ownership, and this may affect future sets of estimates. If charities tend to hold their child care business activities in an incorporated subsidy, then their activity is reflected in the reported estimates. If, however, charities are not incorporating subsidiaries in which they operate daycares, then the estimates will be revised upward as more information on charities becomes available.
The administrative data used to compile the report also do not differentiate between licensed and unlicensed child care, although unincorporated businesses run by a single employee are known to be less likely to be licensed than incorporated businesses with multiple employees. In addition, these data are compiled based on the type of tax files received rather than the for-profit or not-for-profit status of the business. Future work with the administrative files can alleviate the latter issue. The current estimates cannot provide information about child care provided by registered charities or differentiate between activities by government agencies such as support for child care businesses through drop-in centres, or child protective services. As a result, the estimates are not complete, nor are they available for all types of child care provision. Similarly, the data do not provide information about the number of child care spots, divisions between full-time and part-time child care, or the quality of child care. These are important questions, but the administrative data currently in use are not well suited to answer them.
Despite these limitations, the calculations presented here are the most comprehensive examination of child care businesses and the size of the child care industry to date. And, while they are a first step that will doubtless be improved upon, they do illustrate the size, nature and characteristics of child care firms, as well as the level of government support and the relative size of the early learning industry in the school system.
References
Archambault, R., and M. Song. 2018. Canadian New Firms: Birth and Survival Rates over the Period 2002–2014. Ottawa: Innovation, Science and Economic Development Canada. Available at: (https://www.ic.gc.ca/eic/site/061.nsf/vwapj/CNF_BSR-NEC_TNS_2002-2014_May2018_eng.pdf/$file/CNF_BSR-NEC_TNS_2002-2014_May2018_eng.pdf) (accessed August 28, 2020).
Archer, J., B. Duhamel, C. Yam, R. Macdonald, and J. Watt. Child Care Businesses in Canada: Technical Derivation of Business Characteristics and Industry GDP. Forthcoming.
Baldwin, J., L. Bian, R. Dupuy, and G. Gellatly. 2000. Failure Rates for New Canadian Firms: New Perspectives on Entry and Exit. Statistics Canada Catalogue no. 61-526-X. Ottawa: Statistics Canada.
Macdonald, R. 2012. Firm Dynamics: The Death of New Canadian Firms: A Survival Analysis of the 2002 Cohort of Entrants to the Business Sector. The Canadian Economy in Transition, no. 28. Statistics Canada Catalogue no. 11-622-M. Ottawa: Statistics Canada.
Sinha, M. 2014. “Child care in Canada.” In Spotlight on Canadians: Results from the General Social Survey. Statistics Canada Catalogue no. 89-652-X. Ottawa: Statistics Canada.
Statistics Canada. 2002. Gross Domestic Product by Industry: Sources and Methods. Statistics Canada Catalogue no. 15-547-X. Ottawa: Statistics Canada.
Statistics Canada. 2010. A Brief Guide to the BR. Ottawa: Statistics Canada. Available at: (http://www.statcan.gc.ca/eng/statistical-programs/document/1105_D2_T1_V3-eng.pdf) (accessed August 31, 2020).
Statistics Canada. 2019. Statistics Canada Quality Guidelines. Sixth edition. Ottawa: Statistics Canada.
Statistics Canada. 2020a. Business Register (BR). Ottawa: Statistics Canada. Available at: (https://www23.statcan.gc.ca/imdb/p2SV.pl?Function=getSurvey&SDDS=1105) (accessed August 31, 2020).
Statistics Canada. 2020b. North American Industry Classification System (NAICS) Canada 2017 Version 3.0. Ottawa: Statistics Canada. Available at: https://www23.statcan.gc.ca/imdb/p3VD.pl?Function=getVD&TVD=1181553 (accessed August 31, 2020).
United Nations, European Commission, International Monetary Fund, Organisation for Economic Co-operation and Development, and World Bank. 2009. System of National Accounts, 2008. New York: United Nations. Available at: (https://unstats.un.org/unsd/nationalaccount/docs/sna2008.pdf) (accessed August 28, 2020).
- Date modified: