
Economic and Social Reports
The Canada Emergency Wage Subsidy program and business survival and growth during the COVID-19 pandemic in Canada
DOI: https://doi.org/10.25318/36280001202200200006-eng
Skip to text
Text begins
Abstract
The COVID-19 pandemic had a major impact on businesses in 2020. In response, the Government of Canada introduced measures to support both individuals and businesses through the pandemic. The largest measure for businesses was the Canada Emergency Wage Subsidy (CEWS). This paper presents firm-level evidence on the relationship between the usage of CEWS programs and the survival and growth of businesses, controlling for the pre-pandemic characteristics of businesses and, where possible, their use of two other important programs: the Canada Emergency Business Account and the Canada Emergency Commercial Rental Assistance programs.
Between March and September 2020, 41.6% of all employer businesses that were active in February 2020 used the CEWS at least once. This use was associated with a 6.9 percentage point lower probability of being closed, where closure is defined as not having any employment for the entire six-month period from October 2020 to March 2021. This finding takes into account the pre-pandemic characteristics of the businesses, seasonality in closures and the use of other support programs. The cumulative employment growth rates between February 2020 and the average of the final three months of 2020 were 5.0 percentage points higher among surviving business that used the CEWS and those that did not. The study also shows that when endogeneity of the choice to use the CEWS is taken into account, the impact of using it increases—that is, the probability of closure drops more, and the employment growth rate conditional on survival rises.
Finally, the study indicates that businesses at greater risk of closure because of pre-pandemic characteristics (entrants in 2019, smaller businesses, less productive businesses, and businesses with less liquidity, greater indebtedness, few assets and lower profitability) and businesses in the accommodation and food services, and arts, entertainment and recreation industries (which were more directly impacted by travel and restrictions on gathering) benefited more from using the CEWS, compared with all employer businesses.
Authors
Danny Leung and Huju Liu are with the Economic Analysis Division at Statistics Canada.
Acknowledgments
The authors would like to thank Alexander Amundsen, Farrukh Suvankulov and other session participants at the 55th Canadian Economic Association Annual Meetings, and reviewers from Finance Canada and Innovation, Science and Economic Development Canada for helpful comments.
Introduction
In 2020, the COVID-19 pandemic had a major impact on businesses across Canada. Roughly 12% of employer businesses that were active in February were closed by September and remained closed in November.Note Note According to the Canadian Survey on Business Conditions, more than 50% of businesses reported a decline in revenue between August 2019 and August 2020.Note
In response to the pandemic, the Government of Canada rolled out the Canada Emergency Response Plan to provide a number of programs to help business and individuals. The largest of the programs targeted at businesses was the Canada Emergency Wage Subsidy (CEWS). In Budget 2021, the direct program expense for the CEWS was reported as $84.6 billion for fiscal year 2020/2021.Note Since March 2020, the CEWS offered payroll support to eligible employers through a 75% wage subsidy. Initially, organizations needed to exhibit a threshold level of decreased revenue (15% in the period from March 15 to April 11, and 30% afterward) to be eligible. That restriction was relaxed in July, whereby the subsidy was scaled by drop in revenue.Note
This paper examines the relationship between whether a business used the CEWS and its survival and employment growth.Note It takes into account business characteristics identified as being important to a firm’s survival. According to the Schumpeter’s theory of creative destruction, younger and more innovative firms are continually replacing older, less efficient ones. Baldwin and Gorecki (1995) provide evidence of this phenomenon in Canada. Age, size and productivity, however, are not the only business characteristics that are important for firm survival, especially during an economic crisis. Barlevy (2003) suggests that efficient producers are more vulnerable during downturns, as they tend to have higher financial needs and borrow more. Bosio et al. (2020) argue that exporters, who tend to be more productive, could be hurt more during a pandemic that is accompanied by strict border controls. Equivalently, businesses involved in global value chains and importers may suffer because of supply disruptions. As shown in Baldwin and Yan (2014), global value chain manufacturing firms (that both export and import), firms that only export and firms that only import intermediate goods tend to be larger and more productive than firms that neither import nor export.
Key sources of data include: data on business openings and closuresNote derived from Statistics Canada’s Business Register and the PD7 Payroll Deductions Files; CEWS program data from the Canada Revenue Agency; and other administrative data sources that contain information on firm age, size, productivity, liquidity, profitability, indebtedness and whether a firm participates in trade. All data are aggregated to the enterprise level, and the terms “enterprise”, “firm”, and “business” are used synonymously in this study. Program data from the Canada Emergency Business Account (CEBA) and the Canada Emergency Commercial Rental Assistance (CECRA) are also included so that the estimated impact of the CEWS can take into account the availability and usage of these programs, where possible. However, a comparison of the estimated impacts of the CEWS, CEBA and CECRA are not made because the timely firm-level data on survival and growth are for employer businesses only. It excludes non-employer businesses that could have benefited from the CEBA and CECRA, and includes businesses that do not qualify for the CEBA or CECRA.
This study finds that, among employer businesses active in February 2020, using the CEWS between March and September 2020 was associated with a 6.9 percentage point lower probability of being closed (having no employees) from October 2020 to March 2021. This result takes into account the pre-pandemic characteristics of the business (industry, province or territory, employment and asset size, age, labour productivity, trader status, indebtedness, liquidity and profitability), and CEBA and CECRA usage.Note For employer businesses that were active in February 2020 and that remained open after October 2020, CEWS usage is associated with a 5.0 percentage point increase in the cumulative employment growth rate between February and the average of the last three months in 2020. By and large, the results hold when endogeneity of the choice to use the CEWS is taken into account.
Businesses with a higher risk of closure based on pre-pandemic characteristics, or in the accommodation and food services, and arts, entertainment and recreation industries, also had stronger correlations between using the CEWS program and business survival and business employment growth. For example, employer businesses in the combined accommodation and food services and arts, entertainment and recreation sector that used the CEWS had an 18.5 percentage point lower probability of being closed and a 13.6 percentage point higher employment growth rate.
The next section describes the data used to support the analysis and presents summary statistics on the business closure rates, employment growth rates and usage rates of the CEWS by various business characteristics. Section 3 describes the methodological approach to estimating the relationships between CEWS usage, the probability of being closed and employment growth. Section 4 presents estimates of the strength of the relationships, how that strength varies by type of business and how estimates are impacted by endogeneity. Finally, Section 5 summarizes the results, presents caveats and discusses possible future work.
Data
The central data source for this study is the microdata from the June 2021 release of experimental business openings and closures statistics. These data cover the period up to March 2021. The data on business openings and closures are derived from Statistics Canada’s Business Register and the PD7 Payroll Deductions Files from the Canada Revenue Agency.Note With these data, it is possible to establish whether a business was active (had some employees on payroll) in a given month, and the number of employees it had that month. A business can also be followed over the months to track whether it has closed or reopened, or increased or decreased its employment size.
This paper focuses on the population of businesses that were active in February 2020, and follows them until March 2021 to determine whether they were closed. Closed is defined as having no employees over the entire six-month period between October 2020 and March 2021. In this paper, a business is an enterprise—to be classified as closed, it would need to have zero employment at all locations across Canada. Businesses that had employees in at least one month between October 2020 and March 2021 are labelled as open.Note Defining business opening and closure over a six-month period allows for a focus on less transitory changes in status. Seasonality could also be responsible for transitory changes in status. To account for these businesses, those that exhibited possible seasonal patterns in 2019 were removed from the analysis. Specifically, businesses that were closed in September, October and November of 2019 but had activity in the preceding months of the same year were excluded.Note Of the roughly 830,000 non-seasonal, active employer businesses in February 2020, 9.9% closed (had no employees over the entire six-month period between October 2020 and March 2021).Note In addition to activity status and employment, the industry and province of the business also come from openings and closures microdata.Note
Data on business openings and closures were then linked to the 2019 T2 Corporate Income Tax data. The T2 data provide financial variables such as assets, liabilities, current assets, current liabilities and net income, which are used to calculate the profitability, liquidity, debt and size measures in this paper.Note The financial data can also be used to derive a measure of value added. When combined with the employment data, a measure of labour productivity can be obtained. The data on business openings and closures are also linked to the trade by exporter characteristics and trade by importer characteristics data from Statistics Canada. These data can be used to identify whether a business was an exporter, importer, exporter and importer, or neither an exporter nor importer in 2019. The age of a business and whether it is foreign-controlled is derived from the Business Register.
To complete the database, program data for the CEWS, CEBA and CECRA programs were added. Specifically, indicator variables on whether a business used these programs during the period from March 2020 to September 2020 are included.Note Table 1 shows the usage rates for these programs. Overall, 41.6% of active employer businesses in February 2020 used the CEWS at least once. A greater percentage, 57.2%, received a CEBA loan. The lower CEWS usage may be explained by the fact that CEWS applicants had to demonstrate a drop in revenue to obtain the subsidy, while no such criteria existed for the CEBA. A much smaller percentage, 6.9%, received the CECRA. The accommodation and food services industry and that of arts, entertainment and recreation were more affected by the economic and social restrictions used to control the pandemic, so usage rates were higher, at 66.7% for the CEWS, 78.9% for the CEBA and 23.5% for the CECRA.
| CEWS | CEBA | CECRA | |
|---|---|---|---|
| percent | |||
| All | 41.6 | 57.2 | 6.9 |
| Accommodation and food services and arts, entertainment and recreation | 66.7 | 78.9 | 23.5 |
|
Notes: CEWS refers to the Canada Emergency Wage Subsidy. CEBA refers to the Canada Emergency Business Account. CECRA refers to the Canada Emergency Commercial Rental Assistance. Sources: Statistics Canada, Canada Emergency Wage Subsidy, Canadian Emergency Business Account, Canada Emergency Commercial Rent Assistance, monthly business openings and closures, T2 Corporate Income Tax, Trade by Exporter Characteristics and Trade by Importer Characteristics. |
|||
Table 2 provides evidence of the greater impact of the pandemic on accommodation and food services and arts, entertainment and recreation. Of all employer businesses in February 2020, 9.9% were closed, with no employees between October 2020 and March 2021. This compares with 10.8% for accommodation and food services and arts, entertainment and recreation combined. The differential impact on employment growth was even larger. Table 2 shows the cumulative employment growth for continuing businesses between February 2020 and the three-month average employment for the period from October to December 2020.Note Three-month average employment was necessary because a continuing business could have zero employment in a given month. On average, employment decreased 8.9% between February 2020 and the average for the last three months of 2020 for all continuing employer businesses. This is compared with an average decrease of 25.2% for continuing employer businesses in accommodation and food services and arts, entertainment and recreation.
| Closure rate | Employment growth rate | CEWS program usage rate | |
|---|---|---|---|
| percent | |||
| All | 9.9 | -8.9 | 41.6 |
| Accommodation and food services and arts, entertainment and recreation | 10.8 | -25.2 | 66.7 |
| Firm size | |||
| Less than 5 employees | 12.9 | -6.0 | 29.2 |
| 5 to 19 employees | 5.3 | -12.9 | 61.2 |
| 20 to 99 employees | 3.2 | -14.8 | 68.5 |
| 100 or more employees | 2.0 | -12.8 | 60.7 |
| Age in 2019 | |||
| 0 | 26.9 | -10.6 | 34.9 |
| 1 to 2 | 9.9 | -7.2 | 42.1 |
| 3 to 5 | 8.5 | -8.2 | 44.6 |
| 6 to 10 | 7.5 | -8.6 | 43.9 |
| 11 to 20 | 6.9 | -8.5 | 42.6 |
| 21 to 50 | 5.8 | -7.2 | 43.8 |
| 51 and older | 3.4 | -5.3 | 51.3 |
| Labour productivity (decile) | |||
| 1 | 11.8 | -24.6 | 47.7 |
| 2 | 7.3 | -15.2 | 49.4 |
| 3 | 6.1 | -8.9 | 47.5 |
| 4 | 5.1 | -5.3 | 49.7 |
| 5 | 4.6 | -3.7 | 53.0 |
| 6 | 4.1 | -2.5 | 54.5 |
| 7 | 3.7 | -2.0 | 53.6 |
| 8 | 4.1 | -1.9 | 50.2 |
| 9 | 4.2 | -1.9 | 43.4 |
| 10 | 5.2 | -3.8 | 33.0 |
| Debt-to-asset ratio | |||
| Less than 0.2 | 5.5 | -7.6 | 36.7 |
| 0.2 to 0.4 | 4.5 | -5.8 | 48.0 |
| 0.4 to 0.6 | 4.2 | -4.9 | 51.8 |
| 0.6 to 0.8 | 4.5 | -4.5 | 53.0 |
| 0.8 or more | 8.4 | -9.4 | 47.3 |
| Current ratio | |||
| Less than 50% | 10.0 | -8.5 | 45.6 |
| 50% to 100% | 6.4 | -5.8 | 50.5 |
| 100% to 200% | 4.8 | -4.5 | 53.4 |
| 200% to 400% | 4.6 | -5.0 | 49.6 |
| Over 400% | 5.8 | -6.6 | 37.6 |
| International trader status | |||
| Not international trader | 7.8 | -8.4 | 40.3 |
| Export only | 6.1 | -6.9 | 58.0 |
| Import only | 4.4 | -5.6 | 60.3 |
| Export and import | 2.3 | -5.2 | 70.3 |
|
Note: CEWS refers to the Canada Emergency Wage Subsidy. Sources: Statistics Canada, Canada Emergency Wage Subsidy, Canadian Emergency Business Account, Canada Emergency Commercial Rent Assistance, monthly business openings and closures, T2 Corporate Income Tax, Trade by Exporter Characteristics and Trade by Importer Characteristics. |
|||
Table 2 also shows the experience of businesses over the pandemic by other characteristics. It shows that small firms with less than 5 employees have a higher rate of closure (12.9%) than firms with 5 to 19 employees (5.3%). This rate of closure continues to decline with size. Businesses with 20 to 99 employees have a 3.2% closure rate, and businesses with 100 or more employees have the lowest rate, at 2.0%. Businesses in the lowest labour productivity decile have the highest closure rate at 11.8%. As productivity increases, the closure rate falls until the seventh decile at 3.7%, then rises slightly to 5.2% for the tenth decile. This increase may be related to Barlevy’s (2003) finding that more efficient firms may be credit constrained during downturns. Contrary to Schumpeter’s creative destruction theory, entrants—businesses that first had activity in 2019 or later—have a closure rate at almost three times the average (26.9% compared to 9.9%). The closure rate declines with age. Firms that are 51 years or older have the lowest closure rate at 3.4%. The findings on firm age may also be explained by credit constraints, as younger firms will have less of a track record. Owners of new firms may also face more uncertainty than older ones, as they would have had less opportunity to observe whether their businesses were viable in normal economic times.
As documented in Leung (2021), the relationship between closure and some of the financial ratios is non-linear. For example, businesses with the lowest debt-to-asset ratios (less than 0.2) have a closure rate of 5.5%. This category may represent businesses that are not able to access debt financing. The closure rate subsequently falls in higher debt-to-asset ratio categories—businesses with a debt-to-asset ratio between 0.4 and 0.6 have a closure rate of 4.2%. However, businesses in the highest debt-to-asset ratio category of 0.8 or more have the highest closure rates, at 8.4%.Note Firms in this last category include those with low assets.
The relationship between the closure rate and liquidity is also non-linear. A 10.0% closure rate is observed for businesses with a current ratio (current assets over current liabilities) of less than 50%. These businesses are the least liquid in the sense that the liquidation of current assets cannot cover short-term liabilities. The closure rate reaches a low of 4.6% for businesses with a current ratio between 200% and 400%. It then climbs to 5.8% for businesses with a current ratio of 400% or more. Similar to the analysis for the debt-to-asset ratio, businesses in this last category include those with low current liabilities.Note
It was also found that businesses with some international exposure had lower closure rates. Firms that export and import had the lowest closure rates at 2.3%, while firms that did not import or export had the highest closure rates, at 7.8%. Supply chain disruptions and reduced access to external markets may have played a role, but this may have been offset by the fact that businesses with international exposure tend to be larger and have higher productivity.
Although there are a significant number of closed businesses, their contribution to aggregate employment changes is small. Lafrance-Cooke (2021) showed continuing businesses accounted for most of the aggregate employment changes from March to August 2020. This highlights the need not only to study the impact of business liquidity support programs on the survival of businesses, but also on the employment growth of continuing businesses.
Despite exhibiting the highest closure rates, surviving businesses with less than 5 employees exhibited the smallest declines in employment growth at 6.0%. Businesses with more than 5 employees exhibited greater declines than average. Those with 5 to 19 employees, 20 to 99 employees, and 100 or more employees had employment growth rates of -12.9%, -14.8% and -12.8%, respectively.
Aside from statistics by employment size for businesses, the results for employment growth rates are similar to those of closure rates in other dimensions. That is, categories of businesses that had higher closure rates generally also had higher average employment declines, in percentage terms.
Table 2 also shows usage rates of the CEWS for the same business characteristics as reported for business closures and employment growth. Usage of the CEWS rises from 29.2% for businesses with less than 5 employees to 61.2% for businesses with 5 to 19 employees. It then increases to 68.5% for businesses with 20 to 99 employees and tails off at 60.7 for businesses with 100 or more employees. Low usage of the CEWS for the smallest businesses is consistent with their higher closure rate. Liu et al. (2021) also found that the smallest businesses have the lowest usage rates. Less capital-intensive small businesses may have lower fixed costs than more capital-intensive larger businesses. Thus, it may be better for the smallest businesses to close rather than to continue operating.
By comparison to other businesses, entrants in 2019 or later were much less likely to use the CEWS (34.9%). Entrants tend to be smaller, and the logic that applies for small firms may also apply here. In addition, entrants would have had less time to observe their demand conditions in pre-pandemic times. They would therefore face more uncertainty than small firms that were longer lived. This may explain why entrants are more likely to close and less likely to use support programs. Usage of the CEWS is not found to increase monotonically with age. The usage rates fluctuate from 42.1% to 44.6% for firms aged 1 to 50, with the oldest firms (51 years and older) having the highest program usage rates at 51.3%.
Usage rates for the CEWS by debt-to-asset ratio and current ratio categories follow a pattern opposite to that for closure rates. Businesses that are more likely to be closed (high or low debt-to-asset ratio, and high or low current ratio) are the least likely to use the programs. Businesses with high debt or low liquidity may have had greater difficulty coping with a large negative revenue shock. This could explain the higher rate of closure and low program usage rates for this group of businesses.
Finally, the industry variation in CEWS usage tends to reflect the relationships already discussed. CEWS usage is highest in industries hit hardest by the pandemic, such as art, entertainment and recreation, and accommodation and food services. Industries with larger firms, such as manufacturing, also have higher rates of CEWS usage.
The next section discusses in more detail the relationships between the CEWS program usage and business survival and business employment growth.
Methodology
The main objective of the paper is to assess the strength of the relationships between CEWS usage and business survival and employment growth. Table 3 shows the strength of these relationships when not accounting for any other factors. Businesses that used the CEWS between March and September 2020Note had a closure rate (rate of being without employment in the six-month period between October 2020 and March 2021) that was 10.9 percentage points lower than businesses that did not use the CEWS. In the combined accommodation and food services and arts, entertainment and recreation sector, the relationship is even stronger. Businesses that used the CEWS had a closure rate that was 23.4 percentage points lower than businesses that did not use it.
| Difference in closure rate | Difference in employment and growth rate | |
|---|---|---|
| percent | ||
| All | -10.9 | 2.5 |
| Accommodation and food services and arts, entertainment and recreation | -23.4 | 0.6 |
| Sources: Statistics Canada, Canada Emergency Wage Subsidy, Canadian Emergency Business Account, Canada Emergency Commercial Rent Assistance, monthly business openings and closures, T2 Corporate Income Tax, Trade by Exporter Characteristics and Trade by Importer Characteristics. | ||
Between February and the last three months of 2020, continuing businesses that used the CEWS between March and September had an average cumulative employment growth rate that was 2.5 percentage points higher than businesses that did not use the CEWS. In the combined accommodation and food services and arts, entertainment and recreation sector, businesses that used the CEWS had an employment growth rate that was 0.6 percentage points higher. It should be noted that while program users had higher employment growth rates than businesses that did not use the CEWS, growth rates were still negative.
The results in Table 3, however, may be affected by other business characteristics having not been taken into account. Table 2 demonstrates the potential importance of considering other factors. For example, CEWS usage increases with the employment size of a firm, while the closure rate falls with size. Even if there is no relationship between the probability of being closed and CEWS usage, a negative relationship may be estimated if firm size is not taken into account. This is because the negative impact of increasing firm size on the probability of being closed could be misinterpreted as the impact of using the CEWS.
The probit regression in (1) is estimated to examine the relationship between the probability of a business being closed between October 2020 and March 2021 and CEWS usage between March and September 2020, taking into account business characteristics.
(1)
where is a categorical variable that equals 1 if a business that was active in February 2020 is closed, that is, has no employees for the entire period from October 2020 to March 2021, and 0 otherwise. The subscript denoting data for each active business in February 2020 has been suppressed for simplicity. The probability of being closed depends on a vector of business characteristics that includes categorical variables for each province and territory; three-digit North American Industrial Classification Code industry; employment size, age and level of labour productivity of the firm; debt-to-asset ratio group; current ratio group; profitability (based on return to assets, or net income-to-asset ratio) groups; asset size of business deciles; when firm financial variables are missing; the international trader status of the firm; and whether a firm is foreign controlled. These business characteristics are for the pre-pandemic period. Industry, province and employment size are from February 2020, while firm financials are for 2019. CEWS is 1 if the business used the CEWS at least once between March and September 2020, and 0 otherwise. CEBA is 1 if the business obtained a CEBA loan between April and September 2020, and 0 otherwise. CECRA is 1 if the business used the CECRA between April and September 2020, and 0 otherwise. is a firm-specific instrumental variable that is correlated with the probability of closure, but not the employment growth of the firm. It is the cumulative employment growth rate between February 2020 and the average of the last three months of 2020 for the industry of the business and province, and excludes the employment growth of the business itself.
The relationship between employment growth and CEWS and CEBA usage, taking into account the characteristics of businesses, can be estimated using equation (2).
(2)
where %∆EmpOct-Feb is the cumulative employment growth rate of a continuing business between February 2020 and the average over the last three months of 2020. , CEWS, CEBA and CECRA are defined as in equation (1).
The estimation of (1) and (2) can be complex because the choice to use the CEWS, CEBA and CECRA is endogenous, and employment growth is conditional on survival. Use of the CEWS, CEBA and CECRA are endogenous business choices and can be modelled using probit regressions (3), (4) and (5), respectively.
(3)
(4)
(5)
where CEWS, CEBA, CECRA and are defined as above, and and and are firm-specific instrumental variables. They include the instrument described above and employment-weighted program usage rates by province and industry that exclude the business itself. These employment-weighted usage rates capture the shock that affected the province and industry level, but exclude the firm’s own contribution to avoid endogeneity. It is necessary to model the choice of using a program because the unobserved business-level error term that causes a business to use the CEWS, for example, is likely correlated with the unobserved business-level error term that causes a business to be closed. A bad shock that reduces the revenue of a business and causes it to be eligible for the CEWS could increase the probability of being closed. If the shock was negative enough, however, it could also increase the probability of being closed and decrease the probability of using the CEWS. The correlation between these error terms is an empirical question.
The following section shows the results of equation (1) and (2) being estimated separately using a simple probit and ordinary least squares. To show the direction of the estimate bias when the equations are estimated separately, an attempt is made to estimate equations (1) to (5) jointly, assuming the error terms from the five equations are normally distributed and take into account endogeneity and selection. The joint estimation has convergence issues when equation (5) is included in the system of equations (when CECRA usage is modelled as endogenous) for all businesses. Convergence issues do not present themselves when the estimation is done for the combined accommodation and food services and arts, entertainment and recreation sector. This is possibly related to the fact that relatively few firms use the CECRA when all businesses are considered (Table 1). Therefore, the joint estimation for all businesses excludes equation (5). The impact of this exclusion is likely to have a relatively smaller impact on the joint estimation for all businesses because a smaller proportion of businesses use the CECRA.
Results
Canada Emergency Wage Subsidy usage and the probability of being closed
Table 4 shows the marginal effects of using the CEWS before October on the probability of being closed (having no employees in the six-month period between October 2020 and March 2021). Once pre-pandemic firm characteristics are taken into account, the marginal effect of using the CEWS on the probability of closure falls from -10.9 percentage points to -6.9 percentage points for all businesses. As discussed in the introduction, the focus of the paper is on the CEWS because the population studied is employer businesses. Since the research design is not meant to estimate the relative efficacy of the programs, the coefficient estimates for the CEBA and CECRA are not reported, but they are included in all regressions.
| All industries | Acommodation and food services and arts, entertainment and recreation | |||||||
|---|---|---|---|---|---|---|---|---|
| P (Closed = 1) | Employment growth (%) | P (Closed = 1) | Employment growth (%) | |||||
| marginal effect | p-value | coef. | p-value | marginal effect | p-value | coef. | p-value | |
| CEWS | -0.069 | 0.000 | 5.0 | 0.000 | -0.185 | 0.000 | 13.6 | 0.000 |
| Employment size | ||||||||
| 5 to 19 employees | -0.023 | 0.000 | -12.0 | 0.000 | -0.007 | 0.000 | -31.9 | 0.000 |
| 20 to 99 employees | -0.035 | 0.000 | -17.9 | 0.000 | -0.003 | 0.329 | -50.9 | 0.000 |
| 100 or more employees | -0.046 | 0.000 | -19.6 | 0.000 | -0.040 | 0.000 | -61.5 | 0.000 |
| Age in 2019 | ||||||||
| 0 | 0.038 | 0.000 | 2.9 | 0.000 | 0.011 | 0.021 | 7.2 | 0.000 |
| 1 to 2 | 0.012 | 0.000 | 2.6 | 0.000 | 0.006 | 0.058 | 3.7 | 0.000 |
| 3 to 5 | 0.008 | 0.000 | 1.0 | 0.000 | 0.008 | 0.003 | 0.3 | 0.618 |
| 11 to 20 | -0.003 | 0.000 | -0.6 | 0.316 | -0.002 | 0.334 | 0.0 | 0.982 |
| 21 to 50 | -0.011 | 0.000 | 0.9 | 0.000 | -0.013 | 0.000 | 2.9 | 0.000 |
| 51 and older | -0.017 | 0.000 | 2.7 | 0.000 | -0.026 | 0.002 | 16.0 | 0.000 |
| Labour productivity (decile) | ||||||||
| 2 | -0.016 | 0.000 | 3.9 | 0.000 | -0.012 | 0.000 | 1.1 | 0.070 |
| 3 | -0.021 | 0.000 | 6.3 | 0.000 | -0.017 | 0.000 | 2.0 | 0.014 |
| 4 | -0.024 | 0.000 | 7.5 | 0.000 | -0.015 | 0.001 | -0.7 | 0.540 |
| 5 | -0.023 | 0.000 | 7.8 | 0.000 | -0.012 | 0.032 | 0.9 | 0.511 |
| 6 | -0.024 | 0.000 | 7.9 | 0.000 | -0.009 | 0.187 | -0.6 | 0.712 |
| 7 | -0.026 | 0.000 | 7.8 | 0.000 | -0.018 | 0.010 | 3.1 | 0.091 |
| 8 | -0.023 | 0.000 | 7.3 | 0.000 | -0.003 | 0.702 | -1.2 | 0.537 |
| 9 | -0.026 | 0.000 | 6.5 | 0.000 | -0.019 | 0.013 | 0.5 | 0.823 |
| 10 | -0.019 | 0.000 | 2.6 | 0.000 | -0.004 | 0.651 | -3.2 | 0.153 |
| Debt-to-asset ratio | ||||||||
| 0.2 to 0.4 | -0.005 | 0.000 | 2.5 | 0.000 | -0.003 | 0.562 | 1.8 | 0.086 |
| 0.4 to 0.6 | -0.007 | 0.000 | 3.6 | 0.000 | -0.010 | 0.040 | 1.9 | 0.072 |
| 0.6 to 0.8 | -0.005 | 0.000 | 4.2 | 0.000 | -0.012 | 0.011 | 2.6 | 0.019 |
| 0.8 or more | 0.000 | 0.904 | 4.0 | 0.000 | 0.002 | 0.679 | 0.7 | 0.455 |
| Current ratio | ||||||||
| 50% to 100% | -0.012 | 0.000 | 1.0 | 0.000 | -0.013 | 0.000 | 1.1 | 0.147 |
| 100% to 200% | -0.013 | 0.000 | 1.7 | 0.000 | -0.012 | 0.000 | 0.6 | 0.413 |
| 200% to 400% | -0.016 | 0.000 | 1.1 | 0.000 | -0.013 | 0.000 | -1.6 | 0.049 |
| Over 400% | -0.011 | 0.000 | -0.9 | 0.000 | -0.013 | 0.000 | -5.9 | 0.000 |
| Return on assets | ||||||||
| 0 to 5% | -0.017 | 0.000 | 1.7 | 0.000 | -0.025 | 0.000 | 2.4 | 0.002 |
| 5% to 10% | -0.023 | 0.000 | 3.4 | 0.000 | -0.024 | 0.000 | 6.0 | 0.000 |
| 10% to 20% | -0.027 | 0.000 | 3.8 | 0.000 | -0.029 | 0.000 | 6.0 | 0.000 |
| 20% to 60% | -0.026 | 0.000 | 4.7 | 0.000 | -0.026 | 0.000 | 8.4 | 0.000 |
| Over 60% | -0.018 | 0.000 | 4.3 | 0.000 | -0.021 | 0.000 | 9.7 | 0.000 |
| International trader status | ||||||||
| Export only | 0.017 | 0.000 | -0.8 | 0.217 | Note ...: not applicable | Note ...: not applicable | Note ...: not applicable | Note ...: not applicable |
| Import only | -0.002 | 0.038 | 1.9 | 0.000 | Note ...: not applicable | Note ...: not applicable | Note ...: not applicable | Note ...: not applicable |
| Export and import | 0.000 | 0.931 | 1.4 | 0.000 | Note ...: not applicable | Note ...: not applicable | Note ...: not applicable | Note ...: not applicable |
|
... not applicable Note: CEWS refers to the Canada Emergency Wage Subsidy. Sources: Statistics Canada, Canada Emergency Wage Subsidy, Canadian Emergency Business Account, Canada Emergency Commercial Rent Assistance, monthly business openings and closures, T2 Corporate Income Tax, Trade by Exporter Characteristics and Trade by Importer Characteristics. |
||||||||
The signs for the other coefficients are consistent with what was presented in Table 2. Controlling for other characteristics, the probability of being closed still decreases with the employment size of the business. However, the decline is less striking compared with when other characteristics are not taken into account. This reduced impact of each variable on the probability of being closed once other characteristics are taken into account is observed for age, labour productivity, debt-to-asset ratio and current ratio. Finally, the first column of Table 4 also shows that more profitable (higher return on assets) businesses are less likely to be closed than businesses with negative profits.
When other business characteristics are considered, the impact of international trader status changes sign. In Table 2, businesses engaged in trade are less likely to close, but once characteristics such as size and productivity are taken into account, exporters are more likely to close than non-traders. Importers and those that export and import are no more likely to close than non-traders.
The estimated marginal effect of using the CEWS in the combined accommodation and food services and arts, entertainment and recreation sector is also significant. Taking into account pre-pandemic firm characteristics, the marginal effect of using the CEWS on the probability of closure falls from -23.4 percentage points to -18.5 percentage points. The other coefficient estimates for the combined accommodation and food services and arts, entertainment and recreation sector are similar to those for all businesses, but there are some differences. Larger businesses with more employees are less likely to close, but the coefficients are smaller and not always statistically significant. When all businesses are considered, those with 5 to 19 employees are 2.3 percentage points less likely to close than businesses with 1 to 4 employees. For the combined accommodation and food services and arts, entertainment and recreation sector, the corresponding estimate is -0.7 percentage points. While greater employment size—for all businesses—further lowers the probability of closure, businesses with 20 to 99 employees in the combined accommodation and food services and arts, entertainment and recreation sector are as likely to close as those with 1 to 4 employees. Similarly, the effects of business age and labour productivity variables are not as strong as in they are for all businesses. The weaker impact of these covariates may be caused by travel and restrictions on gathering having more widespread effects on these two industries than others. Trader status variables are not reported because goods trade is less relevant for these service industries.
Program usage and employment growth
Table 4 also shows the marginal effect of using the CEWS before October on the employment growth of a business between February and the average of the last three months of 2020. After controlling for pre-pandemic characteristics, the marginal effect of using the CEWS on employment growth increased from 2.5 percentage points to 5.0 percentage points for all businesses. Given that the average employment growth rate over the period is -8.9%, CEWS usage allowed businesses, on average, to mitigate their losses only.
Findings suggest that there are business characteristics related to both employment growth and the probability of using the CEWS. For example, greater firm employment size is related to a higher probability of using the CEWS, but also to lower employment growth (see Table 2). Without controlling for firm size, CEWS usage could be capturing the negative impact firm size has on employment growth.
As in the case of the probit regression on business closure, employment growth rate patterns by business characteristics are reflected in the regression estimates as well. One exception is that the relationship between employment and age becomes U-shaped; previously, employment growth increased with age. Once other characteristics are taken into account, there is greater support for Schumpeter’s theory that younger, more productive firms are more likely to grow. Another exception is for international trader status—in the summary statistics, non-traders have the lowest growth rates. Once other firm characteristics are taken into account, exporters have lower growth than non-traders, though the difference is not statistically significant. Importers and those that export and import continue to have higher growth. Finally, as expected, the regression analysis also shows that employment growth rises with the pre-pandemic profitability of a firm.
For the combined accommodation and food services and arts, entertainment and recreation sector, the marginal effect of using the CEWS on employment growth also becomes stronger when pre-pandemic characteristics are taken into account. The employment growth rate of businesses that used the CEWS is 13.6 percentage points higher than for those that did not use it, once pre-pandemic characteristics are taken into account. This is compared with a difference of only 0.6 percentage points when other factors are not considered, shown in Table 3. For the combined accommodation and food services and arts, entertainment and recreation sector, the impact of considering business characteristics (change from 0.6 to 13.6 percentage points) is much larger than for all businesses (change from 2.5 to 5.0 percentage points). This could be caused by the relationship between these characteristics and employment growth being stronger in the combined accommodation and food services and arts, entertainment and recreation sector. For example, businesses in the combined accommodation and food services and arts, entertainment and recreation sector with 100 or more employees had employment growth rates that were -61.5 percentage points lower than businesses with 1 to 4 employees, compared with -19.6 percentage points for all businesses. Therefore, it was more important to consider characteristics such as firm size.
Heterogeneity in the marginal effects of the Canada Emergency Wage Subsidy
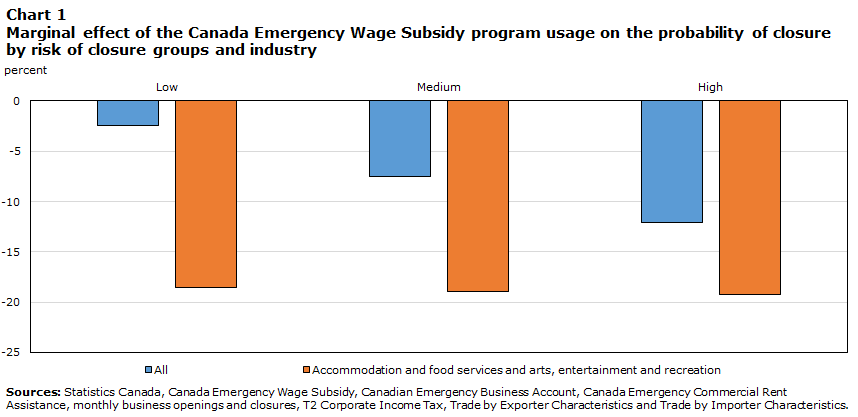
The impact of the CEWS could differ not only by industry, but also by other business characteristics. To summarize this potential heterogeneity, this paper looks at the marginal effects of the CEWS by risk of closure, where risk of closure is based on the pre-pandemic characteristics of the firm. To place businesses in risk-of-closure categories, the probit regression in (1) was estimated without the CEWS, CEBA, and CECRA variables. The predicted probability of closure was then estimated for each firm. Firms in the lowest three predicted probability-of-closure deciles were placed in the low risk category, while firms in the highest three predicted probability-of-closure deciles were placed in the high risk category. Firms with predicted risk of closures that fall within the middle deciles were placed in the medium risk category. Entrants in 2019, smaller businesses, less productive businesses, and businesses with less liquidity, greater indebtedness, few assets and lower profitability tended to be in the higher risk category.
Chart 1 shows that the marginal effects of the CEWS on probability of closure for all businesses are smallest for the category for low risk of closure. Controlling for observable firm characteristics, CEWS usage reduced the probability of closure by 2.4 percentage points for firms with a low risk of closure, 7.5 percentage points for those with a medium risk of closure and 12.1 percentage points for those with a high risk of closure. By contrast, the marginal effects of the CEWS on probability of closure for businesses in the combined accommodation and food services and arts, entertainment and recreation sector was strong across all risk-of-closure groups, being only slightly stronger for the category for higher risk of closure. Controlling for observable firm characteristics, CEWS usage in the combined accommodation and food services and arts, entertainment and recreation sector reduced the probability of closure by 18.5 percentage points for firms with a low risk of closure, 18.9 percentage points for those with a medium risk of closure and 19.2 percentage points for those with a high risk of closure.
Data table for Chart 1
| All | Accommodation and food services and arts, entertainment and recreation | |
|---|---|---|
| percent | ||
| Low | -2.4 | -18.5 |
| Medium | -7.5 | -18.9 |
| High | -12.1 | -19.2 |
| Sources: Statistics Canada, Canada Emergency Wage Subsidy, Canadian Emergency Business Account, Canada Emergency Commercial Rent Assistance, monthly business openings and closures, T2 Corporate Income Tax, Trade by Exporter Characteristics and Trade by Importer Characteristics. | ||
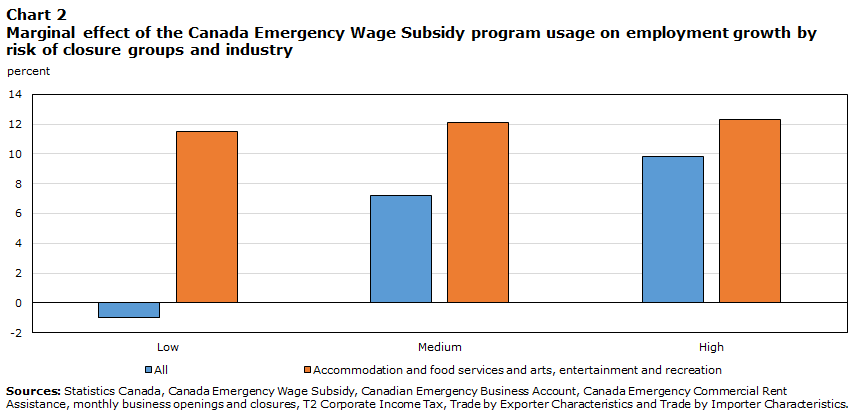
Chart 2 shows that the marginal effect of the CEWS on employment growth for all businesses is also strongest for firms with a high risk of closure. Controlling for observable firm characteristics, CEWS usage increased the employment growth of high-risk firms by 9.8 percentage points, compared with 7.2 percentage points for medium risk businesses, and -1.7 percentage points for low risk businesses. Again, the marginal effect of the CEWS in the combined accommodation and food services and arts, entertainment and recreation sector was uniformly strong across all risk-of-closure groups. The estimated effect of using the CEWS on employment growth was 11.5, 12.1 and 12.3 percentage points for the low, medium and high risk-of-closure groups, respectively.
Data table for Chart 2
| All | Accommodation and food services and arts, entertainment and recreation | |
|---|---|---|
| percent | ||
| Low | -1.0 | 11.5 |
| Medium | 7.2 | 12.1 |
| High | 9.8 | 12.3 |
| Sources: Statistics Canada, Canada Emergency Wage Subsidy, Canadian Emergency Business Account, Canada Emergency Commercial Rent Assistance, monthly business openings and closures, T2 Corporate Income Tax, Trade by Exporter Characteristics and Trade by Importer Characteristics. | ||
Endogeneity of program usage
As discussed in the Methodology section, program usage is endogenous and the unobserved firm-specific shocks that cause a business to use a program or not is likely correlated with business survival and growth. To account for endogeneity, the equations were jointly estimated,Note Note and the results are in tables 5 and 6. Overall, accounting for endogeneity confirms the qualitative results from when equation (1) and (2) are estimated separately. For most cases, the marginal effects of program usage on the probability of being closedNote and employment growth still have the expected sign and are statistically significant. The marginal effects of the CEWS for all businesses are smaller than for businesses in accommodation and food service and arts, entertainment and recreation.
Table 5 shows that when endogeneity is taken into account, the marginal effect that using the CEWS has on the probability of closure decreases for all businesses, from -6.9 percentage points to -10.4 percentage points. Table 6, which shows the estimated correlation between error terms in the equation, sheds light on why this occurs. The correlation in the error term in the probability of closure probit and the probability of using the CEWS is 0.235. Even if there was no relationship between CEWS usage and the probability of closure, the positive correlation in the error term would cause an upward bias on the estimate of the marginal effect of the CEWS on the probability of being closed. When that upward bias is taken into account by the joint estimation, the estimated marginal effect falls from -6.9 to -10.4.
| P (Closed = 1) | Employment growth (%) | |||
|---|---|---|---|---|
| marginal effect | p-value | coef. | p-value | |
| All | -0.104 | 0.000 | 10.0 | 0.000 |
| Accommodation and food services and arts, entertainment and recreation | -0.179 | 0.000 | 22.7 | 0.000 |
| Sources: Statistics Canada, Canada Emergency Wage Subsidy, Canadian Emergency Business Account, Canada Emergency Commercial Rent Assistance, monthly business openings and closures, T2 Corporate Income Tax, Trade by Exporter Characteristics and Trade by Importer Characteristics. | ||||
In the case of the combined accommodation and food services and arts, entertainment and recreation sector, the correlation between the probability of closure probit and the probability of using the CEWS equation is -0.106. Thus, taking into account the correlation of the error terms would have the opposite effect than that observed for all businesses. Indeed, the marginal effect of using the CEWS on the probability of closure increases for this sector, rising from -18.5 percentage points to -17.9 percentage points.
Table 6 also shows that the error term in the probability of using the CEWS and employment growth is negatively correlated for all businesses as well as the combined accommodation and food services and arts, entertainment and recreation sector. This implies that the marginal effects of the CEWS on employment had downward bias when the employment growth equation was estimated separately for all businesses and for the combined accommodation and food services and arts, entertainment and recreation sector. When the employment growth equation is jointly estimated with the other equations, the marginal effect of using the CEWS rises from 5.0 to 10.0 for all businesses, and from 13.6 to 22.7 for the combined accommodation and food services and arts, entertainment and recreation sector.
| P(Closed=1) | Employment growth | |
|---|---|---|
| percent | ||
| All | 0.235 | -0.084 |
| Accommodation and food services and arts, entertainment and recreation | -0.106 | -0.132 |
| Sources: Statistics Canada, Canada Emergency Wage Subsidy, Canadian Emergency Business Account, Canada Emergency Commercial Rent Assistance, monthly business openings and closures, T2 Corporate Income Tax, Trade by Exporter Characteristics and Trade by Importer Characteristics. | ||
While joint estimation helps to address the endogeneity issue, these estimates can be biased themselves if the model is not correctly specified. They do, however, guide to the direction of the bias of the separately estimated equations. For all businesses, the joint estimation suggests that the marginal effects of the CEWS on probability of closure and employment growth—when estimated separately—are lower bound estimates, as is the marginal effect of the CEWS on employment growth for the combined accommodation and food services and arts, entertainment and recreation sector. On the other hand, for the combined accommodation and food services and arts, entertainment and recreation sector, the marginal effect of the CEWS on probability of closure is an upper bound estimate when estimated separately.
Conclusion
The article presents evidence on the strength of the relationships between CEWS usage and business survival and employment growth. By and large, the results are as expected. CEWS usage is correlated with a lower probability of closure and higher (less negative) employment growth. The correlation is stronger in the combined accommodation and food services and arts, entertainment and recreation sector that was affected more directly by travel and social distancing restrictions than for all businesses. Firms that had a higher risk of closure (entrants in 2019, smaller, less productive firms, and those with less liquidity, greater indebtedness, few assets and lower profitability) also demonstrated a greater benefit from using the CEWS.
Despite adopting an econometric technique to take into account endogeneity, this study does not claim to have resolved the issue. The appropriateness of joint estimation depends on the correctness of the model specification and the validity of the instruments. In the end, it is difficult to find a variable that causes a business to use a program, but does not have an impact on its survival or growth. If the revenue drop of a business could be observed, it would be possible to use the eligibility threshold to identify the impact of the CEWS, but monthly revenue data are not available. The T2 corporate tax data used in this paper are annual, and small firms do not need to file GST monthly. For the CEBA, it may be possible to use the payroll and non-deferrable expenses criteria to identify the impact, but the detailed data on non-deferrable expenses are not mandatory items in the financial statements included in the T2 corporate tax filings. Therefore, use of these thresholds to identify the impacts are left to future work.
Also left to further study is a comparison of the relative effectiveness of the programs. The sample of all employer businesses used in this study includes many larger firms that were not eligible for the CEBA and many firms without significant rental expenses that could have used CECRA. Future work could focus on a sample of firms that could be eligible for all three programs to provide a comparison across programs.
References
Baldwin, J.R., & Gorecki, P. (1995). The Dynamics of Industrial Competition. Cambridge University Press.
Baldwin, J.R., & Yan, B. (2014). Global value chains and the productivity of Canadian manufacturing firms. (Economic Analysis Research Paper Series, No. 90). Statistics Canada Catalogue No. 11F0027M. Statistics Canada.
Barlevy, G. (2003). Credit market frictions and the allocation of resources over the business cycle. Journal of Monetary Economics, 50(8), 1795–1818.
Bosio, E., Djankov, S., Jolevski, F., & Ramalho, R. (2020). Survival of Firms During Economic Crisis. Policy Research Working Paper 9239. World Bank Group.
Davis, S.J., & Haltiwanger, J. (1992). Gross job creation, gross job destruction, and employment reallocation. The Quarterly Journal of Economics, 107(3), 819–863.
Department of Finance. (2021). Budget 2021: A Recovery Plan for Jobs, Growth and Resilience. Department of Finance Catalogue No. F1-23/3E-PDF. https://www.canada.ca/en/department-finance.html.
Hubbard, G., & Strain, M. R. (2020, September 24). Has the Paycheck Protection Program Succeeded? Brookings Papers on Economic Activity. (BPEA Conference Drafts). https://www.brookings.edu/wp-content/uploads/2020/09/Hubbard-Strain-et-al-conference-draft.pdf
Lafrance-Cooke, A. (2021). Changes in employment by businesses during the COVID-19 pandemic: New insights on the experimental series of monthly business openings and closures. Economic and Social Reports 1(3). Statistics Canada Catalogue No. 36-28-0001.
Lafrance-Cooke, A., Macdonald, R., & Willox, M. (2020). Monthly business openings and closures: Experimental series for Canada, the provinces and territories, and census metropolitan areas. (Economic Insights, No. 116). Statistics Canada Catalogue no. 11-626-X. https://www150.statcan.gc.ca/n1/pub/11-626-x/11-626-x2020014-eng.htm.
Leung, D. (2021). Characteristics of businesses that have closed during the COVID-19 pandemic in 2020. Economic and Social Reports, 1(3). Statistics Canada Catalogue No. 36-28-0001. Statistics Canada.
Liu, H., Willox, M., & Lu, Y. (2021). Utilization of the Canada Emergency Wage Subsidy Program by employer businesses in 2020. Economic and Social Reports, vol. 1, no. 6. Statistics Canada Catalogue No. 36-28-0001. Statistics Canada.
Roodman, D. (2011). Fitting fully observed recursive mixed-process models with cmp. The Stata Journal, 11(2) 159–206.
Tam, S., Sood, S., & Johnston. C. (2020). Impact of COVID-19 on small businesses in Canada, third uarter 2020. StatCan COVID-19: Data to Insights for a Better Canada. Statistics Canada Catalogue No. 452800001.
Wang, W. (2020). Canada’s Oil and Gas Sector: The Decline in Production and Investment and the Impact on the Economy. StatCan COVID-19: Data to Insights for a Better Canada. Statistics Canada Catalogue No. 452800001.
Wang, W. (2021). Canada’s Oil and Gas Sector One Year After the Start of the Pandemic. Economic and Social Reports, vol. 1, no. 7. Statistics Canada Catalogue No. 36-28-0001. Statistics Canada
- Date modified: