
Economic Insights
Monthly Business Openings and Closures: Experimental Series for Canada, the Provinces and Territories, and Census Metropolitan Areas

Archived Content
Information identified as archived is provided for reference, research or recordkeeping purposes. It is not subject to the Government of Canada Web Standards and has not been altered or updated since it was archived. Please "contact us" to request a format other than those available.
Correction Notice
The column labelled April 2019 in Table 2 for active businesses and opening businesses contained March 2019 numbers. This also affects the first row of Table 3, same groups, for Canada only. The tables have been updated using the April 2019 numbers.
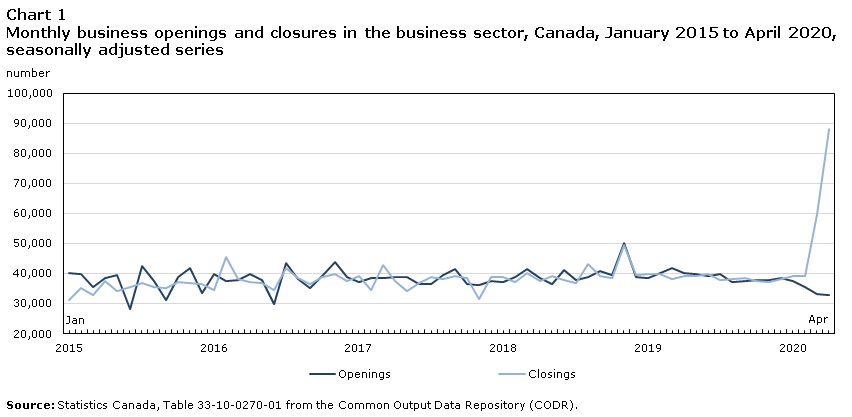
This article in the Economic Insights series presents monthly estimates of the number of business openings and closures, continuing businesses, and active businesses from January 2015 to April 2020. The estimates for businesses with employees are available for Canada, the provinces and territories, and census metropolitan areas. Where possible, industry information based on two-digit North American Industry Classification Systems codes are also presented. A business closure is defined as a firm that had employment in the previous month, but no employment in the current month. The closure may be temporary or permanent. Since January 2015, an average of approximately 39,000 businesses have closed each month in the Canadian business sector. More than twice that number, 88,187, was observed in April 2020.
The onset of the COVID-19 pandemic in March 2020 led to restrictions on economic activity. These restrictions led to widespread business closures in affected areas, with retail trade, accommodation and food services industries being the most affected. The reopening of businesses will have important implications for the speed and breadth of the economic recovery from COVID-19.
These experimental estimates on monthly openings and closures supplement the annual and quarterly data that Statistics Canada produces on business entry and exit. While data on openings and closures are timelier, they are conceptually different from the data on entry and exit. Whereas a business can close and reopen within a year, a business can only exit or enter once. The concept of entry and exit aims to capture permanent rather than transitory changes.
For example, to be classified as a closing business in March 2020, a business must have paid employment in February 2020 but no paid employment in March 2020. To be classified as an exit in the first quarter of 2020, the business must not have paid employment in any of the subsequent quarters in 2020, nor in any quarter of 2021. Similarly, to be classified as an opening business in March 2020, a business must have paid employment in March 2020 but no paid employment in February 2020. In contrast, to be an entrant in the first quarter of 2020, the business must have paid employment in that quarter and no paid employment in any of the quarters in the previous year.
The COVID-19 pandemic has highlighted the need for both types of information. There is a need to know how many businesses have been immediately impacted by the COVID-19 shutdown and to track how many are reopening. The new experimental data on openings and closures address this gap. However, there is also a need to know how many of these closures are permanent (and are therefore exits) and how many new entrants there are to replace those permanent closures, as this will inform the longer-term impact of the pandemic.
The results show that the COVID-19 pandemic has led to a significant increase in business closures and a decrease in business openings. In April 2020, 88,187 business closures were observed, more than twice the level observed in April 2019. The increase in business closures was widespread across the provinces and territories, but was particularly high in Ontario and Quebec. The most affected industries were accommodation and food services, other services (excluding public administration) and retail trade, where business closures more than doubled relative to one year ago. Business openings declined in April, but not to the same degree as the increase in closures in the same month. There were 32,803 business openings in April 2020, a decrease of 18.3% compared to April 2019.
Defining and measuring short term business dynamics
Measuring short-term business dynamics requires a set of definitions for recognizing sub-annual changes in firm activity and a data source that provides numerical estimates based on those definitions.
The basic measures of short-term business dynamics are monthly counts of openings, closures, continuing and active businesses. Openings are defined as businesses with employment in the current month and no employment in the previous month, while closures are defined as businesses that had employment in the previous month, but no employment in the current month (Table 1). Continuing businesses are those that have employees in both months, and the active population in any given month is the number of opening and continuing businesses in that month.
| Last month (example: March 2020) | This month (example: April 2020) | Timing of business dynamics | |
|---|---|---|---|
| Opening | No employees | Has employees | Opened in April 2020 |
| Closing | Has employees | No employees | Closed in April 2020 |
| Continuing | Has employees | Has employees | Continuing in April 2020 |
| Active | Note ...: not applicable | Sum of opening and continuing | Active in April 2020 |
|
... not applicable Source: Statistics Canada, Authors' compilation. |
|||
The PD7 payroll deduction files from the Canada Revenue Agency and the Business Register are the data sources for the estimates. The PD7 files provide the number of employees for each employer in Canada. These administrative records are linked to enterprises and establishments in the Business Register to obtain industry and geographical informationNote .
Businesses can change geography and industry over time. To reduce the volatility in the estimates due to changes in industry or geographical indicators and to focus on genuine openings and closures associated with changes in economic activity, the industry and geographical classification of a business is held constant for a period of time. For example, for the 2015 estimates, the industry and geographical estimates will be held fixed from December 2014 to January 2016.
While the vast majority of enterprises have operations in a single geographical area and in a single industry, large enterprise can have activities in multiple industries and multiple geographical areas. The activity of a large enterprise in a particular geography/industry can be an important contributor to that geography/industry even if it represents only a small part of that enterprise’s activities. To reflect the complex nature of these large enterprises and their impact across industries and geographies, they are allowed to contribute to the counts multiple times.
To illustrate, consider the following example at the national level. If a large retailer also has wholesaling establishments, then it would count as one active business in the Canadian retail industry, and one active business in the Canadian wholesale industry. If the enterprise closed its operations in wholesale, but not in retail, it would count as a closure in the wholesale trade industry and an active business in retail trade.
This concept also applies at the provincial level and below. If an enterprise has operations in two provinces, then it would contribute to counts in both of those provinces. Depending on whether the enterprise had establishments in multiple industries in those provinces, it could contribute more than one in a province.
While the treatment of complex enterprises described above has benefits, it also creates a challenge for aggregation because it essentially treats all geography-industry combinations as distinct groups, and tries to gauge how many businesses are active within each one. As a result, the sum of the disaggregated data will be greater than the published data for the higher level aggregation. The resulting estimates are, therefore, appropriate for examining business dynamics over time within and across industry-geography groups, but analysis that rests on measures designed to work within an aggregation scheme, such as contributions to growth or share analysis, needs to be undertaken with caution.
Recent patterns in monthly business openings and closures
Steep increase in business closures in the Canadian business sector in April 2020
Business closures occur for various reasons, such as a lack of cash flow or financing to sustain the business, and competition which can drive out weaker businesses. Since the beginning of the monthly openings and closings series in 2015, on average, about 39,000 businesses have closed in Canada on a monthly basis in the business sector. In April 2020, 88,187 businesses closed (Table 2), a level that has not been observed since the beginning of the series and more than double the level of closures observed in April 2019 (Chart 1). The large number of business closures in April 2020 reflect the impact of the COVID-19 pandemic, which forced many businesses to shut down their operations. Notably, closures have increased since November 2019, which may also be attributed to events earlier in 2020, including the steep decline in oil prices and the rail blockades. These earlier events may have also contributed to the elevated level of closures later in the year.
Business openings in the Canadian business sector also decreased since December 2019, which may have been due to a drop in business confidence surrounding news of the global pandemic, and thus a lower desire to start a new business.
Data table for Chart 1
| Date | Opening | Closing |
|---|---|---|
| number | ||
| 2015 | ||
| January | 40,179 | 31,164 |
| February | 39,672 | 35,262 |
| March | 35,565 | 32,962 |
| April | 38,551 | 37,490 |
| May | 39,562 | 34,292 |
| June | 28,096 | 35,565 |
| July | 42,533 | 36,755 |
| August | 37,587 | 35,629 |
| September | 31,217 | 35,033 |
| October | 38,822 | 37,305 |
| November | 41,658 | 36,665 |
| December | 33,552 | 36,591 |
| 2016 | ||
| January | 39,866 | 34,413 |
| February | 37,501 | 45,369 |
| March | 37,736 | 38,025 |
| April | 39,947 | 37,055 |
| May | 37,876 | 36,783 |
| June | 29,805 | 34,374 |
| July | 43,587 | 41,952 |
| August | 38,119 | 38,375 |
| September | 35,028 | 36,583 |
| October | 38,976 | 38,729 |
| November | 43,913 | 39,914 |
| December | 38,934 | 37,517 |
| 2017 | ||
| January | 37,154 | 39,012 |
| February | 38,320 | 34,551 |
| March | 38,563 | 42,688 |
| April | 38,773 | 37,465 |
| May | 38,890 | 34,090 |
| June | 36,567 | 36,771 |
| July | 36,421 | 38,854 |
| August | 39,448 | 38,159 |
| September | 41,344 | 39,294 |
| October | 36,498 | 38,361 |
| November | 36,288 | 31,652 |
| December | 37,348 | 38,701 |
| 2018 | ||
| January | 36,991 | 38,917 |
| February | 38,909 | 37,063 |
| March | 41,359 | 40,018 |
| April | 38,373 | 37,532 |
| May | 36,561 | 39,224 |
| June | 41,089 | 37,958 |
| July | 37,829 | 36,735 |
| August | 38,868 | 43,205 |
| September | 40,933 | 39,235 |
| October | 39,498 | 38,548 |
| November | 50,216 | 49,297 |
| December | 38,672 | 39,545 |
| 2019 | ||
| January | 38,549 | 39,754 |
| February | 39,990 | 39,948 |
| March | 41,930 | 38,219 |
| April | 40,136 | 39,078 |
| May | 39,655 | 38,992 |
| June | 39,042 | 39,791 |
| July | 39,865 | 37,826 |
| August | 37,247 | 38,051 |
| September | 37,549 | 38,552 |
| October | 37,687 | 37,576 |
| November | 37,838 | 37,226 |
| December | 38,330 | 38,149 |
| 2020 | ||
| January | 37,607 | 39,008 |
| February | 35,397 | 39,104 |
| March | 33,002 | 59,869 |
| April | 32,803 | 88,187 |
| Source: Statistics Canada, Table 33-10-0270-01 from the Common Output Data Repository (CODR). | ||
Business closures more than triple in accommodation and food services compared to one year earlier
The number of business closures increased in April 2020 in all industries, and some industries had significantly more business closures than the average. The largest increases in business closures from April 2019 to April 2020 occurred in accommodation and food services (6,719 or 274.1%), followed by other services (6,814 or 264.3%) and retail trade (6,133 or 217.7%) (Chart 2). In contrast, finance and insurance and management of companies and mining, quarrying, oil and gas extraction had the lowest year-on-year growth rates in closures, which increased by 38.9 percent and 47.6 percent, respectively.
It is possible that the COVID-19 pandemic had a substantial negative impact on accommodation and food services, other services (which includes personal services and religious organizations) and retail trade as they are not considered “essential” industries, and were not permitted to operate. Moreover, in many instances, employees in these industries do not have the option to work from home. As mentioned, the finance and insurance and management of companies saw the lowest drop in business closures (on a year-over-year percentage growth basis), which may partly be explained by greater opportunities of employees in that industry to work from home during the pandemic.
Compared with April 2020, business openings decreased in all industries. However, the drop in business openings was not as substantial as the increase in business closures. For instance, in accommodation and food services, the number of business openings decreased by about 400 businesses (or 17.8%).

Data table for Chart 2
| Accomodation and food services | Other services (except public administration) | Retail trade | |
|---|---|---|---|
| number | |||
| 2015 | |||
| January | 2,376 | 2,260 | 2,518 |
| February | 2,248 | 2,242 | 2,627 |
| March | 2,309 | 2,239 | 2,577 |
| April | 2,415 | 2,420 | 2,802 |
| May | 2,279 | 2,332 | 2,677 |
| June | 2,304 | 2,368 | 2,669 |
| July | 2,334 | 2,371 | 2,693 |
| August | 2,244 | 2,199 | 2,604 |
| September | 2,236 | 2,386 | 2,622 |
| October | 2,397 | 2,538 | 2,719 |
| November | 2,572 | 2,834 | 2,854 |
| December | 2,412 | 2,519 | 2,806 |
| 2016 | |||
| January | 2,243 | 2,205 | 2,570 |
| February | 2,365 | 2,726 | 2,813 |
| March | 2,395 | 2,565 | 2,901 |
| April | 2,332 | 2,407 | 2,650 |
| May | 2,362 | 2,388 | 2,615 |
| June | 2,251 | 2,441 | 2,769 |
| July | 2,417 | 2,650 | 2,833 |
| August | 2,254 | 2,435 | 2,728 |
| September | 2,335 | 2,533 | 2,686 |
| October | 2,322 | 2,458 | 2,767 |
| November | 2,397 | 2,640 | 2,900 |
| December | 2,244 | 2,396 | 2,666 |
| 2017 | |||
| January | 2,300 | 2,463 | 2,705 |
| February | 2,308 | 2,317 | 2,361 |
| March | 2,547 | 2,788 | 3,166 |
| April | 2,298 | 2,443 | 2,763 |
| May | 2,268 | 2,210 | 2,501 |
| June | 2,405 | 2,394 | 2,687 |
| July | 2,374 | 2,466 | 2,757 |
| August | 2,442 | 2,501 | 2,789 |
| September | 2,362 | 2,488 | 2,769 |
| October | 2,360 | 2,459 | 2,804 |
| November | 2,233 | 2,319 | 2,560 |
| December | 2,373 | 2,423 | 2,833 |
| 2018 | |||
| January | 2,369 | 2,335 | 2,872 |
| February | 2,298 | 2,444 | 2,678 |
| March | 2,361 | 2,475 | 2,730 |
| April | 2,314 | 2,414 | 2,736 |
| May | 2,386 | 2,526 | 3,018 |
| June | 2,492 | 2,591 | 2,820 |
| July | 2,220 | 2,257 | 2,609 |
| August | 2,540 | 2,580 | 3,108 |
| September | 2,450 | 2,600 | 2,810 |
| October | 2,422 | 2,453 | 2,752 |
| November | 2,387 | 2,491 | 2,781 |
| December | 2,567 | 2,686 | 2,791 |
| 2019 | |||
| January | 2,405 | 2,741 | 2,940 |
| February | 2,445 | 2,606 | 2,898 |
| March | 2,364 | 2,460 | 2,731 |
| April | 2,452 | 2,578 | 2,818 |
| May | 2,464 | 2,663 | 2,920 |
| June | 2,320 | 2,501 | 2,804 |
| July | 2,294 | 2,382 | 2,733 |
| August | 2,320 | 2,464 | 2,763 |
| September | 2,379 | 2,383 | 2,868 |
| October | 2,339 | 2,505 | 2,755 |
| November | 2,424 | 2,525 | 2,773 |
| December | 2,301 | 2,430 | 2,752 |
| 2020 | |||
| January | 2,416 | 2,515 | 2,695 |
| February | 2,498 | 2,823 | 2,785 |
| March | 5,530 | 5,003 | 5,149 |
| April | 9,171 | 9,392 | 8,951 |
| Source: Statistics Canada, Table 33-10-0270-01 from the Common Output Data Repository (CODR). | |||
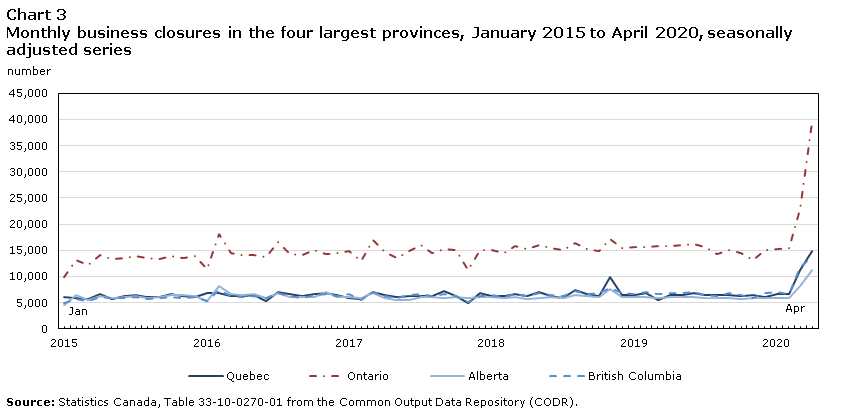
Business closures were widespread across provinces and territories in April 2020
Compared with April 2019, many provinces and territories saw a doubling of business closures. The largest increases in percentage terms occurred in Ontario (149.7%) (Chart 3), Quebec (134.6%) and Nova Scotia (127.7%) (Table 3).
Not surprisingly, the industry patterns of business closures in April 2020 at the national level are generally reflected across the provinces and territories, albeit to varying degrees. Business closures in other services and in accommodation and food services quadrupled in Ontario and tripled in Quebec from April 2019 to April 2020. In contrast, closures in finance and insurance and management of companies increased by only 17 percent in British Columbia and by 18 percent in Alberta.
Business openings decreased in in all provinces and territories, except in the Northwest Territories (Table 3). On a year-over-year growth rate basis, the decline in business openings was fairly similar across the country, ranging from a decline of 1,326 (21.2%) business openings in Quebec and 3,981 (24.3%) in Ontario to 79 (1.2%) in British Columbia.
Data table for Chart 3
| Date | Quebec | Ontario | Alberta | British Columbia |
|---|---|---|---|---|
| number | ||||
| 2015 | ||||
| January | 6,032 | 9,916 | 4,503 | 4,928 |
| February | 5,859 | 13,185 | 6,398 | 5,604 |
| March | 5,702 | 12,178 | 5,585 | 5,384 |
| April | 6,600 | 14,168 | 6,264 | 6,040 |
| May | 5,710 | 13,258 | 5,928 | 5,882 |
| June | 6,194 | 13,591 | 6,041 | 5,960 |
| July | 6,385 | 13,903 | 6,310 | 5,998 |
| August | 5,980 | 13,437 | 5,881 | 5,745 |
| September | 6,106 | 13,296 | 6,084 | 5,892 |
| October | 6,624 | 13,965 | 6,367 | 6,035 |
| November | 6,265 | 13,532 | 6,431 | 5,905 |
| December | 6,047 | 13,989 | 6,160 | 6,098 |
| 2016 | ||||
| January | 6,863 | 11,326 | 5,302 | 5,281 |
| February | 6,743 | 18,074 | 8,220 | 7,371 |
| March | 6,275 | 14,498 | 6,551 | 6,228 |
| April | 6,198 | 14,030 | 6,399 | 6,080 |
| May | 6,407 | 14,084 | 6,555 | 6,196 |
| June | 5,380 | 13,762 | 5,815 | 5,792 |
| July | 6,950 | 16,507 | 6,910 | 6,891 |
| August | 6,639 | 14,236 | 6,154 | 6,339 |
| September | 6,283 | 14,124 | 6,152 | 5,967 |
| October | 6,580 | 15,126 | 6,104 | 6,522 |
| November | 6,824 | 14,252 | 6,946 | 6,623 |
| December | 6,396 | 14,438 | 5,980 | 6,330 |
| 2017 | ||||
| January | 5,875 | 14,918 | 6,000 | 6,556 |
| February | 5,696 | 12,992 | 5,820 | 5,583 |
| March | 7,027 | 16,884 | 6,836 | 7,034 |
| April | 6,382 | 14,615 | 5,866 | 6,288 |
| May | 6,078 | 13,484 | 5,453 | 5,843 |
| June | 6,341 | 14,806 | 5,584 | 6,376 |
| July | 6,162 | 16,066 | 6,013 | 6,595 |
| August | 6,220 | 14,541 | 6,017 | 6,274 |
| September | 7,210 | 15,180 | 5,889 | 6,562 |
| October | 6,291 | 15,023 | 6,037 | 6,298 |
| November | 4,910 | 11,265 | 5,791 | 5,057 |
| December | 6,817 | 15,023 | 6,044 | 6,334 |
| 2018 | ||||
| January | 6,293 | 15,064 | 6,028 | 6,379 |
| February | 6,263 | 14,479 | 5,891 | 6,131 |
| March | 6,637 | 15,896 | 6,070 | 6,676 |
| April | 6,196 | 15,235 | 5,743 | 6,206 |
| May | 6,941 | 15,917 | 5,952 | 6,738 |
| June | 6,253 | 15,524 | 6,121 | 6,449 |
| July | 5,946 | 15,031 | 5,873 | 6,295 |
| August | 7,467 | 16,371 | 6,363 | 7,119 |
| September | 6,641 | 15,239 | 6,189 | 6,689 |
| October | 6,206 | 14,911 | 6,024 | 6,809 |
| November | 9,978 | 17,066 | 7,646 | 7,794 |
| December | 6,504 | 15,434 | 6,148 | 6,784 |
| 2019 | ||||
| January | 6,492 | 15,703 | 6,090 | 6,692 |
| February | 6,830 | 15,669 | 6,035 | 7,010 |
| March | 5,487 | 15,784 | 5,958 | 6,687 |
| April | 6,374 | 15,804 | 6,040 | 6,793 |
| May | 6,494 | 15,945 | 6,083 | 6,875 |
| June | 6,743 | 16,158 | 6,071 | 7,113 |
| July | 6,433 | 15,569 | 5,805 | 6,520 |
| August | 6,382 | 14,238 | 5,795 | 6,169 |
| September | 6,474 | 14,980 | 5,879 | 6,778 |
| October | 6,306 | 14,572 | 5,766 | 6,369 |
| November | 6,541 | 13,140 | 5,891 | 5,936 |
| December | 6,034 | 14,976 | 5,815 | 6,736 |
| 2020 | ||||
| January | 6,680 | 15,167 | 5,844 | 6,927 |
| February | 6,689 | 15,479 | 5,923 | 6,710 |
| March | 11,148 | 22,845 | 8,183 | 11,847 |
| April | 14,953 | 39,463 | 11,308 | 13,715 |
| Source: Statistics Canada, Table 33-10-0270-01 from the Common Output Data Repository (CODR). | ||||
A sharp increase in business closures was also recorded in Canada’s three largest census metropolitan areas (CMAs) in April 2020 compared to one year earlier. The largest increase is observed in Toronto (13,771 or 154.6%), followed by Montréal (4,812 or 139.9%) and Vancouver (3,655 or 92.6%). Over the same period, business openings decreased at a similar rate across the three CMAs, ranging from 12.4 percent in Vancouver to 23.1 percent in Toronto.
| Business openings | Business closures | Active businesses | ||||||||||
|---|---|---|---|---|---|---|---|---|---|---|---|---|
| April 2019 | Apr-20 | Change from April 2019 to April 2020 | Change from April 2019 to April 2020 | Apr-19 | Apr-20 | Change from April 2019 to April 2020 | Change from April 2019 to April 2020 | Apr-19 | Apr-20 | Change from April 2019 to April 2020 | Change from April 2019 to April 2020 | |
| number | number | number | percent | number | number | number | percent | number | number | number | percent | |
| Business sector | 40,136 | 32,803 | 7,333 | -18.3 | 39,078 | 88,187 | 49,109 | 125.7 | 798,379 | 711,472 | -86,907 | -10.9 |
| Agriculture, forestry, fishing and hunting | 311 | 253 | -58 | -18.6 | 282 | 441 | 159 | 56.3 | 4,768 | 4,274 | -495 | -10.4 |
| Mining, quarrying, oil and gas extraction | 279 | 235 | -44 | -15.8 | 282 | 416 | 134 | 47.6 | 6,057 | 5,416 | -640 | -10.6 |
| Utilities | 34 | 19 | -15 | -43.9 | 22 | 35 | 13 | 57.1 | 728 | 673 | -55 | -7.6 |
| Construction | 5,954 | 3,971 | -1,982 | -33.3 | 6,160 | 12,837 | 6,677 | 108.4 | 117,476 | 103,713 | -13,763 | -11.7 |
| Manufacturing | 1,116 | 914 | -202 | -18.1 | 1,157 | 3,178 | 2,021 | 174.7 | 42,582 | 38,903 | -3,679 | -8.6 |
| Wholesale trade | 1,074 | 858 | -215 | -20.0 | 1,141 | 2,672 | 1,531 | 134.2 | 39,521 | 35,807 | -3,714 | -9.4 |
| Retail trade | 2,715 | 2,266 | -449 | -16.5 | 2,818 | 8,951 | 6,133 | 217.7 | 86,279 | 75,503 | -10,776 | -12.5 |
| Transportation and warehousing | 3,103 | 2,586 | -517 | -16.7 | 3,107 | 5,511 | 2,405 | 77.4 | 51,165 | 45,412 | -5,753 | -11.2 |
| Information and cultural industries | 497 | 405 | -92 | -18.5 | 479 | 918 | 439 | 91.7 | 10,142 | 9,323 | -819 | -8.1 |
| Real estate and rental and leasing | 2,176 | 1,826 | -350 | -16.1 | 2,268 | 4,145 | 1,877 | 82.8 | 40,278 | 36,064 | -4,214 | -10.5 |
| Professional, scientific and technical services | 5,963 | 5,847 | -117 | -2.0 | 5,914 | 9,739 | 3,825 | 64.7 | 114,287 | 108,512 | -5,775 | -5.1 |
| Administrative and support, waste management and remediation services | 2,137 | 1,475 | -662 | -31.0 | 2,030 | 3,999 | 1,969 | 97.0 | 39,910 | 35,951 | -3,959 | -9.9 |
| Finance and insurance and Management of companies and enterprises | 1,420 | 1,277 | -144 | -10.1 | 1,458 | 2,025 | 567 | 38.9 | 27,830 | 26,261 | -1,569 | -5.6 |
| Arts, entertainment and recreation | 821 | 543 | -278 | -33.9 | 779 | 1,855 | 1,075 | 138.0 | 14,425 | 12,652 | -1,773 | -12.3 |
| Accomodation and food services | 2,350 | 1,933 | -417 | -17.8 | 2,452 | 9,171 | 6,719 | 274.1 | 62,567 | 51,796 | -10,770 | -17.2 |
| Other services (except public administration) | 2,611 | 2,105 | -507 | -19.4 | 2,578 | 9,392 | 6,814 | 264.3 | 72,829 | 61,776 | -11,054 | -15.2 |
| Unclassified industries | 7,355 | 5,016 | -2,339 | -31.8 | 7,009 | 13,503 | 6,494 | 92.7 | 74,013 | 65,311 | -8,702 | -11.8 |
|
Note: The numbers may not add up to the totals due to the nature of the data. Please refer to section on Defining and measuring short-term dynamics for more detail. Source: Statistics Canada, Table 33-10-0270-01 from the Common Output Data Repository (CODR). |
||||||||||||
| Business openings | Business closures | Active businesses | ||||||||||
|---|---|---|---|---|---|---|---|---|---|---|---|---|
| Apr-19 | Apr-20 | Change from April 2019 to April 2020 | Change from April 2019 to April 2020 | Apr-19 | Apr-20 | Change from April 2019 to April 2020 | Change from April 2019 to April 2020 | Apr-19 | Apr-20 | Change from April 2019 to April 2020 | Change from April 2019 to April 2020 | |
| number | number | number | percent | number | number | number | percent | number | number | number | percent | |
| Canada | 40,136 | 32,803 | 7,333 | -18.3 | 39,078 | 88,187 | 49,109 | 125.7 | 798,379 | 711,472 | -86,907 | -10.9 |
| Newfoundland and Labrador | 640 | 414 | -226 | -35.3 | 600 | 1,190 | 590 | 98.2 | 11,834 | 10,467 | -1,367 | -11.6 |
| Prince Edward Island | 235 | 162 | -74 | -31.3 | 203 | 428 | 225 | 110.6 | 3,566 | 3,213 | -353 | -9.9 |
| Nova Scotia | 843 | 550 | -293 | -34.8 | 821 | 1,869 | 1,048 | 127.7 | 17,470 | 15,842 | -1,628 | -9.3 |
| New Brunswick | 724 | 449 | -275 | -38.0 | 684 | 1,519 | 835 | 121.9 | 14,807 | 13,392 | -1,415 | -9.6 |
| Quebec | 6,246 | 4,920 | -1,326 | -21.2 | 6,374 | 14,953 | 8,578 | 134.6 | 169,989 | 154,173 | -15,816 | -9.3 |
| Ontario | 16,394 | 12,413 | -3,981 | -24.3 | 15,804 | 39,463 | 23,659 | 149.7 | 307,171 | 270,178 | -36,994 | -12.0 |
| Manitoba | 1,133 | 993 | -140 | -12.3 | 1,160 | 2,086 | 926 | 79.8 | 24,272 | 22,706 | -1,566 | -6.5 |
| Saskatchewan | 1,209 | 884 | -326 | -26.9 | 1,131 | 2,185 | 1,054 | 93.1 | 22,283 | 19,936 | -2,347 | -10.5 |
| Alberta | 6,111 | 4,905 | -1,206 | -19.7 | 6,040 | 11,308 | 5,267 | 87.2 | 107,232 | 95,732 | -11,501 | -10.7 |
| British Columbia | 6,578 | 6,499 | -79 | -1.2 | 6,793 | 13,715 | 6,922 | 101.9 | 130,888 | 117,005 | -13,883 | -10.6 |
| Yukon | 66 | 61 | -5 | -7.2 | 68 | 123 | 55 | 80.7 | 1,202 | 1,121 | -81 | -6.8 |
| Northwest Territories | 33 | 36 | 3 | 7.8 | 37 | 61 | 25 | 67.0 | 903 | 852 | -51 | -5.6 |
| Nunavut | Note X: suppressed to meet the confidentiality requirements of the Statistics Act | Note X: suppressed to meet the confidentiality requirements of the Statistics Act | Note ...: not applicable | Note ...: not applicable | Note X: suppressed to meet the confidentiality requirements of the Statistics Act | Note X: suppressed to meet the confidentiality requirements of the Statistics Act | Note ...: not applicable | Note ...: not applicable | 285 | 280 | -5 | -1.7 |
|
... not applicable X suppressed to meet confidentiality requirements Note: The numbers may not add up to the totals due to the nature of the data. Please refer to section on Defining and measuring short-term dynamics for more detail. Source: Statistics Canada, Table 33-10-0270-01 from the Common Output Data Repository (CODR). |
||||||||||||
Will the higher closures become more exits?
Analysis of firm dynamics often focuses on the entry and exit of businesses into and out of the market place. One challenge in doing this sort of analysis is how to distinguish a business that exits a market place when it ceased operations permanently from others that cease operations temporarily. In the business dynamics literature, a business is typically assumed to have exited the market place if it has ceased operations for at least one year. There are many reasons why a business may close for a relatively short period of time. Many businesses, such as snow removal and landscaping companies, are seasonal by their nature and, therefore, only operate for part of the year. Others may close for a short period to upgrade facilities or restructure their corporate structures and finances. Whatever the reason, some closures are not permanent, and therefore, should not be considered exits.
Although it is not necessarily true that every business closure results in an exit, it is true that every exiting business necessarily closes. Business exits and closures, for this reason, tend to be strongly related. This strong relationship can be helpful for predicting the number of exits beyond the last quarter for which business entry and exit data are available. Typically, closures and exits move together, falling when the economy expands and rising when it contracts. If the portion of businesses that close temporarily compared to total businesses remains relatively stable, then closures will continue to predict exits relatively well.
The strength of this relationship can be seen in Chart 4, in which quarterly closures in the business sector were used to predict how many businesses would exit in the same quarter.Note
However, there is no guarantee that this relationship between closures and exits applies to the current situation. Indeed, the support measures to businesses under the Canada Emergency Response Plan to COVID-19 is expected to lower the number of expected exits. Using closures to predict exits through the COVID-19 pandemic likely overstates the impact of the current downturn compared to estimates generated during less extraordinary periods of economic expansion and contraction observed in Canada.

Data table for Chart 4
| Actual exits | Estimated exits | |
|---|---|---|
| number | ||
| 2015 | ||
| Q1 | 26,258 | 25,362 |
| Q2 | 25,815 | 25,725 |
| Q3 | 25,243 | 25,131 |
| Q4 | 25,385 | 25,356 |
| 2016 | ||
| Q1 | 25,415 | 25,302 |
| Q2 | 25,058 | 25,243 |
| Q3 | 24,489 | 24,887 |
| Q4 | 24,402 | 24,295 |
| 2017 | ||
| Q1 | 24,865 | 24,117 |
| Q2 | 25,037 | 25,030 |
| Q3 | 25,534 | 25,356 |
| Q4 | 25,776 | 25,478 |
| Sources: Statistics Canada, Quarterly Business Dynamics database and authors calculations. | ||
Conclusion
This Economic Insights presents results from new data series of monthly business openings and closures, as well as continuing and active businesses. These series provide timely measures of business dynamics for Canada, the provinces and territories, metropolitan areas, and select industries.
The COVID-19 pandemic has led to a significant decline in economic activity that are reflected in the new series. The results show that business closures increased sharply in the Canadian business sector in April 2020, the most recent data point available. The increase was widespread across the provinces and territories, but were particularly high in Ontario and Quebec. The most affected industries were accommodation and food services, other services (excluding public administration) and retail trade, where business closures more than doubled relative to one year ago. Business openings fell in April but was proportionately small compared to the increase in closures in the same month.
While these new series provide more timely insights into changes in firm population due to entry and exit, there is an important distinction between an opening business and a new entrant, and a closing business and a permanent exit. As this is the first article in a set of Economic Insights to be published on this theme, future work will involve examining/incorporating other data sources to look more closely at the relationship between business openings and entrants and business closures and exits.
- Date modified: