
Economic and Social Reports
The labour market outcomes of economic immigrants in the skilled trades
DOI: https://doi.org/10.25318/36280001202101100003-eng
Skip to text
Text begins
Abstract
This article examines trends in the admission and labour market outcomes of economic immigrant principal applicants who intended to work in skilled trades. The admission of skilled trades immigrants increased rapidly in the late 2000s and early 2010s, as the immigration selection system responded to an apparent increase in demand for skilled tradespeople at that time. Skilled trades immigrants had a substantially higher incidence of employment than other economic immigrant principal applicants in the initial years after admission. In the longer term, their employment advantage remained but was reduced for skilled trades immigrant men. Over time, the advantage disappeared for women. Skilled trades immigrants had a much slower earnings growth after admission than other economic immigrants. The factors affecting earnings were somewhat different for skilled trades immigrants. Notably, the positive effects on earnings of holding a university degree, having a greater proficiency in an official language and having pre-admission Canadian work experience were much weaker among skilled trades immigrants than among other economic immigrants.
Authors
Feng Hou is with the Social Analysis and Modelling Division, Analytical Studies Branch, at Statistics Canada. Garnett Picot and Li Xu are with the Research and Evaluation Branch at Immigration, Refugees and Citizenship Canada.
Acknowledgements
This study was conducted in collaboration with Immigration, Refugees and Citizenship Canada. The authors would like to thank Cédric de Chardon, Rose Evra, Rebeka Lee and René Morissette for their advice and comments on an earlier version of this paper.
Introduction
Since the 1990s, Canadian immigration policy has emphasized human capital, particularly education and language proficiency, in the selection of economic immigrants. As a result, the share of recent adult immigrants with at least a bachelor’s degree increased from one in three in the early 2000s to one in two in the mid-2010s. Meanwhile, the supply of new graduates with a bachelor’s degree or higher education from Canadian universities increased even more. The share of university-educated recent immigrants who found a job requiring a university education decreased from 46% in 2001 to 38% in 2016, possibly related to an imbalance in supply and demand (Hou, Lu and Schimmele 2021). The entry earnings of university-educated immigrants declined in the 1990s and 2000s, while remaining stable among those with only a trades certificate or high school education in the same timeframe (Picot, Hou and Qiu 2016).
While immigration and the domestic educational system continuously increase the supply of a university-educated labour force, there has been concern that skilled trades are an often-overlooked career option for many secondary school graduates, and that this may lead to labour shortages in skilled trades occupations (Dijkema and Speer 2020; Lefebvre, Simonova and Wang 2012). In particular, job vacancy rates in the skilled trades exceeded vacancy rates in other occupations because of the boom in the resource sector in the late 2000s and early 2010s (Carey 2014).
Immigration selection responded to the increased demand for skilled tradespeople. The expansion of the Provincial Nominee Program (PNP) since the early 2000s, and the introduction of the Canadian Experience Class (CEC) in 2008, facilitated the recruitment of immigrants who intended to work in skilled trades. Between 2008 and 2014, a series of Ministerial Instructions were implemented with the goal of responding better to perceived occupational demand, including demand in the skilled trades. For instance, in 2008, the Federal Skilled Worker Program (FSWP) was restricted to 38 in-demand occupations, 16 of which were in skilled trades (Government of Canada 2008). The new Federal Skilled Trades Program (FSTP) was established in 2013, allowing entry for up to 3,000 immigrants per year in 43 moderate- or high-demand trades occupations (Government of Canada 2012). FSTP applicants must meet minimum language requirements and have a job offer or a provincially approved certificate of qualification in a skilled trade. However, the FSTP has not reached its annual maximum capacity since its inception, and the majority of immigrant tradespeople have been admitted through other economic immigration programs (OECD 2019).
This article examines trends in the number of economic immigrant principal applicants who intended to work in skilled trades, their sociodemographic characteristics, and their employment and earnings outcomes. Also, comparisons are made with other economic immigrant principal applicants.
Data and measures
This study uses Statistics Canada’s Longitudinal Immigration Database. The analysis focuses on immigrants who intended to work in skilled trades and other economic immigrants who were principal applicants in five economic immigration streams. These streams are the FSWP, the PNP, the CEC, the FSTP and skilled workers admitted through the Quebec selection system. Analysis of employment and earnings is restricted to immigrants aged 20 to 54 in the year of admission and those who were admitted between 2000 and 2014.
Skilled trades occupations in this study are those targeted by the FSTP. They are the following National Occupational Classification (NOC) groups: major group 72—industrial, electrical and construction trades; major group 73—maintenance and equipment operation trades; major group 82—supervisors and technical occupations in natural resources, agriculture and related production; major group 92—processing, manufacturing and utilities supervisors and central control operators; minor group 632—chefs and cooks; and minor group 633—butchers and bakers.
In this article, economic immigrant principal applicants who intended to work in the above occupations are referred to as “skilled trades immigrants,” and other economic immigrant principal applicants are referred to as “other economic immigrants.” In places, analyses are undertaken for three subgroups of skilled trades specified under the FSTP: (1) group A, NOC major groups 72 and 73—skilled trades such as electricians, carpenters, machinists and mechanics; (2) group B, NOC major groups 82 and 92—technical occupations in manufacturing and natural resources such as miners and assembly specialists; and (3) group C, NOC minor groups 632 and 633—skilled trades in food processing and services such as cooks, butchers and bakers.
Recent trends in skilled trades immigrant numbers and characteristics
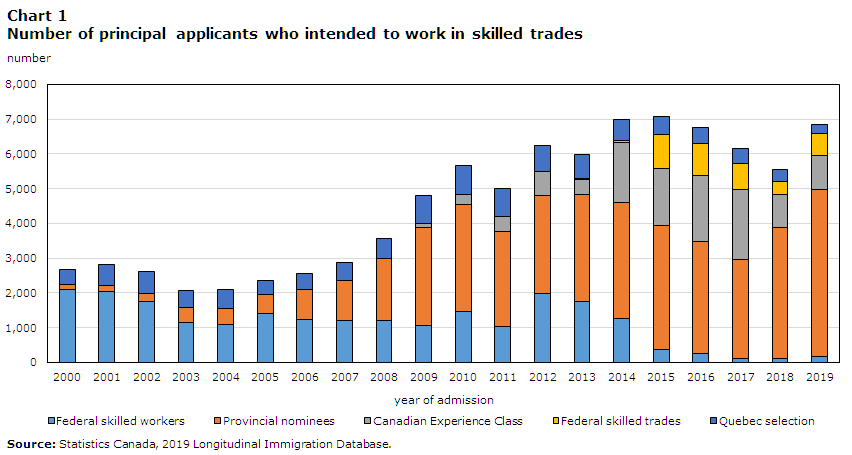
The admission of skilled trades immigrants grew rapidly after 2007, peaking at 7,100 in 2015 (Chart 1). These immigrants constituted about 4% to 5% of all economic principal applicants between 2000 and 2007, increasing to 10% in 2016, and falling back to 7% in 2019. The occupational composition of skilled trades immigrants also changed. The share of group A, mostly electricians, carpenters and other construction and maintenance trades, fell from 77% among the 2000-to-2004 admission cohort to 52% among the 2015-to-2019 admission cohort. The share of group C, skilled trades in food processing and services, rose from 20% to 37%. Between 2000 and 2014—the focus of this study—68% of skilled trades immigrant men were in group A, 9% in group B and 23% in group C. Among women, 16% were in group A, 17% in group B and 67% in group C.
Data table for Chart 1
| Year of admission | Federal skilled workers | Provincial nominees | Canadian Experience Class | Federal skilled trades | Quebec selection |
|---|---|---|---|---|---|
| number | |||||
| 2000 | 2096 | 149 | Note ...: not applicable | Note ...: not applicable | 436 |
| 2001 | 2047 | 163 | Note ...: not applicable | Note ...: not applicable | 607 |
| 2002 | 1748 | 250 | Note ...: not applicable | Note ...: not applicable | 634 |
| 2003 | 1164 | 423 | Note ...: not applicable | Note ...: not applicable | 495 |
| 2004 | 1091 | 452 | Note ...: not applicable | Note ...: not applicable | 549 |
| 2005 | 1421 | 522 | Note ...: not applicable | Note ...: not applicable | 428 |
| 2006 | 1250 | 836 | Note ...: not applicable | Note ...: not applicable | 479 |
| 2007 | 1195 | 1171 | Note ...: not applicable | Note ...: not applicable | 511 |
| 2008 | 1214 | 1775 | Note ...: not applicable | Note ...: not applicable | 590 |
| 2009 | 1067 | 2820 | 110 | Note ...: not applicable | 796 |
| 2010 | 1459 | 3090 | 270 | Note ...: not applicable | 860 |
| 2011 | 1023 | 2741 | 446 | Note ...: not applicable | 789 |
| 2012 | 1982 | 2829 | 682 | Note ...: not applicable | 745 |
| 2013 | 1759 | 3068 | 445 | 11 | 702 |
| 2014 | 1271 | 3334 | 1733 | 63 | 592 |
| 2015 | 365 | 3569 | 1645 | 971 | 538 |
| 2016 | 268 | 3217 | 1904 | 920 | 447 |
| 2017 | 121 | 2856 | 1995 | 749 | 439 |
| 2018 | 128 | 3763 | 930 | 381 | 356 |
| 2019 | 175 | 4794 | 988 | 640 | 244 |
|
... not applicable Source: Statistics Canada, 2019 Longitudinal Immigration Database. |
|||||
The main admission program through which skilled trades immigrants were selected also changed. In 2000, three-quarters of skilled trades immigrants were admitted through the FSWP. But by 2008, the PNP became the primary program, and it admitted 70% of skilled trades immigrants in 2019. The share coming through the CEC also increased, to 32% in 2017, but it then decreased to 14% in 2019. Relatively few entered via the FSTP, peaking at 14% in 2016, and falling to 9% in 2019.Note The number of FSTP immigrants reached about one-third of the maximum program quota in 2015, but fell to about one-fifth in 2019.
Skilled trades immigrants were more likely than other economic immigrants to be men (Table 1). Over the 2000-to-2014 period, 92% of skilled trades immigrants were men, compared with 67% of other economic immigrants.
A little over one-half (54%) of skilled trades immigrants had a trades certificate or a non-university (i.e., college) diploma. Another 16% had a high school diploma or lower level of education. Although skilled trades immigrants generally had a lower level of education than other economic immigrants, 30% had a university degree.
About 40% of skilled trades immigrants admitted over the 2000-to-2014 period had pre-admission Canadian work experience, more than other economic principal applicants did (23%). This group difference was small among the 2000-to-2004 arrival cohort (9% vs. 10%), but was larger (58% vs. 36%) among the 2010-to-2014 cohort.
| Admission years | ||||||||
|---|---|---|---|---|---|---|---|---|
| 2000 to 2014 | 2000 to 2004 | 2005 to 2009 | 2010 to 2014 | |||||
| Skilled trades | Others | Skilled trades | Others | Skilled trades | Others | Skilled trades | Others | |
| percent | ||||||||
| Sex | ||||||||
| Men | 92.1 | 67.2 | 94.2 | 73.7 | 93.5 | 67.7 | 90.5 | 60.8 |
| Women | 7.9 | 32.8 | 5.9 | 26.3 | 6.6 | 32.3 | 9.5 | 39.2 |
| Age group | ||||||||
| 20 to 29 | 22.6 | 25.7 | 24.9 | 25.8 | 19.7 | 22.6 | 23.2 | 28.4 |
| 30 to 39 | 47.7 | 49.5 | 49.3 | 51.9 | 47.6 | 48.8 | 47.1 | 48.0 |
| 40 to 49 | 25.3 | 20.4 | 24.0 | 19.7 | 27.8 | 23.0 | 24.5 | 18.7 |
| 50 and older | 4.4 | 4.4 | 1.7 | 2.6 | 4.9 | 5.6 | 5.3 | 4.9 |
| Education | ||||||||
| Secondary or less | 15.7 | 5.8 | 11.3 | 3.9 | 15.4 | 5.9 | 17.6 | 7.5 |
| Trades certificate | 27.1 | 3.0 | 25.2 | 2.4 | 28.9 | 2.8 | 27.0 | 3.7 |
| Non-university certificate or diploma | 27.1 | 11.6 | 34.8 | 10.3 | 28.7 | 11.7 | 23.0 | 12.7 |
| Bachelor’s degree | 24.9 | 48.4 | 25.7 | 57.1 | 22.8 | 45.3 | 25.8 | 43.3 |
| Graduate degree | 5.2 | 31.2 | 3.0 | 26.4 | 4.2 | 34.3 | 6.6 | 32.9 |
| Language | ||||||||
| Did not speak English or French | 8.9 | 12.1 | 12.7 | 18.9 | 11.3 | 10.2 | 6.0 | 7.5 |
| Other mother tongue, speaks English or French | 73.7 | 73.0 | 68.5 | 69.3 | 69.2 | 73.7 | 78.3 | 75.7 |
| English or French mother tongue | 17.4 | 14.9 | 18.9 | 11.8 | 19.5 | 16.1 | 15.7 | 16.8 |
| Pre-landing Canadian work experience | ||||||||
| No | 59.6 | 77.5 | 90.7 | 90.1 | 68.4 | 79.4 | 42.0 | 64.2 |
| Yes | 40.4 | 22.5 | 9.3 | 9.9 | 31.6 | 20.6 | 58.0 | 35.8 |
| Source region | ||||||||
| United States | 0.5 | 1.6 | 0.4 | 1.0 | 0.7 | 2.2 | 0.5 | 1.6 |
| Central America, South America and Caribbean | 5.3 | 7.6 | 4.7 | 6.4 | 4.6 | 8.3 | 5.9 | 8.1 |
| Northern and Western Europe | 16.9 | 9.8 | 18.3 | 9.8 | 23.0 | 10.2 | 13.0 | 9.3 |
| Southern and Eastern Europe | 11.6 | 7.8 | 14.8 | 10.9 | 12.1 | 8.1 | 10.1 | 4.8 |
| Africa | 9.9 | 14.0 | 11.6 | 10.9 | 9.3 | 14.4 | 9.5 | 16.5 |
| Southern Asia | 21.8 | 19.8 | 27.3 | 20.2 | 17.8 | 18.4 | 21.8 | 20.6 |
| Southeast Asia | 15.8 | 8.4 | 10.0 | 5.3 | 15.1 | 7.2 | 18.6 | 12.3 |
| Eastern Asia | 11.5 | 20.7 | 5.9 | 26.2 | 11.1 | 21.2 | 14.0 | 15.3 |
| Western Asia | 5.4 | 9.4 | 6.0 | 8.2 | 5.5 | 9.3 | 5.1 | 10.7 |
| Oceania or other | 1.3 | 0.8 | 1.1 | 0.9 | 1.0 | 0.8 | 1.5 | 0.8 |
| Source: Statistics Canada, 2019 Longitudinal Immigration Database. | ||||||||
The source regionNote composition of skilled trades immigrants was as diverse as that of other economic immigrants, though a larger share (66%) of skilled trades immigrants came from Europe, Southern Asia and Southeast Asia. However, from the early 2000s to the early 2010s, the share of skilled trades immigrants coming from Europe declined while that from Southeast and Eastern Asia increased. There was little difference regarding knowledge of official languages between skilled trades immigrants and other economic immigrants.
Skilled trades immigrants were more likely to be employed than other economic immigrants
Skilled trades immigrant men who were aged 20 to 54 at admission had a higher employment incidence than other economic immigrants, both shortly after admission and in the longer run (Table 2). The employment incidence is defined as the share of immigrants having an annual employment income (wages or salaries and net self-employment income) of at least $500 (in 2018 dollars). Depending on the admission cohorts, the employment incidence ranged from 91% to 95% among skilled trades immigrant men in their first full year after admission, about 10 percentage points higher than that of other economic immigrant men. While the rates increased over time among other economic immigrants and changed little among skilled trades immigrants, ten years after admission skilled trades immigrant men still had a 6 percentage-point advantage in the employment incidence over other economic immigrant men.
| Years since admission | Admission years | |||||
|---|---|---|---|---|---|---|
| 2000 to 2004 | 2005 to 2009 | 2010 to 2014 | ||||
| Skilled trades | Others | Skilled trades | Others | Skilled trades | Others | |
| percent | ||||||
| Men | ||||||
| 1 | 90.5 | 80.1 | 92.8 | 81.2 | 94.9 | 85.3 |
| 2 | 90.6 | 82.1 | 92.5 | 82.7 | 95.0 | 86.5 |
| 3 | 91.7 | 84.3 | 93.2 | 84.6 | 95.0 | 88.0 |
| 4 | 91.8 | 85.8 | 93.2 | 85.6 | 95.2 | 89.2 |
| 5 | 91.9 | 85.6 | 93.4 | 85.9 | Note ...: not applicable | Note ...: not applicable |
| 6 | 90.7 | 84.6 | 93.4 | 85.5 | Note ...: not applicable | Note ...: not applicable |
| 7 | 90.7 | 84.3 | 92.8 | 85.2 | Note ...: not applicable | Note ...: not applicable |
| 8 | 90.6 | 84.2 | 92.9 | 85.3 | Note ...: not applicable | Note ...: not applicable |
| 9 | 90.1 | 84.2 | 93.0 | 85.7 | Note ...: not applicable | Note ...: not applicable |
| 10 | 90.2 | 84.5 | Note ...: not applicable | Note ...: not applicable | Note ...: not applicable | Note ...: not applicable |
| 11 | 90.4 | 84.5 | Note ...: not applicable | Note ...: not applicable | Note ...: not applicable | Note ...: not applicable |
| 12 | 90.3 | 84.3 | Note ...: not applicable | Note ...: not applicable | Note ...: not applicable | Note ...: not applicable |
| 13 | 90.2 | 84.7 | Note ...: not applicable | Note ...: not applicable | Note ...: not applicable | Note ...: not applicable |
| 14 | 90.0 | 84.9 | Note ...: not applicable | Note ...: not applicable | Note ...: not applicable | Note ...: not applicable |
| Women | ||||||
| 1 | 81.1 | 74.8 | 83.5 | 76.0 | 85.2 | 77.1 |
| 2 | 80.8 | 77.1 | 82.0 | 77.8 | 84.9 | 78.9 |
| 3 | 84.4 | 79.8 | 83.1 | 79.6 | 85.1 | 81.1 |
| 4 | 83.4 | 81.7 | 83.5 | 80.5 | 86.7 | 83.4 |
| 5 | 83.5 | 82.0 | 84.1 | 81.8 | Note ...: not applicable | Note ...: not applicable |
| 6 | 79.5 | 81.9 | 83.4 | 82.5 | Note ...: not applicable | Note ...: not applicable |
| 7 | 82.2 | 82.0 | 83.5 | 82.7 | Note ...: not applicable | Note ...: not applicable |
| 8 | 84.3 | 82.0 | 83.8 | 82.9 | Note ...: not applicable | Note ...: not applicable |
| 9 | 83.8 | 82.0 | 84.6 | 83.4 | Note ...: not applicable | Note ...: not applicable |
| 10 | 84.0 | 82.2 | Note ...: not applicable | Note ...: not applicable | Note ...: not applicable | Note ...: not applicable |
| 11 | 80.9 | 82.6 | Note ...: not applicable | Note ...: not applicable | Note ...: not applicable | Note ...: not applicable |
| 12 | 82.7 | 82.6 | Note ...: not applicable | Note ...: not applicable | Note ...: not applicable | Note ...: not applicable |
| 13 | 82.9 | 82.9 | Note ...: not applicable | Note ...: not applicable | Note ...: not applicable | Note ...: not applicable |
| 14 | 83.5 | 82.8 | Note ...: not applicable | Note ...: not applicable | Note ...: not applicable | Note ...: not applicable |
|
... not applicable Source: Statistics Canada, 2019 Longitudinal Immigration Database. |
||||||
Much of the difference in the employment incidence between male skilled trades immigrants and other male economic immigrants was the result of differences in sociodemographic characteristics (40% to 65%). These characteristics include education, language, years of foreign experience,Note years of pre-admission Canadian work experience,Note source region and province of residence (table not shown).
The patterns above, observed among economic immigrant men, were generally applicable to immigrant women, with a few differences. The initial advantage in employment incidence of skilled trades immigrant women over other economic immigrant women was about 7 to 8 percentage points in the first full year, smaller than that between their male counterparts. The gap narrowed more quickly than for the men and disappeared after five years (Table 2, bottom panel). After differences in background characteristics were adjusted for, the advantage of skilled trades immigrant women relative to other economic immigrant women was about 5 percentage points in the first year and disappeared by the ninth year after admission (table not shown).
Earnings grew slower among skilled trades immigrants than among other economic immigrants
In the first year after admission, the median earningsNote of skilled trades immigrant men were 13% to 16% higher than those of other economic immigrants (Table 3). However, earnings grew slower among skilled trades immigrant men than among other economic immigrant men. Hence, the initial earnings advantage disappeared by the second or third year after admission. By the ninth year, skilled trades immigrant men earned 14% less than other economic immigrant men (the 2005-to-2009 cohort). In the first nine years, median earnings grew 42% among skilled trades immigrant men, about half the rate observed among other economic immigrant men (91%).
There was considerable variation in earnings by occupational group among skilled trades immigrant men. For the 2005-to-2009 cohort, for instance, median earnings were much lower and grew more slowly in group C than in the other two occupational groups (table not shown).Note During the first nine years after entry, annual earnings grew 45% from $36,200 to $52,200 (in 2018 constant dollars) for group A (construction and maintenance trades), 48% from $38,200 to $56,700 for group B (miners and assembly specialists) and 28% from $29,800 to $38,100 for group C (trades in food processing and services).
Differences in sociodemographic characteristicsNote accounted for few of the differences in initial earnings and earnings growth between skilled trades immigrant men and other economic immigrant men. Regression results showed that the first-year earnings advantage of skilled trades immigrant men over other economic immigrant men changed from 15% (0.138 log points) without controls for sociodemographic characteristics to 14% (0.129 log points) with controls (Table 4, models 1 and 2). Net of differences in sociodemographic characteristics, the remaining advantage of skilled trades immigrant men in median earnings in the first year after admission is likely related to the fact that other economic immigrants, who mostly had a university degree, were overrepresented in the bottom end of the earnings distribution relative to skilled trades immigrants. Many economic immigrants with university degrees could only find jobs requiring no more than a high school education in the initial years after immigration (Hou, Lu and Schimmele 2021). However, skilled trades immigrants had lower earnings growth over time, even controlling for sociodemographic characteristics. The gap in annual earnings growth changed slightly from 2.8% (-0.028 log points) without controls to 2.4% (-0.024 log points) with controls.
Skilled trades immigrant women had slightly lower median earnings (4% lower) than other economic immigrant women in the first year after admission (Table 3, bottom panel). Their earnings also grew more slowly than those of other economic immigrant women. By the ninth year, skilled trades immigrant women had median earnings 23% lower than other economic immigrant women (the 2005-to-2009 cohort). Over the first nine years after admission, median earnings grew 52% among skilled trades immigrant women, but 88% among other economic immigrant women. These observed results remained similar after controlling for group differences in sociodemographic characteristics (Table 4, model 2 for women).
| Years since admission | Years of admission | |||||
|---|---|---|---|---|---|---|
| 2000 to 2004 | 2005 to 2009 | 2010 to 2014 | ||||
| Skilled trades | Others | Skilled trades | Others | Skilled trades | Others | |
| 2018 constant dollars | ||||||
| Men | ||||||
| 1 | 30,400 | 26,200 | 35,100 | 30,200 | 40,900 | 36,100 |
| 2 | 35,100 | 32,400 | 38,600 | 35,900 | 44,000 | 41,500 |
| 3 | 38,100 | 37,500 | 40,500 | 40,100 | 46,500 | 45,200 |
| 4 | 41,100 | 42,800 | 42,400 | 43,400 | 48,500 | 48,900 |
| 5 | 42,800 | 47,200 | 44,700 | 46,900 | Note ...: not applicable | Note ...: not applicable |
| 6 | 44,100 | 50,900 | 46,700 | 50,500 | Note ...: not applicable | Note ...: not applicable |
| 7 | 44,900 | 53,700 | 47,600 | 53,300 | Note ...: not applicable | Note ...: not applicable |
| 8 | 46,000 | 55,900 | 48,900 | 55,500 | Note ...: not applicable | Note ...: not applicable |
| 9 | 47,800 | 58,000 | 49,900 | 57,700 | Note ...: not applicable | Note ...: not applicable |
| 10 | 48,900 | 60,000 | Note ...: not applicable | Note ...: not applicable | Note ...: not applicable | Note ...: not applicable |
| 11 | 50,100 | 61,900 | Note ...: not applicable | Note ...: not applicable | Note ...: not applicable | Note ...: not applicable |
| 12 | 51,000 | 63,500 | Note ...: not applicable | Note ...: not applicable | Note ...: not applicable | Note ...: not applicable |
| 13 | 52,200 | 64,700 | Note ...: not applicable | Note ...: not applicable | Note ...: not applicable | Note ...: not applicable |
| 14 | 52,500 | 65,700 | Note ...: not applicable | Note ...: not applicable | Note ...: not applicable | Note ...: not applicable |
| Women | ||||||
| 1 | 20,300 | 21,100 | 23,300 | 24,200 | 24,700 | 25,800 |
| 2 | 21,800 | 26,500 | 24,200 | 29,000 | 27,600 | 29,500 |
| 3 | 24,400 | 30,500 | 27,400 | 32,200 | 28,600 | 32,200 |
| 4 | 25,700 | 34,500 | 28,000 | 34,900 | 30,000 | 35,000 |
| 5 | 25,100 | 38,300 | 30,000 | 37,300 | Note ...: not applicable | Note ...: not applicable |
| 6 | 28,000 | 41,300 | 32,000 | 39,500 | Note ...: not applicable | Note ...: not applicable |
| 7 | 30,300 | 43,500 | 32,700 | 41,700 | Note ...: not applicable | Note ...: not applicable |
| 8 | 32,100 | 45,600 | 34,800 | 43,800 | Note ...: not applicable | Note ...: not applicable |
| 9 | 32,600 | 47,500 | 35,300 | 45,600 | Note ...: not applicable | Note ...: not applicable |
| 10 | 32,300 | 49,400 | Note ...: not applicable | Note ...: not applicable | Note ...: not applicable | Note ...: not applicable |
| 11 | 33,600 | 50,700 | Note ...: not applicable | Note ...: not applicable | Note ...: not applicable | Note ...: not applicable |
| 12 | 32,700 | 52,400 | Note ...: not applicable | Note ...: not applicable | Note ...: not applicable | Note ...: not applicable |
| 13 | 34,700 | 53,600 | Note ...: not applicable | Note ...: not applicable | Note ...: not applicable | Note ...: not applicable |
| 14 | 36,500 | 54,800 | Note ...: not applicable | Note ...: not applicable | Note ...: not applicable | Note ...: not applicable |
|
... not applicable Note: Earnings are rounded to the nearest $100. Source: Statistics Canada, 2019 Longitudinal Immigration Database. |
||||||
| Men | Women | |||||
|---|---|---|---|---|---|---|
| Model 1 | Model 2 | Model 3 | Model 1 | Model 2 | Model 3 | |
| coefficient | ||||||
| Intercept | 10.281Note *** | 10.685Note *** | 10.655Note *** | 9.862Note *** | 9.979Note *** | 9.975Note *** |
| Skilled trades | 0.138Note *** | 0.129Note *** | 0.044Note *** | -0.075Note *** | -0.063Note *** | -0.154Note *** |
| Arrival cohorts (reference: 2010 to 2014) | ||||||
| 2000-to-2004 cohort | -0.342Note *** | -0.143Note *** | -0.149Note *** | -0.166Note *** | 0.002 | 0.001 |
| 2005-to-2009 cohort | -0.184Note *** | -0.052Note *** | -0.058Note *** | -0.058Note *** | 0.039Note *** | 0.038Note *** |
| Years since admission | 0.110Note *** | 0.123Note *** | 0.124Note *** | 0.119Note *** | 0.135Note *** | 0.135Note *** |
| Years since admission squared/100 | -0.558Note *** | -0.559Note *** | -0.561Note *** | -0.496Note *** | -0.513Note *** | -0.513Note *** |
| Years since admission × 2000-to-2004 cohort | 0.034Note *** | 0.021Note *** | 0.021Note *** | 0.022Note *** | 0.010Note *** | 0.010Note *** |
| Years since admission × 2005-to-2009 cohort | 0.018Note *** | 0.007Note *** | 0.008Note *** | 0.008Note *** | -0.002 | -0.002Note * |
| Skilled trades × years since admission | -0.028Note *** | -0.024Note *** | -0.028Note *** | -0.027Note *** | -0.021Note *** | -0.028Note *** |
| Education (reference: trades certificate) | ||||||
| Secondary or less | Note ...: not applicable | 0.027Note *** | 0.065Note *** | Note ...: not applicable | 0.017Note ** | 0.015 |
| Some postsecondary education | Note ...: not applicable | 0.053Note *** | 0.083Note *** | Note ...: not applicable | 0.110Note *** | 0.115Note *** |
| Bachelor's degree | Note ...: not applicable | 0.173Note *** | 0.217Note *** | Note ...: not applicable | 0.246Note *** | 0.252Note *** |
| Graduate degree | Note ...: not applicable | 0.207Note *** | 0.246Note *** | Note ...: not applicable | 0.305Note *** | 0.310Note *** |
| Language (reference: English mother tongue) | ||||||
| Did not speak English or French | Note ...: not applicable | -0.461Note *** | -0.467Note *** | Note ...: not applicable | -0.362Note *** | -0.366Note *** |
| Other mother tongue, bilingual in English and French | Note ...: not applicable | -0.393Note *** | -0.400Note *** | Note ...: not applicable | -0.252Note *** | -0.254Note *** |
| Other mother tongue, French | Note ...: not applicable | -0.500Note *** | -0.509Note *** | Note ...: not applicable | -0.358Note *** | -0.364Note *** |
| Other mother tongue, English | Note ...: not applicable | -0.365Note *** | -0.373Note *** | Note ...: not applicable | -0.258Note *** | -0.260Note *** |
| French mother tongue | Note ...: not applicable | -0.347Note *** | -0.342Note *** | Note ...: not applicable | -0.202Note *** | -0.205Note *** |
| Years of foreign experience | Note ...: not applicable | -0.015Note *** | -0.016Note *** | Note ...: not applicable | -0.008Note *** | -0.008Note *** |
| Years of pre-admission Canadian experience | Note ...: not applicable | 0.074Note *** | 0.078Note *** | Note ...: not applicable | 0.078Note *** | 0.079Note *** |
| Skilled trades × secondary or less | Note ...: not applicable | Note ...: not applicable | -0.092Note *** | Note ...: not applicable | Note ...: not applicable | 0.048Note * |
| Skilled trades × some postsecondary education | Note ...: not applicable | Note ...: not applicable | -0.055Note *** | Note ...: not applicable | Note ...: not applicable | -0.066Note ** |
| Skilled trades × bachelor's degree | Note ...: not applicable | Note ...: not applicable | -0.185Note *** | Note ...: not applicable | Note ...: not applicable | -0.101Note *** |
| Skilled trades × graduate degree | Note ...: not applicable | Note ...: not applicable | -0.217Note *** | Note ...: not applicable | Note ...: not applicable | -0.077Note ** |
| Skilled trades × did not speak English or French | Note ...: not applicable | Note ...: not applicable | 0.063Note *** | Note ...: not applicable | Note ...: not applicable | 0.214Note *** |
| Skilled trades × other mother tongue, bilingual in English and French | Note ...: not applicable | Note ...: not applicable | 0.078Note *** | Note ...: not applicable | Note ...: not applicable | 0.184Note *** |
| Skilled trades × other mother tongue, French | Note ...: not applicable | Note ...: not applicable | 0.117Note *** | Note ...: not applicable | Note ...: not applicable | 0.352Note *** |
| Skilled trades × other mother tongue, English | Note ...: not applicable | Note ...: not applicable | 0.107Note *** | Note ...: not applicable | Note ...: not applicable | 0.169Note *** |
| Skilled trades × French mother tongue | Note ...: not applicable | Note ...: not applicable | -0.068Note *** | Note ...: not applicable | Note ...: not applicable | 0.211Note *** |
| Skilled trades × years of foreign experience | Note ...: not applicable | Note ...: not applicable | 0.012Note *** | Note ...: not applicable | Note ...: not applicable | 0.005Note *** |
| Skilled trades × years of pre-admission Canadian work experience | Note ...: not applicable | Note ...: not applicable | -0.046Note *** | Note ...: not applicable | Note ...: not applicable | -0.042Note *** |
... not applicable
Source: Statistics Canada, 2019 Longitudinal Immigration Database. |
||||||
The effects of human capital factors on earnings were different for skilled trades immigrants
The effects of human capital factors on earnings were different for skilled trades immigrant men and other economic immigrant men (Table 4, model 3).
Firstly, holding a university degree made little difference to earnings for skilled trades immigrant men, but had a significant effect for other economic immigrant men. Bachelor’s degree holders earned 3% (0.032 log points) more than individuals with a trades certificate among skilled trades immigrant men, compared with a difference of 24% (0.217 log points) among other economic immigrant men.
Secondly, a lack of official language proficiency had a smaller (although still substantial) negative effect on earnings among skilled trades immigrant men than among other economic immigrant men. Relative to individuals with English as their mother tongue, those with another mother tongue but who spoke English earned 23% less (-0.265 log points) among skilled trades immigrant men, and 31% less (-0.373 log points) among other economic immigrant men.
Furthermore, the positive effect of pre-admission Canadian work experience on earnings was not as strong for skilled trades immigrant men as it was for other economic immigrant men. An extra year of pre-admission Canadian work experience was associated with a 3.3% earnings gain for skilled trades immigrant men, compared with an 8.1% earnings gain for other economic immigrant men.
Finally, foreign work experience had little negative effect on the earnings of skilled trades immigrant men, but a strong negative effect for other economic immigrant men. An extra year of foreign work experience was associated with 0.4% (-0.004 log points) lower earnings for skilled trades immigrant men, but 1.6% (-0.016 log points) lower earnings for other economic immigrants.
Broadly similar to the patterns among men, human capital factors had different earning effects for skilled trades immigrant women and other economic immigrant women (Table 4, model 3 for women).
Summary
The admission of economic immigrant principal applicants who intended to work in skilled trades increased rapidly from around 2,500 annually in the first half of the 2000s to around 7,100 in 2015, then decreased to 6,800 in 2019. The number of skilled trades immigrants rapidly rose in response to an apparent increase in demand in the late 2000s and early 2010s. The rapid increase was achieved primarily through the Provincial Nominee Program and the Canadian Experience Class. The new Federal Skilled Trades Program, introduced in 2013, played only a minor role.
Economic principal applicants who intended to work in skilled trades were predominately men (over 90%). They were slightly older and had lower levels of education than other economic immigrants. About one-half had a trades or college certificate. Those who were admitted in the late 2000s and early 2010s were more likely to have worked in Canada prior to admission than other economic immigrants.
In the first year after admission, skilled trades principal applicants had a higher incidence of employment than other economic principal applicants: 10 percentage points higher for men and 7 points higher for women. Among men, this employment advantage narrowed to 6 percentage points by the 10th year, while the advantage disappeared after 5 years among women.
Earnings growth was much slower among employed skilled trades immigrants than among other economic immigrants. The first-year median annual earnings advantage held by skilled trades immigrant men over other economic immigrant men disappeared by the third year and turned into a 14% deficit after nine years (for the 2005-to-2009 cohort). Skilled trades immigrant women displayed a similar pattern, and showed a 23% earnings deficit by the ninth year. This pattern is consistent with earlier research that found that the earnings trajectory of more educated immigrants is steeper (Picot, Hou and Qiu 2016).
There was considerable variation in earnings by occupational group among skilled trades immigrants. Notably, the median annual earnings of men who intended to work in skilled trades in food processing and services were lower and grew more slowly than for other skilled trades. On average, they started at $29,800 in the first year and reached $38,100 by the ninth year. Among immigrants who intended to work in construction and maintenance skilled trades, median annual earnings started at $36,200 and reached $52,200 by the ninth year.
Human capital factors had different earning effects for skilled trades immigrants. The typically positive effects on earnings of having a university degree, a greater proficiency in an official language and more pre-admission Canadian work experience were much weaker among skilled trades immigrants than among other economic immigrants. The occupational skills acquired through a university degree likely have little direct economic benefit in a trades job. Language requirements may be less important in skilled trades jobs than in the broad range of jobs held by other economic immigrants. Meanwhile, the negative effect of foreign work experience on earnings was weaker among skilled trades immigrants than among other economic immigrants. Given a possible greater demand for skilled trades immigrants, employers may have paid less attention to their work experience, whether Canadian or foreign, than was the case for other economic immigrants.
References
Carey, D. 2014. Overcoming Skills Shortages in Canada. Organisation for Economic Co-operation and Development Economics Department working paper no. 1143. Available at: https://dx.doi.org/10.1787/5jz123fgkxjl-en.
Dijkema, B., and S. Speer. 2020. “The skilled trades are in need of strengthened apprenticeship-programs.” Policy Options. Institute for Research on Public Policy. Available at: https://policyoptions.irpp.org/magazines/february-2020/the-skilled-trades-are-in-need-of-strengthened-apprenticeship-programs/.
Government of Canada. 2008. “Ministerial instructions.” Canada Gazette Part I 142 (8): 3043–3045. Available at: http://publications.gc.ca/site/archivee-archived.html?url=http://publications.gc.ca/gazette/archives/p1/2008/2008-11-29/pdf/g1-14248.pdf.
Government of Canada. 2012. “Updated ministerial instructions.” Canada Gazette Part I 146 (52): 3638–3641. Available at: https://gazette.gc.ca/rp-pr/p1/2012/2012-12-29/pdf/g1-14652.pdf.
Hou, F., Y. Lu, and C. Schimmele. 2021. “Recent trends in overeducation by immigration status in Canada: The impact of demographics, supply, and demand.” International Migration 59 (3):192–212. doi: 10.1111/imig.12764.
Lefebvre, R., E. Simonova, and L. Wang. 2012. Labour Shortages in Skilled Trades – The Best Guestimate? Certified General Accountants Association of Canada. Available at: https://www.voced.edu.au/content/ngv%3A72669.
OECD (Organisation for Economic Co-operation and Development). 2019. Recruiting Immigrant Workers: Canada 2019. Paris: OECD Publishing. Available at: https://doi.org/10.1787/4abab00d-en.
Picot, G., F. Hou, and T. Qiu. 2016. “The human capital model of selection and long-run economic outcomes of immigrants in Canada.” International Migration 54 (3): 73–88.
- Date modified: