
Economic and Social Reports
Claiming postsecondary education tax credits: Differences by level of parental income and implications for trends in enrolment rates
DOI: https://doi.org/10.25318/36280001202101100002-eng
Skip to text
Text begins
Abstract
Postsecondary students can claim postsecondary education credits to lower their tax obligations (or that of a parent, grandparent, spouse or common-law partner, or their parent or grandparent). Claiming the credits is costless, but it does require knowledge of how the credits work to reduce taxes. As a result, claim rates may be unequal across socioeconomic backgrounds, including the level of parental income (a key policy lever for needs-based student financial aid). The primary purpose of this article is to document claim rates among postsecondary students by level of parental income. Unequal claim rates have direct implications for the tax obligations of families and potential indirect effects on postsecondary enrolment rates if certain groups do not factor the benefits of the credits into their educational decisions. A secondary goal of the article is to reassess trends in postsecondary enrolment rates by level of parental income in light of unequal claim rates. These trends were previously established with information on the tax credits in tax data.
To do so, the study uses data from the T1 Family File (T1FF) and the Postsecondary Student Information System (PSIS), which have been recently linked for all 10 provinces from 2009 onwards. Overall, among 19-year-old postsecondary students who filed their taxes in 2017, about 9 in 10 claimed the credits. However, claim rates were unequal across the parental income distribution. This was especially evident among 19-year-old postsecondary students in the bottom quintile of the parental income distribution, as 82.8% of them claimed credits. In contrast, claim rates varied between 88.1% and 92.8% in the top 80% of the income distribution (with rates increasing slightly with each level of income). These trends in claim rates were more or less the same over the entire period of the study (2009 to 2017) and when late tax filers were taken into account. Further evidence suggests that the average youth in the bottom income quintile forewent tax savings by not claiming the credits in the year when they enrolled or in a later year (when tax obligations were greater).
The lower claim rates among postsecondary students in the bottom of the income distribution imply that the tax data tend to slightly overstate the gap in postsecondary enrolment rates across income categories. In 2017, according to the T1FF, 78.4% of 19-year-olds in the top income quintile claimed education tax credits, compared with 44.0% of their counterparts in the bottom income quintile (a gap of 34.3 percentage points). According to the PSIS, the gap in enrolment was somewhat smaller between the same people in those two groups: 72.1% compared with 43.4% (a gap of 28.7 percentage points). The gap in enrolment rates across the income distribution narrowed slightly between 2009 and 2017, primarily because of rising enrolment among youth in the lowest income quintile (a trend that was considerably more evident in the PSIS than in the T1FF). The data also enable, for the first time with national registration information, the calculation of enrolment rates in degree programs (from a university or college) by level of parental income. Among 19-year-old youth in the top income quintile in 2017, 52.3% had enrolled in a degree program, compared with 25.0% among their counterparts in the bottom income quintile. Finally, the study also found that postsecondary enrolment was most equitable (based on parental income) in Ontario and British Columbia, but this was largely because of the high concentration of immigrants and children of immigrants in those provinces (a group that tends to have below-average incomes, but above-average enrolment rates). Among third-generation Canadians or more, equity in postsecondary enrolment was highest in Nova Scotia, followed by Ontario.
Author
Marc Frenette is with the Social Analysis and Modelling Division, Analytical Studies and Modelling Branch, at Statistics Canada.
Introduction
Obtaining a postsecondary education is a key strategy available to youth from low-income families seeking to achieve a higher economic status than their parents. Indeed, previous studies have demonstrated that postsecondary graduates earn considerably more than high school graduates over their career (e.g., Frenette 2014; Frenette 2019a). Studies have also attached a causal interpretation to the earnings premiums associated with higher education (e.g., Heckman, Humphries and Veramendi [2016] in the United States, and Lemieux and Card [2001] in Canada). One study demonstrated that the earnings premium associated with a postsecondary education is large and positive for youth from families across the income distribution, and, in relative terms, the premium is actually larger for youth in the bottom income quintile than for their counterparts in the top income quintile (Frenette 2019b). Despite this, youth from lower-income families are considerably less likely to pursue a postsecondary education (Frenette 2017).
Governments have recognized the importance of a postsecondary education by offering needs-based student financial aid such as loans and non-refundable grants, and postsecondary savings incentives and enrolment incentives through tax credits. While much attention in the literature has focused on student financial aid and saving incentives, far less is known about postsecondary education tax credits.
When students attend postsecondary institutions, they may claim the tuition that they paid (and, before 2017, an education and textbook amount) on their taxes as a credit. This contributes to lowering their tax obligations. If they cannot apply all of the credits towards their taxes, they may choose to transfer the credits to other individuals such as a spouse or common-law partner, a parent or a grandparent, or their spouse’s or common-law partner’s parent or grandparent, or they can simply carry forward any unused amount to reduce their own tax obligations in a future year. In all of these cases, students must fill out a Schedule 11 for the tax year in which they enrolled in postsecondary education; however, they can choose to do so in a later year, through late filing.Note
These three possible ways of claiming postsecondary education tax credits require knowledge of the tax credits and an understanding of how to strategically use them to minimize taxes at either the individual or the family level. The degree of knowledge and understanding may differ by level of income, and this is a key policy factor in needs-based student financial aid and savings incentives. For example, youth from low-income families may be less likely to claim the credits since their parents did not have access to an accountant, or they may have no experience with the credits since they did not enrol in postsecondary education.
The possibility that postsecondary education tax credits are not equally claimed by youth from low- and high-income families raises at least three important issues. First, low-income families may not fully benefit from the tax-saving potential of the credits, which may represent a significant amount of money for them. Second, lower awareness and understanding of how the credits work may also reduce any positive effect of the credits on the decision to enrol in postsecondary education in the first place. Third, the postsecondary education tax credits have been used to measure postsecondary enrolment with tax data (Frenette 2017), but unclaimed credits reduce estimates of the coverage of postsecondary students.
With these implications in mind, the purpose of this article is twofold. First, the claim rates among postsecondary students will be estimated among youth from across the parental income distribution. To do so, 19-year-oldNote postsecondary studentsNote will be identified in the Postsecondary Student Information System (PSIS), which contains almost all enrolments in Canadian public postsecondary institutions since 2009. Among this sample, the percentage claiming the postsecondary education tax credits for a particular tax year will be identified with the T1 Family File (T1FF), whether it is for themselves, for another person or carried forward to a later year. Results will also be generated by level of total parental income, expressed in 2017 dollars, and adjusted for family size after dividing by the square root of the number of people in the family to obtain a per capita measure of income that also accounts for economies of scale in raising larger families.Note Second, trends in postsecondary enrolment rates by level of parental income, which have previously been estimated with tax data, will be revisited in light of unequal claim rates. In doing so, all tax-filing 19-year-olds in the T1FF will be selected, and their postsecondary enrolment rates will be estimated based on information available in the T1FF (i.e., the education credits) and information available in the PSIS (i.e., registration information).
Nine out of 10 19-year-old postsecondary students claimed education credits
Overall, among 19-year-old postsecondary students who filed their taxes, about 9 in 10 claimed education credits in each of the available years of the study—2009 to 2017 (Chart 1). In 2017, this included tuition credits, but before 2017, students could also claim education and textbook credits. However, these two credits overlapped considerably (i.e., students claiming one would often claim the other), so removing the education and textbook credits did not appear to result in a substantial decline in the overall postsecondary education credit claim rate. The trend was fairly stable between 2009 and 2015, ranging from 90.1% to 91.2%, before dipping below 90% in 2016 and 2017. When late filers were included in the analysis, there was virtually no change in these results.Note Note Note

Data table for Chart 1
| Tuition Ccredits | Education and textbook credits | Tuition or education and textbook credits | |
|---|---|---|---|
| percent | |||
| 2009 | 88.84 | 89.31 | 90.63 |
| 2010 | 89.47 | 89.83 | 91.21 |
| 2011 | 88.98 | 89.37 | 90.57 |
| 2012 | 88.68 | 89.11 | 90.33 |
| 2013 | 88.46 | 88.92 | 90.13 |
| 2014 | 89.28 | 89.16 | 90.67 |
| 2015 | 89.32 | 88.94 | 90.37 |
| 2016 | 87.73 | 87.25 | 88.65 |
| 2017 | 87.65 | Note ...: not applicable | 87.65 |
|
... not applicable Sources: Statistics Canada, Postsecondary Student Information System (PSIS) and T1 Family File (T1FF). |
|||
The findings in Chart 1 imply that about 1 in 10 postsecondary students have not claimed credits in recent years, raising the question, “Are certain groups of students less likely to claim the credits than others?” Female postsecondary students were slightly more likely to claim the credits than their male counterparts (88.8% vs 86.3% based on 2017 data), but a more relevant dimension for policy is parental income as it is more closely tied to student financial aid parameters.
Youth from the bottom 20% of the parental income distribution were less likely to claim postsecondary education credits than others
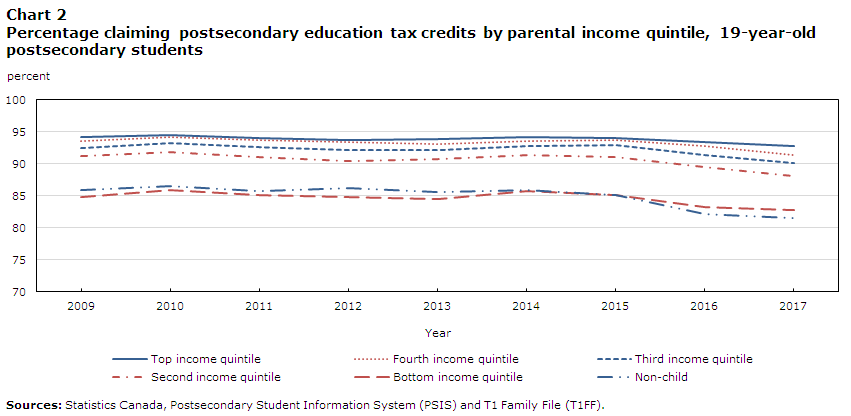
There was a clear income divide in postsecondary education claim rates among 19-year-old postsecondary students who filed their taxes in 2017. While 92.8% of postsecondary students in the top quintile (20%) of the parental income distribution claimed the credits, 82.8% of their counterparts in the bottom quintile of the distribution did the same (Chart 2).Note
While higher-income groups were more likely to claim the credits, the differences in the claim rates were generally small among youth in the top 80% of the income distribution in 2017 (ranging from 88.1% to 92.8% and rising slightly with each quintile). Thus, youth in the bottom income quintile stood apart from their higher-income counterparts with regard to their propensity to claim education credits.Note Youth who were not matched to a parent (i.e., non-children) were generally about as likely to claim the credits as youth in the bottom income quintile (81.6% in 2017).
These differences in postsecondary education claim rates across the income distribution were quite consistent between 2009 and 2017. Furthermore, the claim rates were virtually unchanged when late filers were included in the analysis.
Data table for Chart 2
| Non-child | Bottom income quintile | Second income quintile | Third income quintile | Fourth income quintile | Top income quintile | |
|---|---|---|---|---|---|---|
| percent | ||||||
| 2009 | 85.95 | 84.85 | 91.16 | 92.47 | 93.62 | 94.15 |
| 2010 | 86.45 | 85.86 | 91.80 | 93.22 | 94.17 | 94.44 |
| 2011 | 85.76 | 85.08 | 91.12 | 92.57 | 93.63 | 94.03 |
| 2012 | 86.22 | 84.81 | 90.48 | 92.19 | 93.36 | 93.63 |
| 2013 | 85.56 | 84.46 | 90.80 | 92.10 | 93.09 | 93.80 |
| 2014 | 85.85 | 85.77 | 91.36 | 92.70 | 93.62 | 94.15 |
| 2015 | 85.10 | 85.07 | 91.07 | 92.96 | 93.64 | 94.00 |
| 2016 | 82.19 | 83.18 | 89.48 | 91.38 | 92.79 | 93.35 |
| 2017 | 81.58 | 82.83 | 88.14 | 90.11 | 91.32 | 92.83 |
| Sources: Statistics Canada, Postsecondary Student Information System (PSIS) and T1 Family File (T1FF). | ||||||
Postsecondary students from lower-income families forewent tax savings by not claiming the credits
Of course, it is possible that the non-claimants simply had no incentive to claim the credits.Note However, this does not appear to be the case when looking at mean individual taxes paid among 19-year-old postsecondary students who were from families in the bottom income quintile in 2009 (Chart 3): $214 for those who did not claim the credits, compared with $62 for those who did claim the credits. Thus, those who did not claim the credits in 2009 could have claimed a portion of their credits to eliminate their tax obligations for that year and carried forward the remainder to a future year. In fact, by 2012, mean individual taxes paid by these individuals were above $800, suggesting an even larger incentive to applying the credits against taxes in that year through the carry-forward option (which would have first required applying the credits towards their 2009 tax obligations).Note Mean individual taxes paid continued to increase after 2012, as many postsecondary students graduated and entered the labour market full time. However, claiming the 2009 education credits would have required filling out a Schedule 11 from the 2009 tax year (several years earlier).
These results suggest that lower-income postsecondary students who did not claim education credits forewent some income tax savings to the extent that can be observed in the data based on late tax filing (i.e., up to three years).

Data table for Chart 3
| Claimed credits | Did not claim credits | Claimed credits (parental taxes paid) | Did not claim credits (parental taxes paid) | |
|---|---|---|---|---|
| mean individual taxes paid (2017 dollars) | ||||
| 2009 | 62 | 214 | 609 | 665 |
| 2010 | 129 | 225 | 2092 | 1989 |
| 2011 | 417 | 501 | 2908 | 2730 |
| 2012 | 829 | 840 | 3553 | 2618 |
| 2013 | 1456 | 1420 | 4458 | 3590 |
| 2014 | 2526 | 2292 | 5393 | 6586 |
| 2015 | 3750 | 3225 | 6776 | 5351 |
| 2016 | 4818 | 4273 | 7671 | 6218 |
| 2017 | 5899 | 4788 | 9381 | 7927 |
| Sources: Statistics Canada, Postsecondary Student Information System (PSIS) and T1 Family File (T1FF). | ||||
The gap in postsecondary enrolment rates across levels of parental income became narrower between 2009 and 2017
During the study period—2009 to 2017—the postsecondary enrolment gap between higher- and lower-income youth narrowed somewhat. This was true whether tax data or postsecondary registration data were used. However, the magnitude of the levels and trends in the enrolment gap varied somewhat according to the data source.
For example, when postsecondary enrolment was based on the presence of postsecondary education credits in tax data (T1FF), 78.4% of 19-year-olds with parents in the top income quintile enrolled in postsecondary education in 2017, compared with 44.0% of youth in the bottom income quintile—a gap of 34.3 percentage points (Chart 4). In general, postsecondary enrolment rates based on tax data are higher than rates based on postsecondary registration data (PSIS) that have been linked to the T1FF. This is largely because the PSIS captures enrolments at a snapshot date, varying between September 30 and December 1, depending on the institution. It could also partially be explained by the lack of private enrolments in the PSIS. In contrast, tax data can potentially capture any enrolment during the tax year. For example, in 2017, 56.5% of 19-year-olds who filed taxes were enrolled in postsecondary education according to tax data, compared with 52.8% according to postsecondary registration data. This gap would be somewhat larger if all postsecondary students claimed education credits, as suggested by Chart 1. Moreover, Chart 2 suggested that the claim rates were somewhat lower among youth in the bottom income quintile. The implication is that tax data may overstate the gap in postsecondary enrolment across income groups. This is indeed the case when comparing the PSIS and the T1FF in Chart 4. According to postsecondary registration data, the gap in enrolment rates between youth in the top and the bottom of the income distribution was 28.7 percentage points in 2017 (72.1% and 43.4%, respectively), compared with 34.3 percentage points according to tax data.Note

Data table for Chart 4
| Non-child | Bottom income quintile |
Second income quintile |
Third income quintile |
Fourth income quintile |
Top income quintile |
|
|---|---|---|---|---|---|---|
| percent | ||||||
| T1 Family File | 44.53 | 44.02 | 55.40 | 62.12 | 69.09 | 78.35 |
| Postsecondary Student Information System | 42.73 | 43.37 | 50.63 | 56.61 | 63.43 | 72.12 |
| Sources: Statistics Canada, Postsecondary Student Information System (PSIS) and T1 Family File (T1FF). | ||||||
According to Chart 5, postsecondary registration data also suggest a slightly larger decline in the income gap in postsecondary enrolment, from 31.5 percentage points in 2009 to 28.7 percentage points in 2017 (a drop of 2.8 percentage points). In contrast, the income gap in enrolment rates based on tax data fell from 36.4 percentage points in 2009 to 34.3 percentage points in 2017 (a drop of 2.1 percentage points). The difference in this trend could be more than fully explained by a substantially larger increase in the enrolment rate of 19-year-old youth in the bottom income quintile, according to the PSIS—from 37.6% in 2009 to 43.4% in 2017. The magnitude of this trend was less evident in tax data, as the rate increased from 42.6% to 44.0% over the same period.

Data table for Chart 5
| Top income quintile (T1FF) | Bottom income quintile (T1FF) | Top income quintile (PSIS) | Bottom income quintile (PSIS) | |
|---|---|---|---|---|
| percent | ||||
| 2009 | 79.04 | 42.62 | 69.15 | 37.61 |
| 2010 | 79.63 | 43.85 | 70.71 | 39.43 |
| 2011 | 79.48 | 44.18 | 70.67 | 40.06 |
| 2012 | 78.95 | 45.30 | 69.96 | 40.64 |
| 2013 | 78.80 | 45.75 | 71.87 | 43.75 |
| 2014 | 78.92 | 46.61 | 71.60 | 44.00 |
| 2015 | 79.06 | 46.07 | 72.52 | 44.14 |
| 2016 | 79.40 | 45.52 | 73.63 | 44.13 |
| 2017 | 78.35 | 44.02 | 72.12 | 43.37 |
| Sources: Statistics Canada, Postsecondary Student Information System (PSIS) and T1 Family File (T1FF). | ||||
Chart 6 shows the full set of enrolment rates according to postsecondary registration data. Interestingly, among youth who were matched to a parent, the enrolment rate rose by roughly the same amount with each income category. No single income group stood far apart from adjacent income groups.Note

Data table for Chart 6
| Non-child | Bottom income quintile | Second income quintile | Third income quintile | Fourth income quintile | Top income quintile | |
|---|---|---|---|---|---|---|
| percent | ||||||
| 2009 | 30.61 | 37.61 | 44.94 | 51.00 | 58.85 | 69.15 |
| 2010 | 32.11 | 39.43 | 46.35 | 53.16 | 60.56 | 70.71 |
| 2011 | 33.28 | 40.06 | 46.79 | 53.01 | 60.92 | 70.67 |
| 2012 | 34.01 | 40.64 | 47.06 | 53.10 | 60.02 | 69.96 |
| 2013 | 37.04 | 43.75 | 51.10 | 56.22 | 63.17 | 71.87 |
| 2014 | 38.25 | 44.00 | 50.71 | 56.93 | 63.61 | 71.60 |
| 2015 | 40.58 | 44.14 | 51.76 | 57.21 | 64.22 | 72.52 |
| 2016 | 42.63 | 44.13 | 51.89 | 57.93 | 65.13 | 73.63 |
| 2017 | 42.73 | 43.37 | 50.63 | 56.61 | 63.43 | 72.12 |
| Sources: Statistics Canada, Postsecondary Student Information System (PSIS) and T1 Family File (T1FF). | ||||||
Youth in the top income quintile twice as likely to enrol in a degree program as youth in the bottom income quintile
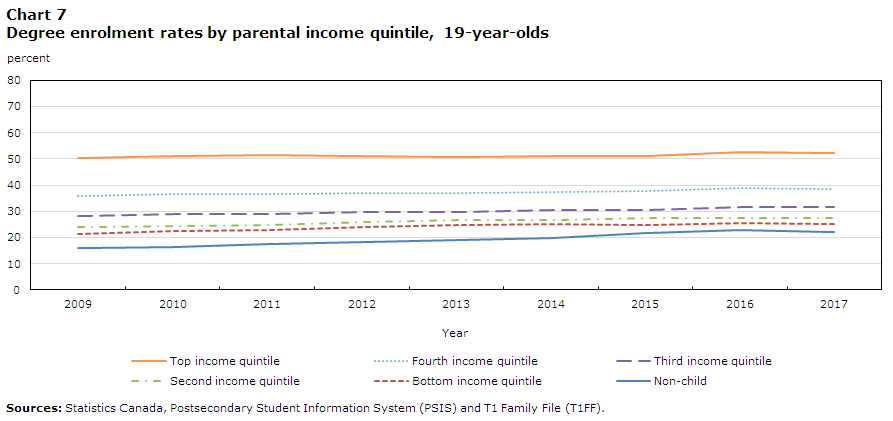
So far, the study has considered enrolment in any form of postsecondary program. As noted by Frenette (2014 and 2019a), degree holders generally earn more than other postsecondary graduates. In 2017, 52.3% of 19-year-old youth in the top income quintile were enrolled in a degree program from a university or college (Chart 7). This was slightly more than twice as high as the share of their counterparts in the bottom income quintile who were enrolled in such a program (25.0%). Individuals who were not matched to a parent were even less likely to register for a degree program (22.1%).
While the absolute gap in degree enrolment between youth in the top and the bottom income quintiles (27.3 percentage points) was about the same as the absolute gap in postsecondary enrolment (from charts 5 and 6, 28.7 percentage points), the relative gap in degree enrolment was much larger than the relative gap in postsecondary enrolment in 2017. Indeed, youth in the bottom income quintile were 52.3% less likely to enrol in a degree program than their counterparts in the top income quintile, whereas the gap was 39.9% for postsecondary enrolment.
The gap in degree enrolment between youth in the top and the bottom of the income distribution narrowed very slightly between 2009 and 2017. Nevertheless, degree enrolment has increased for youth in all five income quintiles. For example, the degree enrolment rate increased from 21.3% in 2009 to 25.0% in 2017 for youth in the bottom income quintile.
Data table for Chart 7
| Non-child | Bottom income quintile | Second income quintile | Third income quintile | Fourth income quintile | Top income quintile | |
|---|---|---|---|---|---|---|
| percent | ||||||
| 2009 | 15.92422 | 21.27846 | 23.91033 | 28.08882 | 35.75274 | 50.16586 |
| 2010 | 16.51753 | 22.42785 | 24.39353 | 28.80963 | 36.62691 | 50.91512 |
| 2011 | 17.54422 | 23.03784 | 24.84655 | 29.02655 | 36.65188 | 51.40834 |
| 2012 | 18.36466 | 24.08585 | 25.71952 | 29.80216 | 37.06715 | 51.15293 |
| 2013 | 19.20444 | 24.61449 | 26.72718 | 29.85433 | 36.80794 | 50.73304 |
| 2014 | 19.97617 | 25.07892 | 26.71151 | 30.62894 | 37.44945 | 50.94931 |
| 2015 | 21.55143 | 24.88347 | 27.32803 | 30.63943 | 37.55593 | 51.03649 |
| 2016 | 22.88889 | 25.36131 | 27.49297 | 31.75820 | 38.78735 | 52.58098 |
| 2017 | 22.05061 | 24.96950 | 27.41523 | 31.59375 | 38.32842 | 52.31935 |
| Sources: Statistics Canada, Postsecondary Student Information System (PSIS) and T1 Family File (T1FF). | ||||||
Ontario and British Columbia most equitable provinces for postsecondary enrolment based on parental income, but Nova Scotia tops among third-generation Canadians or more
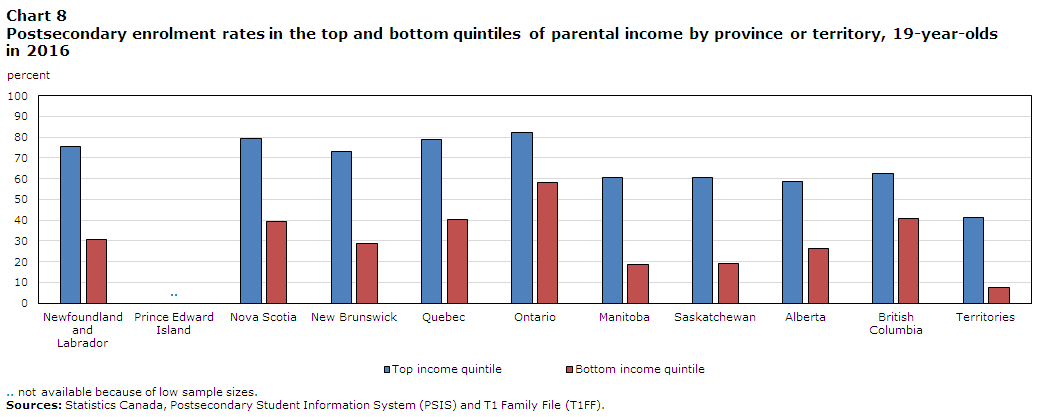
How do postsecondary enrolment patterns vary by province or territory? Among the full sample of 19-year-old tax filers, Ontario was the most equitable province or territory for overall postsecondary enrolment, based on parental income.Note Specifically, 82.1% of 19-year-olds in the top income quintile living in Ontario were enrolled in postsecondary education in 2016, compared with 58.1% of their counterparts in the bottom income quintile (29.3% lower).Note British Columbia was not far behind, with a 34.4% gap between youth in the bottom and top income quintiles. The relative gaps in enrolment rates were considerably higher in all other provinces and territories, ranging from 49.1% in Quebec to 81.8% in the territories (including Yukon, the Northwest Territories and Nunavut).Note Not far ahead of the territories were Manitoba (69.4%) and Saskatchewan (68.4%).Note
Data table for Chart 8
| Top income quintile | Bottom income quintile | |
|---|---|---|
| percent | ||
| Newfoundland and Labrador | 75.41568 | 30.88858 |
| Prince Edward Island | Note ..: not available for a specific reference period | Note ..: not available for a specific reference period |
| Nova Scotia | 79.13043 | 39.46801 |
| New Brunswick | 72.96552 | 28.80325 |
| Quebec | 78.81195 | 40.09601 |
| Ontario | 82.14218 | 58.05281 |
| Manitoba | 60.5548 | 18.55019 |
| Saskatchewan | 60.59736 | 19.16714 |
| Alberta | 58.49772 | 26.14796 |
| British Columbia | 62.31758 | 40.8587 |
| Territories | 41.46341 | 7.56303 |
|
.. not available for a specific reference period Sources: Statistics Canada, Postsecondary Student Information System (PSIS) and T1 Family File (T1FF). |
||
The main driver behind these gaps was the provincial or territorial variation in enrolment rates among youth in the bottom income quintile. At the top end, 58.1% of 19-year-olds in the bottom income quintile living in Ontario were enrolled in postsecondary education in 2016. This was actually higher than the enrolment rate among 19-year-olds in the top income quintile living in the territories, and almost as high as 19-year-olds in the top income quintile living in Alberta, Manitoba and Saskatchewan. Quebec and British Columbia were second and third with regard to their enrolment rates among youth in the bottom income quintile, but both well behind Ontario, with 41.0% and 40.9%, respectively. At the other end of the spectrum are 19-year-olds in the bottom income quintile living in the territories, where 7.6% enrolled in postsecondary education, followed by Manitoba (18.6%) and Saskatchewan (19.2%).
In contrast, the regional differences in enrolment rates among youth in the top income quintile were much smaller and followed an east-west-north gradient. Rates were generally highest in the east, including Ontario (generally between 70% and 80%), followed by the west (about 60%), and finally the north, or the territories (about 40%).
While equity in postsecondary enrolment across the income distribution is highest in Ontario and British Columbia, it is worth noting that these two provinces are also those with the highest shares of immigrants. In general, immigrants earn less than their Canadian-born counterparts (Crossman, Hou and Picot 2021), yet their children are more likely to pursue a postsecondary education (Hou and Bonikowska 2016). In principle, this could at least partially explain why enrolment rates among youth in the bottom income quintile are highest in Ontario and British Columbia, as well as in Quebec (another substantial immigrant-receiving province), which ranked third in terms of overall relative equitable access.
Is this the case? To answer this question, it is necessary to compare provinces after removing immigrants and children of immigrants from the sample. This information is available in the 2016 Census, which has been linked to the PSIS and the T1FF. Table 1 contains three sets of results. The first set of results (“full sample”), derived from the full sample, is meant to reproduce the results in Chart 8. Since the 2016 Census was a 25% sample of the Canadian population, the sample is considerably smaller in Table 1 than in Chart 8. Consequently, the results for Newfoundland and Labrador, Prince Edward Island, New Brunswick, and the territories could not be shown. Nevertheless, for the remaining provinces, the enrolment rates by parental income quintile are more or less similar to what was shown in Chart 8.
| Full sample | Third-generation Canadians or more | First- or second-generation Canadians | |||||||
|---|---|---|---|---|---|---|---|---|---|
| Top income quintile | Bottom income quintile | Gap between bottom and top quintiles | Top income quintile | Bottom income quintile | Gap between bottom and top quintiles | Top income quintile | Bottom income quintile | Gap between bottom and top quintiles | |
| percent | |||||||||
| Province of residence | |||||||||
| Newfoundland and Labrador | Note ..: not available for a specific reference period | Note ..: not available for a specific reference period | Note ..: not available for a specific reference period | Note ..: not available for a specific reference period | Note ..: not available for a specific reference period | Note ..: not available for a specific reference period | Note ..: not available for a specific reference period | Note ..: not available for a specific reference period | Note ..: not available for a specific reference period |
| Prince -Edward -Island | Note ..: not available for a specific reference period | Note ..: not available for a specific reference period | Note ..: not available for a specific reference period | Note ..: not available for a specific reference period | Note ..: not available for a specific reference period | Note ..: not available for a specific reference period | Note ..: not available for a specific reference period | Note ..: not available for a specific reference period | Note ..: not available for a specific reference period |
| Nova Scotia | 80.6 | 45.5 | 43.6 | 82.4 | 44.4 | 46.1 | Note ..: not available for a specific reference period | Note ..: not available for a specific reference period | Note ..: not available for a specific reference period |
| New Brunswick | Note ..: not available for a specific reference period | Note ..: not available for a specific reference period | Note ..: not available for a specific reference period | Note ..: not available for a specific reference period | Note ..: not available for a specific reference period | Note ..: not available for a specific reference period | Note ..: not available for a specific reference period | Note ..: not available for a specific reference period | Note ..: not available for a specific reference period |
| Quebec | 79.2 | 41.0 | 48.3 | 78.1 | 29.3 | 62.5 | 84.8 | 55.3 | 34.7 |
| Ontario | 82.6 | 58.7 | 28.9 | 81.2 | 40.7 | 49.9 | 85.1 | 66.4 | 22.0 |
| Manitoba | 62.0 | 20.3 | 67.3 | 64.4 | 14.9 | 76.9 | Note ..: not available for a specific reference period | Note ..: not available for a specific reference period | Note ..: not available for a specific reference period |
| Saskatchewan | 66.4 | 18.9 | 71.5 | 65.4 | 16.8 | 74.4 | Note ..: not available for a specific reference period | Note ..: not available for a specific reference period | Note ..: not available for a specific reference period |
| Alberta | 56.9 | 28.9 | 49.1 | 53.9 | 18.1 | 66.4 | 65.0 | 40.0 | 38.4 |
| British Columbia | 62.7 | 43.3 | 31.0 | 60.3 | 21.6 | 64.1 | 66.6 | 52.8 | 20.8 |
|
.. not available because of low sample sizes Sources: Statistics Canada, Postsecondary Student Information System (PSIS), T1 Family File (T1FF) and Census of Population. |
|||||||||
When immigrants and children of immigrants are removed from the sample in the second set of results (“third-generation Canadians or more”), the relative enrolment gaps between youth in the top and bottom income quintiles increase in all provinces, but more so in British Columbia, Ontario, Alberta and Quebec. In this sample, the enrolment gap remains relatively low in Ontario, but it is now slightly lower in Nova Scotia. In the final set of results (“first- or second-generation Canadians”), the enrolment gaps in the four provinces that can be shown (Quebec, Ontario, Alberta and British Columbia) are much smaller. This suggests more parity with regard to postsecondary enrolment among immigrants and children of immigrants. This is most evident in British Columbia, where immigrants and children of immigrants in the bottom income quintile were 20.8% less likely to enrol in postsecondary education than their counterparts in the top income quintile. In contrast, the enrolment gap among third-generation Canadians or more in British Columbia was more than three times higher (64.1%).Note
Conclusion
Postsecondary students may claim postsecondary education tax credits, either for themselves or for a parent, a grandparent, a spouse or common-law partner, or the parent or grandparent of a spouse or common-law partner, during the year they enrolled or in a future year through the carry-forward option. Claiming the credits is costless, and the benefits can be substantial, as they work towards reducing taxes. However, claiming the credits may require awareness of their availability and knowledge of how they work. This article examined the extent to which postsecondary students claimed postsecondary education tax credits on their tax files based on postsecondary registration and tax data.
The results suggest that among 19-year-old postsecondary students who filed their taxes in 2017, about 9 in 10 claimed the credits. Students in the bottom quintile of the parental income distribution were somewhat less likely to claim the credits they were entitled to (roughly 8 in 10 did so). This suggests that tax data slightly overstate the gap in postsecondary enrolment rates across income categories, and this was confirmed by directly comparing enrolment rates in tax data and postsecondary registration data. Further analysis of postsecondary registration data also indicated that enrolment rates increased considerably between 2009 and 2017 among youth in the bottom income quintile—a fact that was far less evident when basing postsecondary enrolment on the presence of education tax credits. This led to a narrowing of the income–enrolment gradient over this time period. In relative terms, the gap in degree enrolment rates between youth in the top and the bottom income quintiles was larger than in the case of overall postsecondary enrolment. The study also found that postsecondary enrolment was most equitable (based on parental income) in Ontario and British Columbia, but this was largely because of the high concentration of immigrants and children of immigrants in those provinces (a group that tends to have below-average incomes, but above-average enrolment rates). Among third-generation Canadians or more, equity in postsecondary enrolment was highest in Nova Scotia, followed by Ontario.
The findings have important implications for the economic well-being of low-income youth and their families. For example, the evidence in this study suggests that lower-income postsecondary students forewent the tax savings generated from the education credits in the year when they enrolled or in a later year (when their tax obligations were greater). The education credits could also serve as an incentive to enrol in postsecondary education in the first place. However, the lower claim rates may signal a lack of awareness of the credits or of how they work to reduce taxes. If so, this could mean that the incentives are not fully transparent for lower-income youth.
The enrolment rates generated in this article were based on all 19-year-olds. Other data sources may enable the estimation of enrolment rates conditional on graduating from high school, and this may yield different results, depending on the propensity of youth from different income backgrounds to graduate from high school. Indeed, an earlier study based on survey data (Frenette 2007) found that 50% of 19-year-old high school graduates from families in the top income quartile had enrolled in university, compared with 31% of their counterparts in the bottom income quartile. Moreover, the study suggested that almost all of this gap could be attributed to differences in academic performance and parental influences, as opposed to financial constraints. Newly available data from British Columbia’s kindergarten to Grade 12 school system, which have been linked to the T1FF and the PSIS, could enable revisiting the work of Frenette (2007) with more recent data based on administrative sources.
References
Crossman, E., F. Hou, and G. Picot. 2021. “Are the gaps in labour market outcomes between immigrants and their Canadian-born counterparts starting to close?” Economic and Social Reports 1 (4). Statistics Canada Catalogue no. 36-28-0001.
Frenette, M. 2007. Why Are Lower-income Youth Less Likely to Attend University? Evidence from Academic Abilities, Parental Influences, and Financial Constraints. Analytical Studies Branch Research Paper Series, no. 295. Statistics Canada Catalogue no. 11FM0019. Ottawa: Statistics Canada.
Frenette, M. 2011. What Explains the Educational Attainment Gap Between Aboriginal and Non-Aboriginal Youth? Canadian Labour Market and Skills Researcher Network, Working Paper no. 278.
Frenette, M. 2014. An Investment of a Lifetime? The Long-term Labour Market Premiums Associated with a Postsecondary Education. Analytical Studies Branch Research Paper Series, no. 359. Statistics Canada Catalogue no. 11F0019M. Ottawa: Statistics Canada.
Frenette, M. 2017. Postsecondary Enrolment by Parental Income: Recent National and Provincial Trends. Economic Insights,no. 70. Statistics Canada Catalogue no. 11-626-X. Ottawa: Statistics Canada.
Frenette, M. 2019a. Are the Career Prospects of Postsecondary Graduates Improving? Analytical Studies Branch Research Paper Series, no. 415. Statistics Canada Catalogue no. 11F0019M. Ottawa: Statistics Canada.
Frenette, M. 2019b. Do Youth from Lower- and Higher-income Families Benefit Equally from Postsecondary Education? Analytical Studies Branch Research Paper Series, no. 424. Statistics Canada Catalogue no. 11F0019M. Ottawa: Statistics Canada.
Frenette, M., D. Green, and G. Picot. 2004. Rising Income Inequality in the 1990s: An Exploration of Three Data Sources. Analytical Studies Branch Research Paper Series, no. 219. Statistics Canada Catalogue no. 11FM0019. Ottawa: Statistics Canada.
Heckman, J.J., E. Humphries, and G. Veramendi. 2016. Returns to Education: The Causal Effects of Education on Earnings, Health, and Smoking. NBER Working Paper Series, no. 22291. Cambridge, Massachusetts: National Bureau of Economic Research.
Hou, F., and A. Bonikowska. 2016. Educational and Labour Market Outcomes of Childhood Immigrants by Admission Class. Analytical Studies Branch Research Paper Series, no. 377. Statistics Canada Catalogue no. 11FM0019. Ottawa: Statistics Canada.
Lemieux, T., and D. Card. 2001. “Education, earnings, and the ‘Canadian G.I. Bill’.” Canadian Journal of Economics 34 (2): 313–344.
Neill, C. 2007. Canada’s Tuition and Education Tax Credits. Montréal: The Canadian Millennium Scholarship Foundation.
Statistics Canada. 2016. Data Tables, 2016 Census. Statistics Canada Catalogue no. 98-400-X. Ottawa: Statistics Canada.
- Date modified: