
Economic and Social Reports
Recent developments in the Canadian economy: Fall 2021
DOI: https://doi.org/10.25318/36280001202101000002-eng
Skip to text
Text begins
This article provides an integrated summary of recent changes in output, consumer prices and employment. It also draws on new data sources designed to evaluate the economic conditions facing businesses as the COVID-19 pandemic continues to evolve. The article is based on data that are publicly available as of October 8, 2021.
Monthly information on government, business and financial market developments, including public health measures related to the pandemic, is available at Canadian Economic News (Statistics Canada n.d.). For an overview of social and economic developments during the first year of the pandemic, see COVID-19 in Canada: A One-year Update on Social and Economic Impacts (Statistics Canada 2021a).
Authors
Sean Clarke and Guy Gellatly are with the Strategic Analysis, Publications and Training Division, Analytical Studies and Modelling Branch, at Statistics Canada.
Overview
The pace of the economic recovery slowed during the first half of 2021 as supply chain disruptions and third wave restrictions weighed on activity. Consumer prices rose steadily during the first half, as gasoline, shelter, and durables put upward pressure on headline inflation. Employment fluctuated as public health measures tightened and eased, and then strengthened into the summer months before recovering to pre-pandemic levels in September. Job vacancies were at record levels in the second quarter, while labour shortages and rising input costs continue to cloud the business outlook. Household disposable income remained elevated during the first half as the savings rate held firm in double digit territory. Households added $1.3 trillion to their net worth over the first two quarters of 2021.
Real gross domestic product contracted on declines in exports and housing
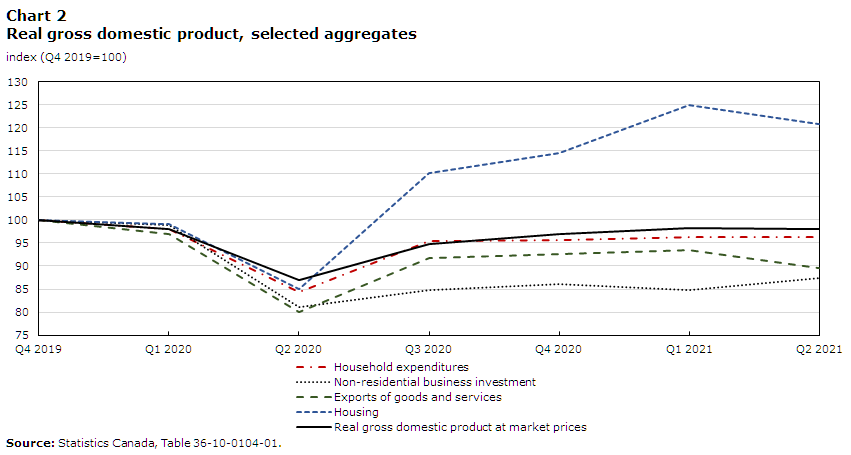
Real gross domestic product contracted 0.3% in the second quarter, after advancing 1.4% in the first. Lower export volumes coupled with a pullback in home resale activity contributed to the headline decrease, while business inventories, government current expenditures, and business outlays on machinery and equipment rose (Chart 1). Household spending edged up 0.1% despite lower outlays on goods. Total economic activity in the second quarter was 2.0% below pre-pandemic levels observed in late 2019 (Chart 2).

Data table for Chart 1
| Selected components | Q2 2021 | Q1 2021 |
|---|---|---|
| percentage point contribution | ||
| Imports - goods and services | 0.011 | -0.318 |
| Exports - goods and services | -1.210 | 0.241 |
| Investment in inventories | 0.688 | -0.179 |
| Government current expenditures | 0.322 | 0.369 |
| Business investment - machinery and equipment |
0.157 | -0.136 |
| Business investment - non-residential structures | 0.059 | 0.022 |
| Business investment - housing | -0.338 | 0.864 |
| Household expenditures | 0.030 | 0.353 |
| Gross domestic product at market prices | -0.289 | 1.354 |
|
Notes: Data on gross domestic product are quarter-over-quarter percent changes; all other data are percentage-point contributions to the quarterly change in real gross domestic product. Source: Statistics Canada, Table 36-10-0104-01. |
||
Data table for Chart 2
| Selected aggregates | Q4 2019 | Q1 2020 | Q2 2020 | Q3 2020 | Q4 2020 | Q1 2021 | Q2 2021 |
|---|---|---|---|---|---|---|---|
| index (Q4 2019=100) | |||||||
| Household expenditures | 100.0 | 98.1 | 84.3 | 95.4 | 95.6 | 96.2 | 96.3 |
| Non-residential business investment | 100.0 | 98.8 | 81.0 | 84.9 | 86.1 | 84.8 | 87.3 |
| Exports of goods and services | 100.0 | 96.8 | 80.0 | 91.7 | 92.6 | 93.4 | 89.6 |
| Housing | 100.0 | 99.0 | 84.9 | 110.1 | 114.5 | 125.0 | 120.9 |
| Real gross domestic product at market prices | 100.0 | 98.0 | 86.9 | 94.8 | 96.9 | 98.3 | 98.0 |
| Source: Statistics Canada, Table 36-10-0104-01. | |||||||
Export volumes fell 4.0% on lower shipments of motor vehicles and parts and energy products. Supply chain disruptions continued to impact automakers and parts suppliers, as auto-related exports in the second quarter were over one-quarter below pre-pandemic levels. Overall export volumes were 10.4% below levels observed in the fourth quarter of 2019.
Business investment in housing declined 3.3% in the second quarter, as home resale activity fell by double digits following three quarters of strong growth. Outlays on new construction and renovations continued to advance. Total outlays on housing in the quarter were 20.9% above pre-COVID levels.
Business outlays on machinery and equipment (M&E) rose 5.7%, the third increase in the last four quarters, while outlays on non-residential structures also strengthened. Nonetheless, combined business investment in non-residential structures and M&E was 12.7% below pre-COVID levels. Outlays on intellectual property, led by higher spending on research and development, advanced for the fourth consecutive quarter.
Household expenditures edged up 0.1%, supported by higher spending on services. Outlays on goods fell for first time since the second quarter of 2020, but remained 4.5% above pre-pandemic levels. Total household expenditures were 3.7% below levels observed in late 2019, reflecting lower spending on services during the pandemic.
Labour productivity in the business sector rose 0.6% in the second quarter as reductions in hours worked exceeded declines in output. This followed three consecutive quarter-over-quarter decreases as hours worked ramped up more swiftly than output levels in the wake of the initial lockdowns. Business productivity in the second quarter was 2.6% above pre-pandemic levels.Note
In the retail sector, productivity remained about 10% above pre-pandemic levels as the gradual recovery in hours worked has lagged well behind the v-shaped recovery in output (retail volumes in the third quarter of 2020 had already surpassed pre-COVID levels). Productivity in accommodation and food services remained 20% below levels observed prior to the pandemic, despite a double-digit increase during the second quarter.Note
Business openings fell as third wave restrictions tightened
Business openings declined throughout the second quarter as the number of reopenings fell. After decreasing 4.5% in April, openings fell 3.8% in May as tighter restrictions remained in effect in many jurisdictions across the country. In both months, the pullback was broad-based across industries. Openings fell for the third straight month in June (-1.1%).
Net entry—the number of monthly openings less closures—continued to trend down over the first half of 2021. Monthly openings during the first six months of the year averaged 43,800, compared with 50,500 during the second half of 2020. In contrast, monthly closures during the first half of 2021 averaged 40,800, up from 34,600 during the last six months of 2020.Note
As of May 2021, the number of active businesses had recovered to pre-COVID levels, as net gains in professional, science and technical services and construction offset net losses in other private services (which include personal services), retail trade, and accommodation and food services.
High contact services rallied as restrictions eased
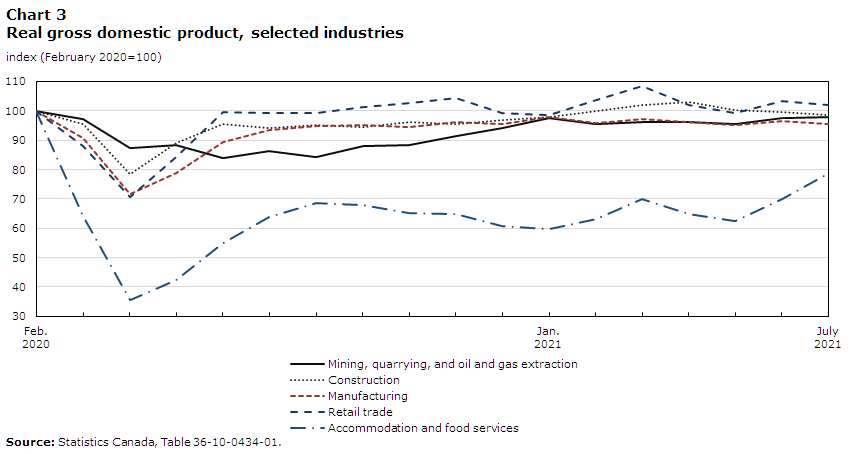
Following sustained gains in the wake of the initial lockdowns,Note economy wide output fell in April and May as businesses and households adapted to third wave restrictions (Chart 3). Lower activity in retail trade and accommodation and food services weighed heavily on output during the spring, while factory volumes also fell as the global shortage of microchips continued to impact production.Note
Data table for Chart 3
| Selected industries | Mining, quarrying, and oil and gas extraction | Construction | Manufacturing | Retail trade | Accommodation and food services |
|---|---|---|---|---|---|
| index (February 2020=100) | |||||
| 2020 | |||||
| February | 100.0 | 100.0 | 100.0 | 100.0 | 100.0 |
| March | 97.2 | 95.7 | 90.7 | 87.9 | 64.3 |
| April | 87.2 | 78.5 | 71.7 | 70.5 | 35.5 |
| May | 88.2 | 89.1 | 78.7 | 84.2 | 42.3 |
| June | 84.1 | 95.6 | 89.3 | 99.4 | 55.0 |
| July | 86.4 | 94.0 | 93.4 | 99.4 | 63.9 |
| August | 84.4 | 95.1 | 94.7 | 99.3 | 68.6 |
| September | 87.9 | 94.6 | 95.2 | 101.3 | 68.1 |
| October | 88.2 | 96.2 | 94.6 | 102.6 | 65.2 |
| November | 91.6 | 95.6 | 96.3 | 104.3 | 64.7 |
| December | 94.3 | 96.8 | 95.6 | 99.3 | 60.8 |
| 2021 | |||||
| January | 97.5 | 97.7 | 97.8 | 98.6 | 59.6 |
| February | 95.4 | 100.0 | 95.8 | 103.6 | 63.2 |
| March | 96.2 | 101.9 | 97.3 | 108.4 | 70.0 |
| April | 96.0 | 103.0 | 96.2 | 101.9 | 64.9 |
| May | 95.4 | 100.3 | 95.2 | 99.2 | 62.5 |
| June | 97.5 | 99.5 | 96.6 | 103.3 | 70.0 |
| July | 97.8 | 98.5 | 95.6 | 102.1 | 78.7 |
| Source: Statistics Canada, Table 36-10-0434-01. | |||||
Output partly rebounded in June, led by a double-digit increase in accommodation and food services as restrictions eased.Note Despite the gain, output in this industry remained 30% below levels observed prior to the pandemic. Retail volumes strengthened in June, but remained below levels observed in March prior to the onset of the third wave. Manufacturing also rebounded, supported by higher output at automakers and parts suppliers, fabricated metal manufacturers, and petroleum refineries. Output at auto plants, impacted by supply disruptions in recent months, remained over one-third below pre-pandemic levels at mid-year.
Activity at real estate agents and brokers scaled back in the spring after housing market activity peaked in March. In that month, activity at agents and brokers was 46% above pre-pandemic levels; consecutive declines from April to June brought activity to 12% above pre-COVID levels by mid-year. Residential construction followed a similar pattern—ramping up early in the year before pulling back in May and June. Nonetheless, housing construction at mid-year was 15% above levels observed prior to the onset of the pandemic.
Economy-wide output edged down 0.1% in July as drought conditions in Western Canada severely impacted crop production. Factory output and wholesale activity were down, while retail volumes declined as consumer dollars shifted toward out-of-the-home expenditures. Accommodation and food services posted a double-digit gain for the second consecutive month, while arts, entertainment and recreation continued to strengthen as restrictions on many activities eased. Air transportation also rose in July, as the passenger load factor rose above 50% for the first time since the start of the pandemic.Note
Rising input costs cloud the near term business outlook
New data from the Canadian Survey on Business Conditions for the third quarter, collected during July and early August, highlight overall improvements in the business outlook as third wave restrictions eased. Three quarters of businesses reported that they were somewhat or very optimistic about their outlook over the next 12 months, with half reporting that they could continue to operate at current revenue and expenditure levels for a year or more before considering laying off staff. Similarly, just over half of businesses (54%) reported that they could operate at current revenue and expenditure levels for at least a year before considering bankruptcy or closure, with a similar percentage indicating that they could take on additional debt. Less than 2% of businesses reported that they plan to close over the next 12 months.
However, rising input costs related to labour, capital, energy or raw materials continue to weigh on the near term outlook. Nearly four in ten businesses anticipate rising input costs to be an obstacle over the next three months, and over one in five businesses expect to raise prices during this period. Both numbers are similar to those reported in the second quarter (Chart 4).

Data table for Chart 4
| Anticipated business obstacles | Q2 2021 | Q3 2021 |
|---|---|---|
| percentage of businesses identifying as an obstacle | ||
| Rising cost of inputs | 37.8 | 38.5 |
| Recruiting skilled employees | 27.8 | 34.6 |
| Shortage of labour force | 23.8 | 30.3 |
| Cost of insurance | 26.3 | 25.3 |
| Retaining skilled employees | 22.1 | 24.5 |
| Transportation costs | 22.8 | 22.8 |
| Fluctuations in consumer demand | 26.7 | 22.6 |
|
Note: See Statistics Canada,Tables 33-10-0338-01 and 33-10-0364-01. Source: Canadian Survey on Business Conditions (CSBC), second and third quarters, 2021. |
||
Many businesses anticipate labour-related challenges over the near term. Three in ten businesses expect labour shortages to be an obstacle, up from 22% in the second quarter. And over one-third of businesses (+35%) anticipate challenges recruiting skilled employees, an increase of seven percentage points. Businesses responding to the third quarter survey were also slightly more likely to anticipate difficulties retaining skilled workers.
Eight percent of businesses surveyed during July and August expect to have more vacancies over the next three months. Job vacancy data for the second quarter highlight the robust demand for labour as businesses and workers continue to adjust to COVID-related restrictions. Vacancies were at a record high in second quarter, up 25.8% from levels reported in the second quarter of 2019.
Vacancies have risen sharply in health care and social assistance, construction, retail, manufacturing and accommodation and food services. The job vacancy rate stood at 4.6% in the second quarter, the highest rate since comparable data became available in 2015. Job vacancy rates in accommodation and food services and construction were 9.0% and 5.8%, respectively. Sixty percent of total vacancies in the second quarter required either a high school diploma or equivalent or no minimum level of education.
Consumer prices rose steadily during the first half of 2021
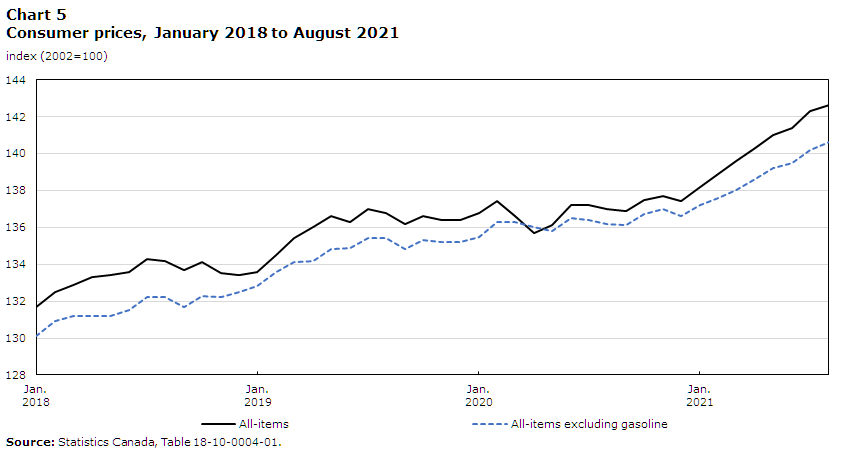
Headline consumer inflation accelerated to 4.1% in August, the fastest pace in over 18 years. The headline rate has been above the three percent mark for five consecutive months, reflecting upward pressure from gasoline, shelter, and consumer durables. Measured on a month-over-month basis, consumer prices have risen steadily from January to August, after exhibiting little upward momentum during second half of 2020 (Chart 5).
Data table for Chart 5
| All-items | All-items excluding gasoline | |
|---|---|---|
| index (2002=100) | ||
| 2018 | ||
| January | 131.7 | 130.1 |
| February | 132.5 | 130.9 |
| March | 132.9 | 131.2 |
| April | 133.3 | 131.2 |
| May | 133.4 | 131.2 |
| June | 133.6 | 131.5 |
| July | 134.3 | 132.2 |
| August | 134.2 | 132.2 |
| September | 133.7 | 131.7 |
| October | 134.1 | 132.3 |
| November | 133.5 | 132.2 |
| December | 133.4 | 132.5 |
| 2019 | ||
| January | 133.6 | 132.8 |
| February | 134.5 | 133.6 |
| March | 135.4 | 134.1 |
| April | 136.0 | 134.2 |
| May | 136.6 | 134.8 |
| June | 136.3 | 134.9 |
| July | 137.0 | 135.4 |
| August | 136.8 | 135.4 |
| September | 136.2 | 134.8 |
| October | 136.6 | 135.3 |
| November | 136.4 | 135.2 |
| December | 136.4 | 135.2 |
| 2020 | ||
| January | 136.8 | 135.5 |
| February | 137.4 | 136.3 |
| March | 136.6 | 136.3 |
| April | 135.7 | 136.0 |
| May | 136.1 | 135.8 |
| June | 137.2 | 136.5 |
| July | 137.2 | 136.4 |
| August | 137.0 | 136.2 |
| September | 136.9 | 136.1 |
| October | 137.5 | 136.7 |
| November | 137.7 | 137.0 |
| December | 137.4 | 136.6 |
| 2021 | ||
| January | 138.2 | 137.2 |
| February | 138.9 | 137.6 |
| March | 139.6 | 138.0 |
| April | 140.3 | 138.6 |
| May | 141.0 | 139.2 |
| June | 141.4 | 139.5 |
| July | 142.3 | 140.2 |
| August | 142.6 | 140.6 |
| Source: Statistics Canada, Table 18-10-0004-01. | ||
Gasoline prices continue to exert a substantial impact on the headline rate. Gasoline prices rose 32.5% on a year-over-year basis in August, the third consecutive month that annual increases have hovered around the thirty percent mark. This follows steeper year-over-year increases earlier in the spring as prices at the pump rebounded from sharp declines early in the pandemic. Gasoline prices had recovered to pre-pandemic levels by February 2021, and have risen steadily in recent months.
Higher housing-related costs have also contributed to the rise in headline inflation. Shelter costs accelerated notably during the spring and summer months, supported by higher homeowner replacement costs and other expenses for owned accommodation, which include commissions and legal fees on the sale of real estate. In August, shelter prices were 4.8% higher on a year-over-year basis as new home prices and borrowing costs continue to diverge. The homeowners’ replacement cost index, which partly reflects prices for new homes, has risen for eighteen consecutive months, while mortgage interest costs have fallen for sixteen straight months as homebuyers continue to take advantage of historically low interest rates.Note Price increases for rental accommodation, measured year-over-year, rose above the two percent mark from May to July, before slowing in August.
Global supply chain disruptions have put upward pressure on prices for consumer durables in recent months. The global shortage of semiconductor chips has impacted prices for passenger vehicles, which rose from 4.1% year-over-year in June to 7.2% in August, the largest annual increase in over two and a half decades. Supply chain bottlenecks, including higher shipping costs and import delays, also put upward pressure on prices for household appliances, which increased 5.3% in the twelve months to August.
Other price data highlight the rise in upstream prices during the first half of 2021. Prices for raw materials, measured month-over-month, rose steadily during the first six months of the year, and were 24% higher in August than at the end of 2020. Industrial product prices, which track the prices that manufacturers receive when products leave the factory gate, were up 12% over this period.
Employment strengthened in the wake of third wave restrictions
After combined losses of 275,000 during April and May, total employment rose by 415,000 during the late spring and summer months as third wave restrictions eased across the country. All of the cumulative gains from May to August were in service industries, over half of which reflected higher employment in accommodation and food services. Three quarters of the net increase over this three-month period was in part-time work, while over half the net increase reflected higher employment among 15 to 24 year-olds, led by gains among young women. By August, the employment rate among youth had essentially recovered to pre-pandemic levels (Chart 6).

Data table for Chart 6
| Males | Females | |
|---|---|---|
| percent | ||
| 2020 | ||
| February | 56.7 | 59.4 |
| March | 49.0 | 48.5 |
| April | 39.1 | 37.1 |
| May | 40.8 | 37.5 |
| June | 46.1 | 44.0 |
| July | 47.8 | 48.8 |
| August | 48.7 | 50.6 |
| September | 51.7 | 53.3 |
| October | 52.4 | 52.8 |
| November | 52.8 | 53.2 |
| December | 51.9 | 52.3 |
| 2021 | ||
| January | 50.3 | 49.2 |
| February | 52.8 | 51.2 |
| March | 55.3 | 54.0 |
| April | 52.8 | 52.1 |
| May | 52.6 | 51.0 |
| June | 54.9 | 56.4 |
| July | 56.5 | 57.7 |
| August | 56.0 | 59.3 |
| September | 56.0 | 60.0 |
| Source: Statistics Canada, Table 14-10-0287-01. | ||
With August’s headline increase, total employment had rebounded to within 1% of its pre-pandemic level (cumulative losses since the onset of the pandemic stood at 156,000 or -0.8%).Note The employment rate in August—the proportion of working age people who are employed—was 60.5%, down 1.3 percentage points from the rate in February 2020. The number of employed people who worked less than half of their usual hours in August remained about 30% higher than levels prior to the pandemic, while total hours worked remained 2.6% below (Chart 7).Note

Data table for Chart 7
| Employment losses | People working less than half their usual hours | Total | |
|---|---|---|---|
| thousands of persons | |||
| 2020 | |||
| February | 0 | 0 | 0 |
| March | 997 | 2,202 | 3,198 |
| April | 2,989 | 2,484 | 5,473 |
| May | 2,686 | 2,170 | 4,856 |
| June | 1,745 | 1,340 | 3,084 |
| July | 1,328 | 944 | 2,272 |
| August | 1,114 | 684 | 1,798 |
| September | 742 | 574 | 1,315 |
| October | 647 | 428 | 1,075 |
| November | 593 | 444 | 1,037 |
| December | 646 | 485 | 1,131 |
| 2021 | |||
| January | 858 | 529 | 1,388 |
| February | 599 | 406 | 1,005 |
| March | 296 | 247 | 543 |
| April | 503 | 534 | 1,037 |
| May | 571 | 617 | 1,188 |
| June | 340 | 341 | 681 |
| July | 246 | 225 | 471 |
| August | 156 | 243 | 399 |
| September | -1 | 218 | 217 |
|
Note: As of September 2021, total employment had recovered to pre-COVID levels. Source: Statistics Canada, Table 14-10-0287-01, special tabulation. |
|||
The unemployment rate fell to 7.1% in August, while the rate among youth held steady at 11.6% for the second consecutive month after hovering around 16 percent during April and May.
The number of workers experiencing long-term unemployment—over half of whom lost or left jobs during the pandemic—remains at elevated levels. In August, nearly 400,000 workers had been unemployed for 27 weeks or more, down from just over 500,000 at the start of the year. Despite declines as third wave restrictions eased, long-term unemployment remained over twice levels observed prior to the pandemic (Chart 8). Rising long term unemployment among core age workers accounted for almost 60% of the total increase, led by higher numbers among core-age men. Those experiencing long term unemployment accounted for 27.4% of all unemployed workers in August, up from 15.6% before the onset of the pandemic. Almost two thirds of the long term unemployed have been out of work for a year or more.

Data table for Chart 8
| Months since beginning of downturn | 1981/1982 recession | 1990/1992 recession | 2008/2009 recession | COVID-19 recession |
|---|---|---|---|---|
| index of unemployed persons who have been searching for work or on temporary layoff for 27 weeks or more |
||||
| 1 | 100.0 | 100.0 | 100.0 | 100.0 |
| 2 | 103.3 | 102.7 | 109.6 | 84.0 |
| 3 | 109.9 | 100.2 | 107.8 | 73.4 |
| 4 | 123.2 | 105.6 | 119.9 | 84.2 |
| 5 | 121.4 | 107.9 | 123.6 | 99.6 |
| 6 | 117.2 | 115.8 | 135.5 | 123.6 |
| 7 | 128.8 | 118.7 | 138.8 | 129.0 |
| 8 | 129.8 | 124.7 | 154.0 | 173.9 |
| 9 | 128.5 | 143.5 | 170.8 | 252.8 |
| 10 | 137.7 | 143.9 | 186.3 | 253.3 |
| 11 | 152.2 | 145.0 | 185.8 | 280.4 |
| 12 | 159.8 | 152.7 | 194.1 | 285.4 |
| 13 | 182.4 | 169.2 | 206.6 | 257.9 |
| 14 | 219.4 | 170.5 | 219.0 | 259.5 |
| 15 | 236.8 | 185.2 | 205.2 | 271.3 |
| 16 | 260.9 | 191.9 | 213.9 | 266.8 |
| 17 | 277.9 | 199.1 | 220.7 | 266.0 |
| 18 | 292.5 | 196.3 | 230.7 | 235.9 |
| 19 | 311.8 | 193.8 | 222.4 | 220.0 |
| 20 | 322.3 | 195.6 | 220.4 | 217.0 |
| 21 | 330.1 | 200.6 | 205.5 | Note ...: not applicable |
| 22 | 346.7 | 200.4 | 212.9 | Note ...: not applicable |
| 23 | 341.6 | 211.0 | 218.2 | Note ...: not applicable |
| 24 | 343.6 | 221.1 | 225.8 | Note ...: not applicable |
| 25 | 346.8 | 224.9 | 208.2 | Note ...: not applicable |
| 26 | 321.2 | 223.4 | 209.2 | Note ...: not applicable |
| 27 | 316.4 | 232.5 | 221.9 | Note ...: not applicable |
| 28 | 296.0 | 231.9 | 215.0 | Note ...: not applicable |
| 29 | 293.5 | 245.3 | 216.0 | Note ...: not applicable |
| 30 | 294.9 | 245.5 | 204.9 | Note ...: not applicable |
| 31 | 281.7 | 251.1 | 208.6 | Note ...: not applicable |
| 32 | 285.0 | 262.9 | 194.0 | Note ...: not applicable |
| 33 | 293.5 | 254.4 | 221.4 | Note ...: not applicable |
| 34 | 281.4 | 256.0 | 208.4 | Note ...: not applicable |
| 35 | 286.9 | 259.3 | 202.7 | Note ...: not applicable |
| 36 | 301.4 | 265.6 | 200.5 | Note ...: not applicable |
| 37 | 294.2 | 256.1 | 202.1 | Note ...: not applicable |
| 38 | 292.7 | 266.2 | 200.5 | Note ...: not applicable |
| 39 | 280.2 | 265.1 | 212.9 | Note ...: not applicable |
| 40 | 284.5 | 271.3 | 201.6 | Note ...: not applicable |
| 41 | 287.7 | 261.5 | 197.9 | Note ...: not applicable |
| 42 | 288.8 | 259.9 | 177.7 | Note ...: not applicable |
| 43 | 285.2 | 264.4 | 176.4 | Note ...: not applicable |
| 44 | 273.0 | 265.1 | 185.2 | Note ...: not applicable |
| 45 | 283.0 | 258.4 | 162.1 | Note ...: not applicable |
| 46 | 294.2 | 255.7 | 179.7 | Note ...: not applicable |
| 47 | 283.8 | 257.9 | 187.6 | Note ...: not applicable |
| 48 | 275.5 | 236.3 | 179.2 | Note ...: not applicable |
| 49 | 274.7 | 252.9 | 187.0 | Note ...: not applicable |
| 50 | 258.1 | 249.2 | 186.9 | Note ...: not applicable |
|
... not applicable Note: Index begins in the month of peak employment immediately prior to each economic downturn. Source: Statistics Canada, Table 14-10-0342-01. |
||||
Employment recovered to pre-pandemic levels in September
Employment rose by 157,000 in September, the fourth consecutive monthly increase in the wake of third wave restrictions. All of the net increase in September was in full-time work, led by gains among core-age women. Higher employment in public administration, information, cultural and recreation services, and professional, scientific and technical services supported the headline increase.
The unemployment rate fell to 6.9% in September, the lowest rate since the onset of the pandemic. The unemployment rate among core-age workers edged down to 5.9%, while the rate among youth declined to 11.3%.
The employment rate increased to 60.9% in September, 0.9 percentage points below its pre-pandemic benchmark. Employment rates among young and core-age women were both above pre-COVID levels, while rates among young and core-age men remained below levels reported in February 2020.
The number of employed people who worked less than half of their usual hours in September remained elevated (+218,000) relative to pre-pandemic levels, while total hours worked remained 1.5% below.
With September’s headline increase, total employment has recovered to its pre-pandemic level. Full-time employment has also fully recovered, as have levels among private and public sector employees. The number of women working full-time in September was 116,000 above pre-pandemic levels, while 107,000 fewer men were working full time.
While total employment has recovered, sizable differences in the pace of the recovery remain apparent across industries. Cumulative employment losses in accommodation and food services since the onset of the pandemic stood at 180,000 as of September, while cumulative losses in other private services (which include personal services) were 96,000. In contrast, employment in professional, scientific and technical services has risen by 183,000 since February 2020, while levels in public administration have increased by 108,000.
Household saving remains in double-digit territory
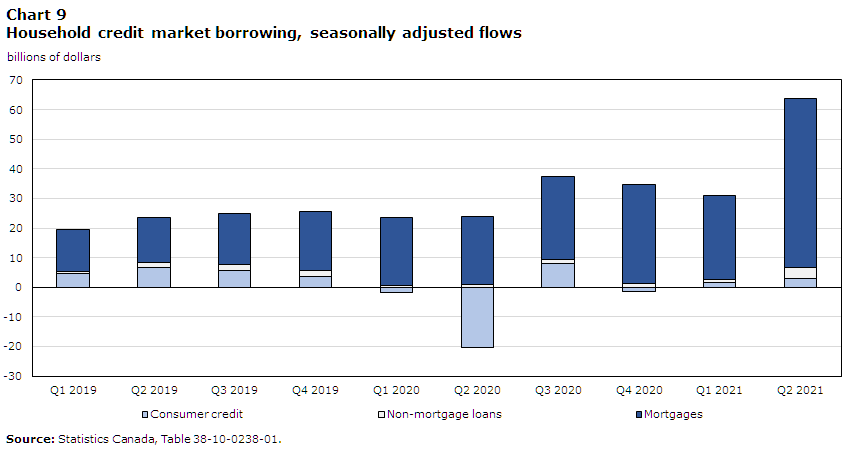
Household disposable income, supported by increases in employee compensation and government transfers, rose 2.2% in the second quarter, outpacing the modest gain in consumption. As a result, the household savings rate rose to 14.2%, marking its fifth consecutive quarter in double digit territory.
Data table for Chart 9
| Q1 2019 | Q2 2019 | Q3 2019 | Q4 2019 | Q1 2020 | Q2 2020 | Q3 2020 | Q4 2020 | Q1 2021 | Q2 2021 | |
|---|---|---|---|---|---|---|---|---|---|---|
| billions of dollars | ||||||||||
| Consumer credit | 4.6 | 6.7 | 5.7 | 3.7 | -1.9 | -20.2 | 8.1 | -1.3 | 1.5 | 2.9 |
| Non-mortgage loans | 0.7 | 1.6 | 1.8 | 1.8 | 0.6 | 0.8 | 1.1 | 1.3 | 1.2 | 3.7 |
| Mortgages | 14.1 | 15.2 | 17.3 | 20.0 | 23.0 | 23.2 | 28.3 | 33.3 | 28.3 | 57.2 |
| Source: Statistics Canada, Table 38-10-0238-01. | ||||||||||
Household disposable income in the quarter was 12.8% above pre-pandemic levels. Mortgage borrowing rose at a record pace, while non-mortgage borrowing also strengthened (Chart 9).Note Household debt-to-income and debt service ratios remained below pre-pandemic levels during the first two quarters of 2021 as household net worth, the value of assets less liabilities, rose by $1.3 trillion (+10.1%). Bolstered by higher equities and rising housing values, household net worth has risen by $2.5 trillion (+21.7%) since the onset of the pandemic.
References
Daoust, M., and M. Hoffarth. 2021. Trends in household non-mortgage loans: The evolution of Canadian household debt before and during COVID-19. Analysis in Brief. Catalogue no. 11-621-M, August. Ottawa: Statistics Canada.
Frenette, M., and R. Morissette. 2021. “Job security in the age of artificial intelligence and potential pandemics.” Economic and Social Reports 1 (6) (June 23). Canada Catalogue no. 36-28-0001. Ottawa: Statistics Canada.
Lafrance-Cooke, A. 2021. “Starting a business in a pandemic: The experiences of businesses created during COVID-19.” Economic and Social Reports 1 (7) (July 28). Catalogue no. 36-28-0001. Ottawa: Statistics Canada.
Leung, D. 2021. “Characteristics of businesses that closed during the COVID-19 pandemic in 2020.” Economic and Social Reports 1 (3) (March 24). Catalogue no. 36-28-0001. Ottawa: Statistics Canada.
Sood, S. 2021. Impact of COVID-19 on food services and drinking places, first quarter of 2021. StatCan COVID-19: Data to Insights for a Better Canada. Catalogue no. 45-28-0001, March 18. Ottawa: Statistics Canada.
Statistics Canada. n.d. Canadian Economic News. Last updated September 9, 2021. Available at: https://www.statcan.gc.ca/eng/dai/btd/cen/index#census (accessed September 28, 2021).
Statistics Canada. 2021a. COVID-19 in Canada: A One-year update on Social and Economic Impacts. Catalogue no. 11-631-X, March 11. Ottawa: Statistics Canada. Available at: https://www150.statcan.gc.ca/n1/pub/11-631-x/11-631-x2021001-eng.htm (accessed September 28, 2021).
Statistics Canada. 2021b. “Monthly civil aviation statistics, July 2021.” The Daily. September 27. Statistics Canada Catalogue no. 11-001-X. Available at: https://www150.statcan.gc.ca/n1/daily-quotidien/210927/dq210927d-eng.htm (accessed November 13, 2021).
Tam, S., S. Sood, and C. Johnston. Impact of COVID-19 on businesses in retail trade, third quarter of 2021. StatCan COVID-19: Data to Insights for a Better Canada. Catalogue no. 45-28-0001, September 9. Ottawa: Statistics Canada.
Wang, W. 2021. “Impacts of the COVID-19 pandemic on productivity growth in Canada.” Economic and Social Reports 1 (5) (May 26). Catalogue no. 36-28-0001. Ottawa: Statistics Canada.
- Date modified: