
Economic and Social Reports
Indigenous and non-Indigenous early learning and child care workers in Canada
DOI: https://doi.org/10.25318/36280001202100800005-eng
Skip to text
Text begins
Abstract
This study examines the sociodemographic and employment characteristics of early learning and child care (ELCC) workers who are First Nations people, Métis or Inuit. Data from the 2016 Census long-form questionnaire were used to study two occupational groups—early childhood educators and assistants (ECEAs) and child care providers (CCPs). Comparisons were also made with non-Indigenous ELCC workers in the same occupational groups. The study finds that First Nations, Métis and Inuit ECEAs and CCPs were more likely to be younger than their non-Indigenous counterparts. Additionally, a higher proportion First Nations ECEAs and CCPs were men than among non-Indigenous ECEAs and CCPs. Both First Nations and Inuit ECEAs and CCPs were less likely to work full-time hours compared with non-Indigenous ECEAs and CCPs. Differences were also observed across industry sectors.
Authors
Kristyn Frank is with the Centre for Indigenous Statistics and Partnerships, Social Data Insights, Integration and Innovation Brach and Rubab Arim is with the Social Analysis and Modelling Division, Analytical Studies and Modelling Branch, at Statistics Canada.
Introduction
Researchers have found that attending early learning and child care (ELCC) programs is associated with better cognitive and developmental outcomes for young children and longer-term educational outcomes (Elek et al. 2020). Among Indigenous children, early childhood programs that focus on their community’s traditional cultural practices, identity and language have been found to act as protective factors, improving children’s language abilities and cultural pride (Elek et al. 2020; Morcom and Roy 2019). Educators who are part of Indigenous children’s own communities can play an important role in providing them with early learning experiences that reflect their cultural heritage and traditions (Anderson, n.d.). However, there is a shortage of Indigenous workers trained in early childhood education in Canada, partly because of challenges they face in acquiring training, such as costs, entrance requirements and residence in remote areas with restricted technology (Greenwood, de Leeuw and Ngaroimata Fraser 2007; Manitoba Moon Voices, Inc. 2017).
While Indigenous ELCC workers play a key role in the early learning experiences of Indigenous children, little is known about the characteristics of these workers. This is primarily because of data limitations, such as small sample sizes, which prevent the dissemination of detailed information on First Nations, Métis and Inuit workers within specific occupational groups in Canada. The purpose of this study was to address this gap by using data from the 2016 Census long-form questionnaire. More specifically, sociodemographic and employment characteristics of Indigenous ELCC workers who identified themselves as First Nations people, Métis or Inuit are examined. Indigenous people residing on reserve or off reserve are included in the sample. Information about the sociodemographic and employment characteristics of non-Indigenous ELCC workers is also presented.
ELCC workers provide services related to the education and care of young children. Within this study, the term “early learning and child care workers” refers to two occupational groups in particular—early childhood educators and assistants (ECEAs) and child care providers (CCPs). These occupational groups are defined according to the 2016 National Occupational Classification (NOC), Canada’s national system for describing occupations.Note While some researchers consider these occupations as part of a broader workforce of early childhood education (e.g., Beach et al. 2004), these two occupations were selected for analysis because the main objective of this study was to focus on individuals working with preschool-aged children.
Generally, ECEAs are defined as individuals who “plan, organize and implement programs for children” and primarily work in daycare centres, kindergartens and agencies where early childhood education services are provided (Statistics Canada 2018, 293).Note The work activities of ECEAs can also include assessing the abilities and needs of children and discussing concerns with parents and other staff.
CCPs are defined as workers who care for children on an ongoing or short-term basis, performing tasks such as supervising, bathing, and dressing infants and children; planning and preparing meals; and overseeing children’s activities. While the 2016 NOC classifies this group as “home child care providers,” suggesting that they work in private households, these workers may also be employed in child care agencies or be self-employed (Statistics Canada 2018). Therefore, this study instead uses the term child care providers (CCPs) to refer to this group of workers.Note
Previous research has primarily examined workers who provide these services as one broad group, or focused on ECEAs specifically. However, important differences exist between those who primarily provide early learning services and those who primarily provide caregiving services (Centre for Spatial Economics 2009). Therefore, this study presents results for ECEAs and CCPs separately, with a particular focus on differences between First Nations, Métis, Inuit and non-Indigenous ELCC workers within these occupations.
Data
This study uses the 25% microdata sample of the 2016 Census of Population. These data are from the long-form census questionnaire and provide a range of sociodemographic, educational and employment information on the Canadian population.
The analysis focuses on First Nations, Métis, InuitNote Note and non-Indigenous workers who were employed as either early childhood educators and assistants (ECEAs) or child care providers (CCPs) in 2016.Note Note that this study also uses the term “early learning and child care workers,” or ELCC workers, to refer to ECEAs and CCPs collectively.
This study focuses on workers who were employed as ECEAs or CCPs in 2016 (N=82,635). Of this sample, 55,510 (67.2%) were ECEAs and 27,125 (32.8%) were CCPs.Note Among ECEAs, the sample size was 5,440 for Indigenous workersNote and 50,000 for non-Indigenous workers. Among CCPs, there were 1,940 Indigenous workersNote and 25,155 non-Indigenous workers in the sample.
Results
Overall, nearly 5% of all early learning and child care (ELCC) workers in Canada were Indigenous (Table 1), higher than the proportion of Indigenous workers represented among all workers (4.0%).Note There was a slightly higher proportion of Indigenous workers represented among ECEAs (4.9%) than among CCPs (4.5%). While the majority of ELCC workers were non-Indigenous workers (95.2%), First Nations workers comprised 2.7% of ELCC workers, followed by Métis (1.6%) and Inuit (0.3%) workers.
| Total early learning and child care workers | Early childhood educators and assistants | Child care providers | All workers (ELCC and non-ELCC workers combined) |
|
|---|---|---|---|---|
| percent | ||||
| Indigenous workers | ||||
| First Nations | 2.7 | 3.0 | 2.3Note * | 2.1 |
| Métis | 1.6 | 1.5 | 1.9Note * | 1.7 |
| Inuit | 0.3 | 0.4 | 0.3 | 0.2 |
| Other or multiple Indigenous identities | 0.1 | 0.1 | 0.1Note E: Use with caution | 0.1 |
| Non-Indigenous workers | 95.2 | 95.1 | 95.4Note * | 96.0 |
| Sample size | 82,635 | 55,510 | 27,125 | 4,940,870 |
E use with caution
Note: ELCC: early learning and child care. Results may not sum to 100% because of rounding. Source: Statistics Canada, 2016 Census of Population. |
||||
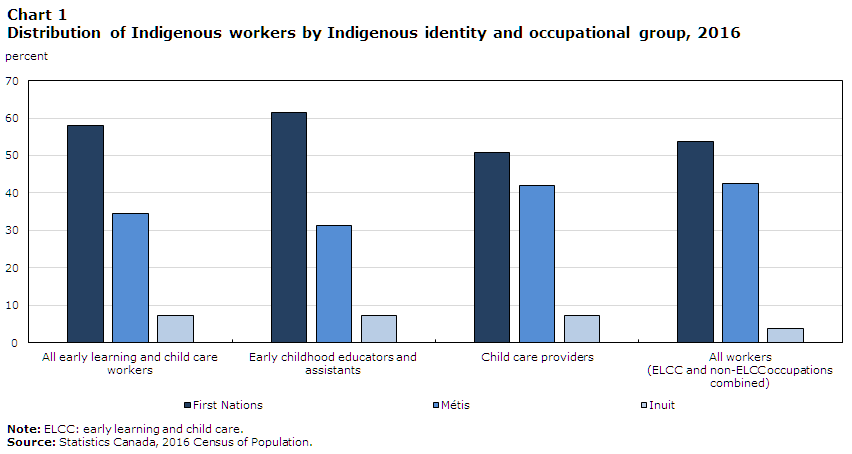
For Indigenous workers specifically, the distribution of First Nations, Métis and Inuit ELCC workers by occupational group is presented in Chart 1. A higher proportion of First Nations workers were represented among ECEAs than among CCPs, although they comprised the majority of Indigenous workers in both occupational groups (61.5% and 50.9%, respectively). Among Indigenous workers, there was also a higher representation of First Nations workers among ECEAs than among workers in all occupational groups combined (53.8%).
In contrast, a higher proportion of Métis were represented among Indigenous CCPs than ECEAs (41.9% vs. 31.3%). A similar proportion of Inuit were represented among both ECEAs and CCPs, as they comprised just over 7% of Indigenous workers in both occupational groups.
Data table for Chart 1
| All early learning and child care workers | Early childhood educators and assistants | Child care providers | All workers (ELCC and non-ELCC occupations combined) | |
|---|---|---|---|---|
| percent | ||||
| First Nations | 58.1 | 61.5 | 50.9 | 53.8 |
| Métis | 34.6 | 31.2 | 41.9 | 42.4 |
| Inuit | 7.3 | 7.3 | 7.2 | 3.8 |
|
Note: ELCC: early learning and child care. Source: Statistics Canada, 2016 Census of Population. |
||||
The sociodemographic characteristics of Indigenous and non-Indigenous ECEAs are presented in Table 2. Notably, there were higher proportions of male First Nations (5.2%) and Inuit (5.9%) ECEAs compared with non-Indigenous male ECEAs (3.8%). First Nations, Métis and Inuit ECEAs were also more likely to be younger than non-Indigenous ECEAs. Of note, 45.1% of Inuit ECEAs were younger than 25 years old, compared with 13.6% of non-Indigenous ECEAs.
| First Nations | Métis | Inuit | Non-Indigenous | |
|---|---|---|---|---|
| percent | ||||
| Sex | ||||
| Female | 94.8Note * | 95.4 | 94.1Note * | 96.2 |
| Male | 5.2Note * | 4.6 | 5.9Note *Note E: Use with caution | 3.8 |
| Age group | ||||
| Younger than 25 | 20.5Note * | 23.1Note * | 45.1Note * | 13.6 |
| 25 to 29 | 14.8Note * | 14.6 | 17.8Note * | 12.8 |
| 30 to 39 | 26.2 | 26.7Note * | 15.1Note * | 26.2 |
| 40 to 49 | 19.9Note * | 19.0Note * | 11.0Note * | 24.3 |
| 50 or older | 18.6Note * | 16.7Note * | 11.0Note * | 23.1 |
| Marital status | ||||
| Single (never married) | 38.6Note * | 32.8Note * | 49.8Note * | 25.4 |
| Married or common-law relationship | 52.4Note * | 58.3Note * | 47.3Note * | 65.8 |
| Divorced, separated or widowed | 9.0 | 8.9 | 2.9Note *Note E: Use with caution | 8.8 |
| Presence of young children in census family | ||||
| No children aged 5 or younger | 73.9Note * | 77.1 | 61.7Note * | 79.7 |
| One child aged 5 or younger | 18.3Note * | 16.5 | 25.3Note * | 14.4 |
| Two or more children aged 5 or younger | 7.9Note * | 6.4 | 13.0Note * | 5.9 |
| Lives in major CMA (Montréal, Toronto or Vancouver) | ||||
| Does not live in major CMA | 92.2Note * | 88.2Note * | Note x: suppressed to meet the confidentiality requirements of the Statistics Act | 57.3 |
| Lives in major CMA | 7.8Note * | 11.8Note * | Note F: too unreliable to be published | 42.7 |
| Reported having Registered or Treaty Indian status | ||||
| No | 17.4 | 90.5 | Note x: suppressed to meet the confidentiality requirements of the Statistics Act | Note ...: not applicable |
| Yes | 82.6 | 9.5 | Note F: too unreliable to be published | Note ...: not applicable |
| Postsecondary education | ||||
| Does not have a postsecondary education | 36.9Note * | 34.3Note * | 72.6Note * | 22.0 |
| Has a postsecondary education | 63.1Note * | 65.7Note * | 27.4Note * | 78.0 |
|
... not applicable x suppressed to meet the confidentiality requirements of the Statistics Act E use with caution F too unreliable to be published
Source: Statistics Canada, 2016 Census of Population. |
||||
First Nations (38.6%), Métis (32.8%) and Inuit (49.8%) ECEAs were also more likely to be single (never married), compared with non-Indigenous ECEAs (25.4%). Additionally, about 8 in 10 non-Indigenous ECEAs did not have any children aged 5 years or younger in their census family, a higher proportion than both First Nations (73.9%) and Inuit ECEAs (61.7%).Note Both First Nations (7.9%) and Inuit (13.0%) ECEAs, but not Métis (6.4%) ECEAs, were more likely to have two or more children aged 5 years or younger in their census family, compared with non-Indigenous ECEAs (5.9%).
Just over 4 in 10 non-Indigenous ECEAs lived in a major census metropolitan area (CMA; i.e., resided in Montréal, Toronto or Vancouver),Note while the figure was 7.8% among First Nations ECEAs and 11.8% among Métis ECEAs. Additionally, the majority of First Nations ECEAs (82.6%) and nearly 1 in 10 Métis ECEAs (9.5%) reported having Registered or Treaty Indian status.Note
Finally, the majority of First Nations (63.1%) and Métis (65.7%) ECEAs had a postsecondary education, while just over one-quarter of Inuit (27.4%) ECEAs had a postsecondary education. In comparison, over three-quarters of non-Indigenous ECEAs (78.0%) had a postsecondary education. However, the lower proportion of Inuit ECEAs with a postsecondary education should be interpreted with caution, given that 45.1% of Inuit ECEAs were younger than 25 years old and may still have been completing postsecondary education.Note
Largely similar patterns were observed among CCPs (Table 3). A higher proportion of First Nations CCPs were men (7.1%), compared with non-Indigenous workers (4.8% men). First Nations, Métis and Inuit CCPs were more likely to be younger than non-Indigenous CCPs. Notably, 42.5% of Inuit CCPs were younger than 25 years old, compared with 15.5% of non-Indigenous CCPs. First Nations (44.7%) and Métis (37.5%) CCPs were also more likely to be single (never married), compared with non-Indigenous CCPs (28.4%). About 8 in 10 non-Indigenous CCPs did not have any children aged 5 years or younger in their census family. First Nations (16.2%), Métis (15.4%) and Inuit (22.0%) CCPs were more likely to have one child aged 5 years or younger in their census family compared with non-Indigenous CCPs (10.6%).
| First Nations | Métis | Inuit | Non-Indigenous | |
|---|---|---|---|---|
| percent | ||||
| Sex | ||||
| Female | 92.9Note * | 95.8 | 91.3 | 95.2 |
| Male | 7.1Note * | 4.3Note E: Use with caution | 8.7Note E: Use with caution | 4.8 |
| Age group | ||||
| Younger than 25 | 29.9Note * | 28.8Note * | 42.5Note * | 15.5 |
| 25 to 29 | 12.5Note * | 10.8 | 12.7Note * | 8.1 |
| 30 to 39 | 20.4Note * | 22.7 | 15.5Note *Note E: Use with caution | 24.9 |
| 40 to 49 | 16.4Note * | 14.1Note * | 14.5Note *Note E: Use with caution | 20.4 |
| 50 or older | 20.9Note * | 23.7Note * | 14.8Note *Note E: Use with caution | 31.2 |
| Marital status | ||||
| Single (never married) | 44.7Note * | 37.5Note * | Note x: suppressed to meet the confidentiality requirements of the Statistics Act | 28.4 |
| Married or common-law relationship | 48.0Note * | 53.1Note * | Note x: suppressed to meet the confidentiality requirements of the Statistics Act | 57.9 |
| Divorced, separated or widowed | 7.3Note * | 9.5Note * | Note F: too unreliable to be published | 13.7 |
| Presence of young children in census family | ||||
| No children aged 5 or younger | 78.4Note * | 77.3Note * | 70.1Note * | 84.1 |
| One child aged 5 or younger | 16.2Note * | 15.4Note * | 22.0Note * | 10.6 |
| Two or more children aged 5 or younger | 5.4 | 7.4 | 7.9Note E: Use with caution | 5.3 |
| Lives in major CMA (Montréal, Toronto or Vancouver) | ||||
| Does not live in major CMA | 91.1Note * | 93.1Note * | Note x: suppressed to meet the confidentiality requirements of the Statistics Act | 62.4 |
| Lives in major CMA | 8.9Note * | 6.9Note *Note E: Use with caution | Note F: too unreliable to be published | 37.6 |
| Reported having Registered or Treaty Indian status | ||||
| No | 25.8 | 92.2 | Note x: suppressed to meet the confidentiality requirements of the Statistics Act | Note ...: not applicable |
| Yes | 74.2 | 7.8 | Note F: too unreliable to be published | Note ...: not applicable |
| Postsecondary education | ||||
| Does not have a postsecondary education | 65.3Note * | 64.6Note * | 83.5Note * | 50.3 |
| Has a postsecondary education | 34.7Note * | 35.5Note * | 16.5Note *Note E: Use with caution | 49.7 |
|
... not applicable x suppressed to meet the confidentiality requirements of the Statistics Act E use with caution F too unreliable to be published
Source: Statistics Canada, 2016 Census of Population. |
||||
Nearly 4 in 10 non-Indigenous CCPs lived in a major CMA (37.6%), compared with fewer than 1 in 10 First Nations (8.9%) and Métis (6.9%) CCPs. While nearly three-quarters of First Nations CCPs reported having Registered or Treaty Indian status (74.2%), this was a lower proportion than among First Nations ECEAs. Among Métis CCPs, 7.8% reported having Registered or Treaty Indian status.
The proportion of workers with a postsecondary education was generally lower among all CCPs than all ECEAs. Among CCPs, First Nations (34.7%), Métis (35.5%) and Inuit (16.5%) workers were less likely to have a postsecondary education, compared with their non-Indigenous counterparts (49.7%). Once again, the figure was notably low among Inuit workers, likely because of the high proportion of Inuit CCPs who were younger than 25 years of age.Note
The employment characteristics of Indigenous and non-Indigenous ECEAs and CCPs are presented in Table 4.Note First, the class of worker is examined (i.e., paid employee or self-employed worker). This section of the analysis excludes workers who were unpaid family members, because of very small sample sizes. Self-employed individuals include those with or without paid help. The number of hours worked in the census reference week is also examinedNote and is measured in terms of part-time or full-time hours. Part-time hours are defined as working less than 30 hours during the reference week, and full-time hours are defined as working 30 hours or more during the reference week.
A lower proportion of First Nations (5.2%) and Inuit (0.0%) ECEAs were self-employed, compared with their non-Indigenous counterparts (14.6%). Regarding the number of hours worked, just under two-thirds of non-Indigenous ECEAs worked full-time hours during the reference week (64.4%), whereas the figure was lower, at 61.0%, for First Nations ECEAs, and 43.5% for Inuit ECEAs. The employment characteristics of Métis ECEAs were not statistically different than those of non-Indigenous ECEAs.
| First Nations | Métis | Inuit | Non-Indigenous | |
|---|---|---|---|---|
| percent | ||||
| Early childhood educators and assistants | ||||
| Class of worker | ||||
| Paid employee | 94.8Note * | 85.8 | 100.0Note * | 85.4 |
| Self-employed | 5.2Note * | 14.2 | 0.0Note * | 14.6 |
| Hours worked during reference week | ||||
| Worked part-time hours (less than 30 hours) | 39.0Note * | 34.3 | 56.5Note * | 35.6 |
| Worked full-time hours (30 hours or more) | 61.0Note * | 65.7 | 43.5Note * | 64.4 |
| Child care workers | ||||
| Class of worker | ||||
| Paid employee | 73.1Note * | 60.7 | 82.9Note * | 63.9 |
| Self-employed | 26.9Note * | 39.3 | 17.1Note *Note E: Use with caution | 36.1 |
| Hours worked during reference week | ||||
| Worked part-time hours (less than 30 hours) | 53.3Note * | 49.5 | 62.1Note * | 44.8 |
| Worked full-time hour (30 hours or more) | 46.7Note * | 50.5 | 37.9Note * | 55.2 |
E use with caution
|
||||
Similar results were observed among CCPs. First Nations CCPs (26.9%) were less likely to be self-employed compared with their non-Indigenous counterparts (36.1%). Regarding the number of hours worked, while over half of non-Indigenous CCPs worked full-time (55.2%), the figures were lower for First Nations and Inuit CCPs—46.7% for First Nations and 37.9% for Inuit CCPs. Generally, the percentage of CCPs who worked full-time hours was lower than the percentage of ECEAs who worked full-time hours across all groups.
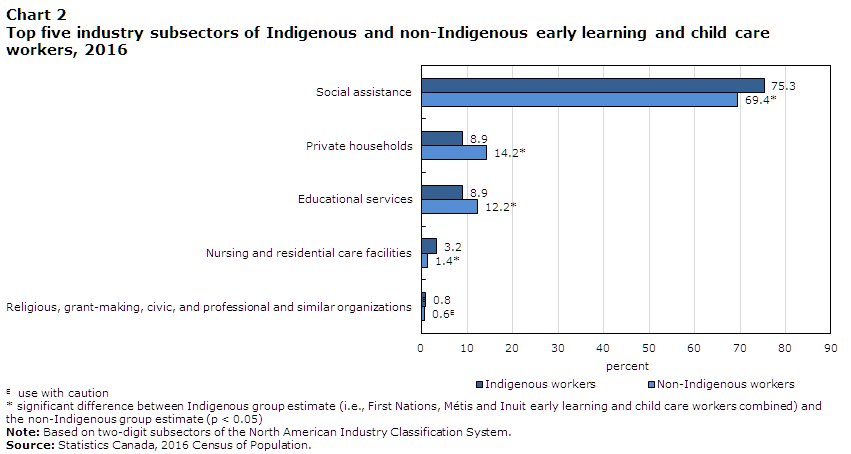
Finally, additional information about the top industries in which Indigenous and non-Indigenous ELCC workers were employed in 2016 is presented in Chart 2.Note The top five industry subsectors for both IndigenousNote and non-Indigenous workers were the same. However, there was a higher proportion of Indigenous than non-Indigenous ELCC workers employed in the social assistance (75.2% vs. 69.4%) and nursing and residential care facilitiesNote (3.2% vs. 1.4%) sectors. In contrast, there was a smaller proportion of Indigenous than non-Indigenous workers employed in the private households (8.9% vs. 14.2%) and educational services (8.9% vs. 12.2%) sectors.Note
Data table for Chart 2
| Indigenous workers | Non-Indigenous workers | |
|---|---|---|
| percent | ||
| Social assistance | 75.3 | 69.4Note * |
| Private households | 8.9 | 14.2Note * |
| Educational services | 8.9 | 12.2Note * |
| Nursing and residential care facilities | 3.2 | 1.4Note * |
| Religious, grant-making, civic, and professional and similar organizations | 0.8 | 0.6Note E: Use with caution |
E use with caution
Source: Statistics Canada, 2016 Census of Population. |
||
Conclusion
Indigenous early learning and child care (ELCC) programs that focus on the languages and cultural identities of First Nations, Métis and Inuit communities have been found to contribute to better educational outcomes for Indigenous children and help to build their language abilities and sense of cultural pride (Elek et al. 2020; Morcom and Roy 2019). While First Nations, Métis and Inuit ELCC workers can contribute to providing culturally relevant ELCC to Indigenous communities, there is a shortage of Indigenous workers in ELCC occupations (Greenwood, de Leeuw and Ngaroimata Fraser 2007; Anderson, n.d.), and little information about these workers is known.
The results presented in this study shed light on the sociodemographic and employment characteristics of First Nations, Métis and Inuit ELCC workers, and non-Indigenous ELCC workers. Several notable differences were observed. For example, First Nations, Métis, and Inuit early childhood educators and assistants (ECEAs) and child care providers (CCPs) were more likely to be younger and less likely to have a postsecondary education, compared with their non-Indigenous counterparts. Moreover, First Nations and Inuit ECEAs were more likely to have two or more children aged 5 years or younger in their census family compared with non-Indigenous ECEAs. Similarly, First Nations, Métis and Inuit CCPs were more likely have one child aged 5 years or younger in their census family compared with non-Indigenous CCPs.
Interestingly, although ELCC occupations are female-dominated, First Nations ECEAs and CCPs were more likely to be men than non-Indigenous ECEAs and CCPs. Moreover, both First Nations and Inuit ECEAs and CCPs were more likely to be paid employees, but less likely to work full-time compared with their non-Indigenous counterparts. Métis CCPs were also less likely to work full-time compared with non-Indigenous CCPs. Differences were also observed across industry sectors. For example, a higher proportion of Indigenous ELCC workers than their non-Indigenous counterparts were employed in the social assistance sector.
Results from this study contribute to a better understanding of the sociodemographic and employment characteristics of Indigenous ECEAs and CCPs by examining these factors separately for First Nations, Métis and Inuit workers (where possible). Future research that further explores census data and other potential sources of data to examine a broader range of characteristics of First Nations, Métis, Inuit and non-Indigenous ELCC workers would provide additional information about these workers. In particular, information on wages and the characteristics of workers at a regional level would provide greater insight into Indigenous ELCC workers in Canada.
Appendix 1
Examples of industries at the four-digit level of the top five subsectors of Indigenous and non-Indigenous early learning child care workers:
- Social assistance (North American Industry Classification System [NAICS] subsector 624)
- Individual and family services (NAICS 6241)
- Vocational rehabilitation services (NAICS 6243)
- Child day-care services (NAICS 6244)
- Private households (NAICS subsector 814)a
- Private households (NAICS 8141)
- Educational services (NAICS subsector 611)
- Elementary and secondary schools (NAICS 6111)
- Other schools and instruction (NAICS 6116)
- Educational support services (NAICS 6117)
- Nursing and residential care facilities (NAICS subsector 623)
- Nursing and residential care facilities (NAICS 6230)b
- Religious, grant-making, civic, and professional and similar organizations (NAICS subsector 813)
- Religious organizations (NAICS 8131)
- Social advocacy organizations (NAICS 8133)
- Civic and social organizations (NAICS 8134)
Notes:
a indicates that there is only one four-digit-level NAICS industry associated with the subsector.
b indicates that this is the only four-digit-level NAICS industry represented for this subsector for early learning and child care workers.
References
Anderson, K. n.d. Early Childhood Education. Chiefs of Ontario. Available at: http://education.chiefs-of-ontario.org/upload/documents/resources/manifesto/19.early-childhood-education.pdf.
Beach, J., J. Bertrand, B. Forer, D. Michal, and J. Tougas. 2004. Working for Change: Canada’s Child Care Workforce. Labour Market Update Study.Ottawa: Child Care Human Resources Sector Council.
Centre for Spatial Economics. 2009. Literature Review of the ECEC Labour Market: Understanding and Addressing Workforce Shortages in Early Childhood Education and Care (ECEC) Project. Ottawa: Child Care Human Resources Sector Council.
Elek, C., L. Gubhaju, C. Lloyd-Johnsen, S. Eades, and S. Goldfeld. 2020. “Can early childhood education programs support positive outcomes for Indigenous children? A systematic review of the international literature.” Educational Research Review 31. Available at: https://doi.org/10.1016/j.edurev.2020.100363.
Greenwood, M., S. de Leeuw, and T. Ngaroimata Fraser. 2007. “Aboriginal children and early childhood development education in Canada: Linking the past and the present to the future.” Canadian Journal of Native Education 30 (1): 5–18.
Manitoba Moon Voices, Inc. 2017. Early Learning and Child Care. Available at: https://www.manitobamoonvoicesinc.ca/wp-content/uploads/2017/07/MMVI-ELCC-Report-Final.pdf.
Morcom, L.A., and S. Roy. 2019. “Is early immersion effective for Aboriginal language acquisition? A case study from an Anishinaabemowin kindergarten.” International Journal of Bilingual Education and Bilingualism 22 (5): 551–563. Available at: https://doi.org/10.1080/13670050.2017.1281217.
Statistics Canada. 2012. North American Industry Classification System (NAICS). Statistics Canada Catalogue no. 12‑501‑X. Ottawa: Statistics Canada.
Statistics Canada. 2018. National Occupational Classification (NOC) 2016. Statistics Canada Catalogue no. 12-583-X. Ottawa: Statistics Canada.
- Date modified: