
Economic and Social Reports
International students as a source of labour supply: The growing number of international students and their changing sociodemographic characteristics
DOI: https://doi.org/10.25318/36280001202100700005-eng
Skip to text
Text begins
Abstract
The number of new international students (first-time study permit holders) in Canada has increased steadily since the mid-2000s, and it reached 250,020 in 2019. Along with this trend, increased efforts are being made to attract international students as a potential pool of candidates for permanent immigration and the Canadian labour force. To understand the nature of this potential pool of labour, this article provides a comprehensive analysis of who is coming to Canada as an international student. Overall, the findings point to trends of increased concentration in the programs of study, source countries and provinces of study of international students from 2000 to 2019. At the program level, the shares of international students who intended to study at the primary and secondary school levels have declined, but this was made up for by increases in the shares intending to study at the college and master’s degree levels. Corresponding with these trends at the program level, the share of international students aged 18 to 24 has risen significantly. In addition, the source countries of international students became more concentrated over the study period. And, while the number of international students increased in all provinces, Ontario attracted the largest share of international students in the early 2000s, and this attraction has grown over time (accounted for by those intending to study at the college level), while the share of those headed to British Columbia (intending to study at the college level) has decreased. On the whole, this analysis revealed that, despite its growth, the international student population has become less diverse in many ways over the past two decades.
Authors
Eden Crossman is with the Research and Evaluation Branch at Immigration, Refugees and Citizenship Canada. Youjin Choi and Feng Hou are with the Social Analysis and Modelling Division, Analytical Studies Branch, at Statistics Canada.
Acknowledgements
This study was conducted in collaboration with Immigration, Refugees and Citizenship Canada. The authors would like to thank Cédric de Chardon, Marc Frenette, Rebeka Lee, Katherine Wall and Linda Wang for their advice and comments on an earlier version of this paper.
Introduction
The number of international students in Canada has steadily risen since the early 2000s, accelerating notably after 2015.Note This rise has been accompanied by an ongoing interest in the profile of the international student population and its evolution over time. Two factors that came into play in the post-2015 period may have influenced the international student trajectory in terms of numbers and characteristics.
First, international student program regulatory changes took effect on June 1, 2014, and, as described in the associated Regulations Amending the Immigration and Refugee Protection Regulations, the aim of these changes was “to strengthen the integrity of Canada’s immigration program by explicitly requiring study permit holders to actively pursue their studies, reducing the number of non-genuine and poor quality educational institutions hosting study permit holders, and facilitating the entry into Canada of those foreign nationals that sincerely wish to obtain a Canadian education” (Government of Canada 2014a). One major change that occurred under the amended regulations is that study permits are issued only to successful applicants who are pursuing studies at an educational institution that has been designated by the province or territory to receive international students. Prior to these changes, applicants could apply for a study permit to pursue studies at any educational institution in Canada. Another major change occurred with respect to opportunities for international students to work in Canada during their studies. Under the amended regulations, all international students with a Canadian study permit are automatically authorized to work off-campus for up to 20 hours per week without being required to apply for a separate work permit.
Second, in 2014, the Government of Canada launched the International Education Strategy (2014-2019) with the goal of doubling the number of international students in Canada by 2022 (Government of Canada 2014b). The strategy argued that “a robust and forward-looking strategy to attract a significant proportion of these students to Canada will create new jobs and sources of prosperity, address key labour-force challenges and create new opportunities for Canadians in every region of the country” (Government of Canada 2014b, p. 9). The strategy further suggested that international students are an important future source of skilled labour, as they may be eligible for permanent residency through immigration programs after graduation (Choi, Crossman and Hou 2021a; Government of Canada 2014b). Viewed in this way, the choices made (such as those related to sex, age, source country, and level and field of study) by educational institutionsNote when it comes to attracting and accepting international students have a downstream impact on the sociodemographic characteristics and spectrum of human capital associated with the pool of potential candidates for permanent residency and for the Canadian labour market.
The subsequent International Education Strategy (2019-2024) cited a need for diversification in the flow of international students to Canada. This more recent strategy highlighted the need to “diversify the countries from which international students come to Canada, as well as their fields, levels of study, and location of study within Canada” (Government of Canada 2019, p. 3). The document argued that attracting students from a wider diversity of countries, as well as to a greater variety of regions and programs, would foster sustainable growth in Canada’s international education sector and distribute the benefits more equitably across the country.
As part of a seriesNote that provides a broad overview of international students as a source of labour, this article provides a comprehensive analysis of who is coming to Canada as an international student and the evolution in the diversity of this population over time, particularly with respect to level of study, province of study and source country. The analysis focuses on first-time study permit holders who received their first study permit in the year 2000 or later. International students are grouped into four cohorts according to the year in which their first study permit was issued (2000 to 2004, 2005 to 2009, 2010 to 2014, and 2015 to 2019).Note This study uses data from the Longitudinal Immigration Database (IMDB) to examine the sociodemographic characteristics of international students (e.g., sex, age, level of study, source country and province of study).Note Information on the fields of study of international students is based on data from the Postsecondary Student Information System (PSIS).Note
First-time study permit holders increased in number
The number of first-time study permit holders has increased fairly steadily since the mid-2000s, and it reached 250,020 in 2019 (Chart 1). Note From 2005 to 2015, the annual increase in new study permits was less than 10% (the exception being a 10.8% increase from 2009 to 2010). After 2015, there was a notable jump in the annual intake of new international students, at 27.0% in 2016 and 24.7% in 2017. The increases seen in 2018 (13.2%) and 2019 (12.5%) were lower than those from the previous two years, but remained above the levels seen prior to 2015.
The program composition associated with first-time study permit holders has evolved since the year 2000 because the increase in the absolute number was faster in some programs than in others. The educational level composition of first-time study permit holders for the 2000, 2010 and 2019 arrival cohorts is shown in Chart 2. In 2019, the share of first-time study permit holders who intended to study at the primary level was 5%—a drop from the 10% seen in 2000. The corresponding share also declined at the secondary level from 18% in 2000 to 11% in 2019. In contrast, the share of first-time study permit holders for non-university postsecondary programs (henceforth referred to as college programs) grew from 27% in 2000 to 41% in 2019. The share intending to study at the master’s degree level doubled, from 5% in 2000 to 10% in 2019. The share of first-time study permit holders at the bachelor’s degree level peaked in the late 2000s (accounting for about one in five study permits), and by the late 2010s had fallen back to the levels of the early 2000s (e.g., 13% in 2000 and 15% in 2019). The share intending to study at the doctorate degree level remained fairly stable, at roughly 2% over the period.Note

Data table for Chart 1
| Number of first-time study permit holders | |
|---|---|
| 2000 | 70,300 |
| 2001 | 81,220 |
| 2002 | 75,880 |
| 2003 | 66,140 |
| 2004 | 60,960 |
| 2005 | 61,950 |
| 2006 | 66,180 |
| 2007 | 69,680 |
| 2008 | 76,280 |
| 2009 | 83,500 |
| 2010 | 92,520 |
| 2011 | 96,680 |
| 2012 | 106,250 |
| 2013 | 114,190 |
| 2014 | 120,650 |
| 2015 | 124,060 |
| 2016 | 157,540 |
| 2017 | 196,400 |
| 2018 | 222,320 |
| 2019 | 250,020 |
|
Notes: First-time study permit holders are defined as those who had no study permit within the prior 10 years. They might have received other types of temporary permits. Counts are rounded to the nearest 10. Source: Longitudinal Immigration Database. |
|

Data table for Chart 2
| 2000 cohort (total of 70,300) | 2010 cohort (total of 92,500) | 2019 cohort (total of 250,000) | |
|---|---|---|---|
| Primary schools | 7,060 | 5,500 | 13,110 |
| Secondary schools | 12,870 | 13,840 | 28,310 |
| Non-university postsecondary programs | 18,960 | 24,640 | 101,590 |
| Undergraduate programs | 9,140 | 16,800 | 36,380 |
| University—master's degree | 3,610 | 7,180 | 23,790 |
| University—doctorate degree | 1,090 | 2,540 | 4,690 |
| Other programs | 17,570 | 21,430 | 42,030 |
| Not stated | Note ...: not applicable | 590 | 130 |
|
... not applicable Notes: First-time study permit holders are defined as those who had no study permit within the prior 10 years. They might have received other types of temporary permits. Total counts are rounded to the nearest 100. Source: Longitudinal Immigration Database. |
|||
The majority of international students were males and in the 18-to-24 age group
Overall, the share of male international students is larger than that of females and has trended somewhat upwards over time (Table 1). The increase occurred mostly at the college level, where the share of male students expanded by 3.9 percentage points from the 2000-to-2004 cohort to the 2015-to-2019 cohort. In contrast, the corresponding share of males intending to study at the university level exhibited a slight decline of 1.0 percentage point.
The largest share of first-time study permit holders were aged 18 to 24. The share of this age group has risen over time, from 52% in the 2000-to-2004 cohort to 59% in the 2015-to-2019 cohort. Most of this growth took place at the college level. Corresponding with the earlier-noted trend of fewer new international students at the primary and secondary levels, the share of international students aged 17 and younger has fallen even though their number has increased. There was also a slight decline in the share of first-time study permit holders aged 25 to 34 (consistent with the relatively stable share at the doctorate degree level).
| Arrival cohort | ||||
|---|---|---|---|---|
| 2000 to 2004 | 2005 to 2009 | 2010 to 2014 | 2015 to 2019 | |
| All | ||||
| Total number of students | 354,500 | 357,600 | 530,300 | 950,300 |
| Age group (years) | percent | |||
| 0 to 17 | 22.6 | 23.5 | 20.4 | 18.0 |
| 18 to 24 | 52.4 | 53.9 | 57.5 | 59.0 |
| 25 to 34 | 20.5 | 19.0 | 18.8 | 18.5 |
| 35 and older | 4.4 | 3.6 | 3.2 | 4.4 |
| Sex | ||||
| Male | 51.1 | 53.2 | 54.4 | 53.4 |
| Female | 48.9 | 46.8 | 45.6 | 46.6 |
| number | ||||
| Non-university postsecondary programs | ||||
| Total number of students | 101,000 | 81,300 | 110,200 | 324,000 |
| Age group (years) | percent | |||
| 0 to 17 | 3.6 | 3.4 | 2.6 | 2.2 |
| 18 to 24 | 65.3 | 64.9 | 71.5 | 72.0 |
| 25 to 34 | 27.0 | 27.3 | 22.7 | 21.1 |
| 35 and older | 4.2 | 4.3 | 3.1 | 4.7 |
| Sex | ||||
| Male | 51.5 | 53.6 | 58.6 | 55.4 |
| Female | 48.5 | 46.4 | 41.4 | 44.6 |
| number | ||||
| University programs | ||||
| Total number of students | 81,100 | 107,000 | 147,900 | 246,200 |
| Age group (years) | percent | |||
| 0 to 17 | 1.5 | 1.8 | 2.0 | 2.4 |
| 18 to 24 | 69.2 | 73.0 | 74.1 | 71.7 |
| 25 to 34 | 24.8 | 22.2 | 21.0 | 22.3 |
| 35 and older | 4.4 | 3.1 | 2.8 | 3.6 |
| Sex | ||||
| Male | 55.6 | 56.8 | 55.8 | 54.6 |
| Female | 44.4 | 43.2 | 44.2 | 45.4 |
| Source: Longitudinal Immigration Database. | ||||
A large share of international students increasingly came from the same few source countries
Table 2 depicts the top 10 source countries of first-time study permit holders by program level and arrival cohort, covering the arrival cohorts from 2000 to 2019. Overall, 7 countries remained among the top 10 source countries across all cohorts—South Korea, China, Japan, the United States, France, Mexico and India. The total share of international students from these countries also grew when taken as a group, from 59% in the 2000-to-2004 cohort to 67% in the 2015-to-2019 cohort. The United Kingdom, Taiwan and Germany made up the rest of the top 10 sources for the 2000-to-2004 cohort, replaced by Brazil, Nigeria and Vietnam for the 2015-to-2019 cohort. Saudi Arabia contributed to this top-10 list for the 2005-to-2009 and 2010-to-2014 cohorts.
The share of international students from the top 10 source countries has grown. Among those arriving over the 2000-to-2004 period, 68% of them were from the top 10 source countries; this share grew to 75% for the 2015-to-2019 cohort. While this concentration was most pronounced at the college level (at 83% for the 2000-to-2004 cohort and 85% for the 2015-to-2019 cohort), the increase in concentration occurred at the university level (at 62% for the 2000-to-2004 cohort and 71% for the 2015-to-2019 cohort).
At the college level, the growth in the share of international students from India is notable. From 2000 to 2004, 4% of international students came from India, which was ranked fifth highest among all source countries. By the 2015-to-2019 period, India was the number one source country, making up 67% of international students intending to study at the college level (followed by China and Brazil, at a distant 3% each). The growth in the overall share of Indian international students occurred largely after 2015.
There was also an increase in the share of international students from India at the university level, from 5% in the 2000-to-2004 cohort to 21% in the 2015-to-2019 cohort, making India the number one source country of international students at the university level in the latter cohort. Prior to the 2015-to-2019 cohort, China had consistently ranked as the number one source country over the period for international students intending to study at the university level. From the first cohort to the last, the number of university-level international students from India increased 13-fold, while the number of those from China increased 3-fold.
There are some notable differences in source country composition by program level. South Korea consistently ranked among the top 10 source countries of international students intending to study at the college level over the 2000-to-2019 period, but was absent from the list of top 10 source countries of those intending to study at the university level over this same period. The reverse is true with respect to Iran, Bangladesh and Pakistan, which are all source countries that consistently ranked within the top 10 for international students intending to study at the university level, yet were absent from the list of top source countries at the college level. Also notable is the Philippines and Jamaica ranking among the top 10 source countries of international students intending to study at the college level in the 2015-to-2019 cohort for the first time.
| 2000-to-2004 cohort | 2005-to-2009 cohort | 2010-to-2014 cohort | 2015-to-2019 cohort | |
|---|---|---|---|---|
| percent | ||||
| All | ||||
| South Korea | 18.1 | 18.5 | 7.8 | 4.7 |
| China | 13.5 | 15.5 | 22.6 | 16.5 |
| Japan | 8.1 | 5.9 | 3.7 | 2.6 |
| United States | 6.7 | 5.6 | 3.6 | 2.2 |
| France | 5.3 | 6.2 | 6.3 | 4.5 |
| Mexico | 5.0 | 3.6 | 2.9 | 2.1 |
| United Kingdom | 3.3 | 2.3 | Note ...: not applicable | Note ...: not applicable |
| India | 2.7 | 4.9 | 13.2 | 34.4 |
| Taiwan | 2.6 | Note ...: not applicable | Note ...: not applicable | Note ...: not applicable |
| Germany | 2.6 | 3.0 | Note ...: not applicable | Note ...: not applicable |
| Saudi Arabia | Note ...: not applicable | 2.9 | 4.0 | Note ...: not applicable |
| Brazil | Note ...: not applicable | Note ...: not applicable | 4.5 | 3.3 |
| Nigeria | Note ...: not applicable | Note ...: not applicable | 2.0 | 1.9 |
| Vietnam | Note ...: not applicable | Note ...: not applicable | 2.7 | |
| Total of top 10 countries | 67.9 | 68.4 | 70.6 | 74.9 |
| Other countries | 32.1 | 31.6 | 29.4 | 25.1 |
| Non-university postsecondary programs | ||||
| South Korea | 35.2 | 39.6 | 15.3 | 2.3 |
| China | 20.1 | 14.5 | 15.7 | 3.2 |
| Mexico | 5.5 | 1.5 | 1.3 | 1.4 |
| Japan | 5.5 | 3.4 | 1.8 | Note ...: not applicable |
| India | 4.2 | 10.7 | 39.9 | 66.8 |
| United States | 3.7 | 4.2 | 2.8 | 1.0 |
| Taiwan | 3.7 | Note ...: not applicable | Note ...: not applicable | Note ...: not applicable |
| France | 2.7 | 4.2 | 3.2 | 2.3 |
| United Kingdom | 1.5 | 1.2 | Note ...: not applicable | Note ...: not applicable |
| Indonesia | 0.9 | Note ...: not applicable | Note ...: not applicable | Note ...: not applicable |
| Nigeria | Note ...: not applicable | 1.5 | 1.5 | Note ...: not applicable |
| Morocco | Note ...: not applicable | 1.3 | 1.0 | Note ...: not applicable |
| Vietnam | Note ...: not applicable | Note ...: not applicable | 1.5 | 1.7 |
| Brazil | Note ...: not applicable | Note ...: not applicable | Note ...: not applicable | 3.1 |
| Philippines | Note ...: not applicable | Note ...: not applicable | Note ...: not applicable | 2.3 |
| Jamaica | Note ...: not applicable | Note ...: not applicable | Note ...: not applicable | 1.0 |
| Total of top 10 countries | 83.0 | 82.1 | 84.0 | 85.1 |
| Other countries | 17.0 | 17.9 | 16.0 | 14.9 |
| University programs | ||||
| China | 18.0 | 20.9 | 30.7 | 19.5 |
| France | 13.1 | 14.7 | 13.2 | 10.1 |
| United States | 12.8 | 10.7 | 7.3 | 5.5 |
| India | 4.8 | 5.3 | 7.4 | 21.3 |
| United Kingdom | 2.4 | 1.5 | 1.7 | 2.0 |
| Mexico | 2.2 | Note ...: not applicable | Note ...: not applicable | Note ...: not applicable |
| Bangladesh | 2.2 | 1.7 | 1.7 | 2.5 |
| Pakistan | 2.1 | 2.2 | 2.4 | 1.6 |
| Iran | 2.1 | 3.5 | 3.7 | 4.1 |
| Tunisia | 1.8 | Note ...: not applicable | Note ...: not applicable | Note ...: not applicable |
| Saudi Arabia | Note ...: not applicable | 3.8 | 1.3 | Note ...: not applicable |
| Morocco | Note ...: not applicable | 1.8 | Note ...: not applicable | Note ...: not applicable |
| Nigeria | Note ...: not applicable | Note ...: not applicable | 2.2 | 2.7 |
| Algeria | Note ...: not applicable | Note ...: not applicable | Note ...: not applicable | 1.4 |
| Total of top 10 countries | 61.5 | 66.1 | 71.6 | 70.7 |
| Other countries | 38.5 | 33.9 | 28.4 | 29.3 |
|
... not applicable Source: Longitudinal Immigration Database. |
||||
The share of college-level international students who intended to study in Ontario grew
While the number of international students increased in all provinces, Ontario consistently attracted the largest share of international students, and this share increased from 37.4% in the 2000-to-2004 cohort to 48.9% in the 2015-to-2019 cohort. Table 3 shows the provincial distribution of international students at the time of their first study permit by arrival cohort. As the province attracting the second-largest share of international students, British Columbia saw its share fall from 31.1% in the 2000-to-2004 cohort to 22.7% in the 2015-to-2019 cohort. There have also been relatively small declines in the shares of international students destined for Quebec and Alberta, and smaller relative gains in the shares destined for Manitoba, Newfoundland and Labrador, and Prince Edward Island.
The growth in the share of international students headed to Ontario predominantly occurred at the college level. From the 2000-to-2004 cohort to the 2015-to-2019 cohort, the share of college-level international students destined for Ontario almost doubled, while the corresponding shares for both Alberta and British Columbia more than halved. At the university level, there was much less change across cohorts, the exception being the decline in the share of international students intending to attend university in Quebec (e.g., from about one-third of the 2000-to-2004 cohort to one-quarter of the 2015-to-2019 cohort).
| Arrival cohort | ||||
|---|---|---|---|---|
| 2000 to 2004 | 2005 to 2009 | 2010 to 2014 | 2015 to 2019 | |
| percent | ||||
| All | ||||
| Newfoundland and Labrador | 0.4 | 0.7 | 0.5 | 0.7 |
| Prince Edward Island | 0.2 | 0.3 | 0.3 | 0.5 |
| Nova Scotia | 2.6 | 2.9 | 2.6 | 2.7 |
| New Brunswick | 1.4 | 1.5 | 1.1 | 1.2 |
| Quebec | 15.4 | 15.4 | 14.2 | 13.0 |
| Ontario | 37.4 | 35.3 | 43.3 | 48.9 |
| Manitoba | 2.4 | 2.2 | 2.1 | 2.9 |
| Saskatchewan | 1.7 | 1.7 | 1.3 | 1.5 |
| Alberta | 7.4 | 7.3 | 5.4 | 4.9 |
| British Columbia | 31.1 | 32.6 | 28.3 | 22.7 |
| Non-university postsecondary programs | ||||
| Newfoundland and Labrador | 0.1 | 0.2 | 0.2 | 0.2 |
| Prince Edward Island | 0.1 | 0.1 | 0.1 | 0.2 |
| Nova Scotia | 0.9 | 0.8 | 0.6 | 0.5 |
| New Brunswick | 0.4 | 0.4 | 0.4 | 0.8 |
| Quebec | 6.3 | 8.9 | 7.9 | 8.2 |
| Ontario | 34.7 | 42.1 | 60.7 | 65.3 |
| Manitoba | 1.1 | 1.0 | 1.4 | 1.8 |
| Saskatchewan | 0.6 | 0.2 | 0.3 | 0.7 |
| Alberta | 8.5 | 6.6 | 3.6 | 3.4 |
| British Columbia | 47.3 | 39.4 | 24.4 | 17.1 |
| University programs | ||||
| Newfoundland and Labrador | 0.9 | 1.3 | 1.3 | 1.6 |
| Prince Edward Island | 0.3 | 0.4 | 0.4 | 0.8 |
| Nova Scotia | 5.7 | 4.7 | 4.0 | 4.7 |
| New Brunswick | 3.5 | 2.5 | 2.0 | 1.8 |
| Quebec | 34.3 | 32.0 | 28.2 | 25.7 |
| Ontario | 30.3 | 30.1 | 32.0 | 32.5 |
| Manitoba | 2.8 | 2.5 | 2.9 | 4.2 |
| Saskatchewan | 2.1 | 2.3 | 2.1 | 2.8 |
| Alberta | 5.9 | 6.3 | 5.6 | 6.0 |
| British Columbia | 14.3 | 18.0 | 21.1 | 19.5 |
| Source: Longitudinal Immigration Database. | ||||
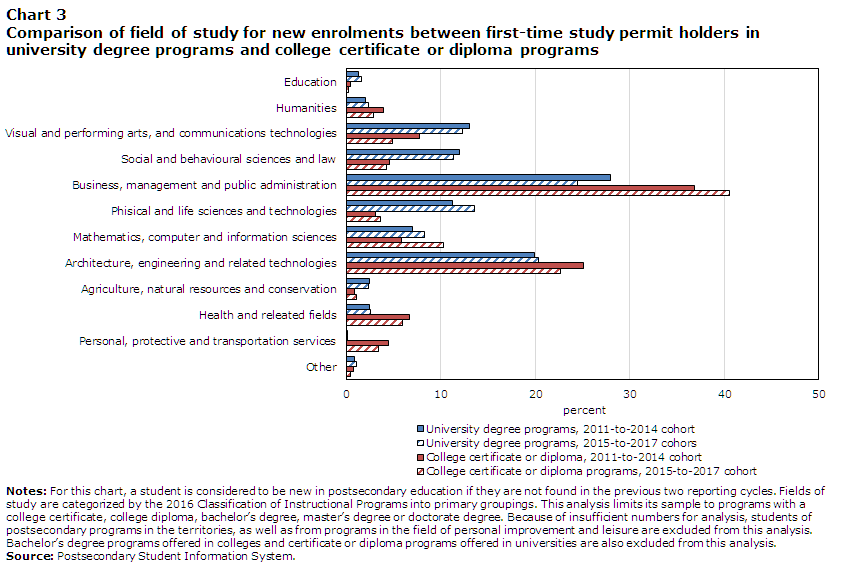
The field of business, management and public administration attracted a large and growing share of international students studying at the college level
At both the college and the university levels, the most common field of study pursued by international students over the 2011-to-2017 period was business, management and public administration (Chart 3). However, the share of international students enrolled in this field at the university level declined from 28% in the 2011-to-2014 cohort to 25% in the 2015-to-2017 cohort, while the corresponding share at the college level expanded from 37% in the 2011-to-2014 cohort to 41% in the 2015-to-2017 cohort. The increase in this field at the college level was compensated for largely by reduced shares in the fields of architecture, engineering and related technologies, and of visual and performing arts, and communications technologies.
Over the same period, increased shares of international students studied mathematics, computer and information sciences at both the university and college levels, though the gain was more pronounced at the college level. In contrast, increased shares of international students studied physical and life sciences and technologies at both the university and college levels, but the larger expansion took place among those attending university.
Data table for Chart 3
| 2016 Classification of Instructional Programs primary grouping | University degree programs, 2011-to-2014 cohort | University degree programs, 2015-to-2017 cohors | College certificate or diploma, 2011-to-2014 cohort | College certificate or diploma programs, 2015-to-2017 cohort |
|---|---|---|---|---|
| percent | ||||
| Education | 1.3 | 1.6 | 0.4 | 0.2 |
| Humanities | 2.0 | 2.3 | 3.9 | 2.9 |
| Visual and performing arts, and communications technologies | 13.0 | 12.3 | 7.7 | 4.9 |
| Social and behavioural sciences and law | 12.0 | 11.3 | 4.6 | 4.2 |
| Business, management and public administration | 27.9 | 24.5 | 36.8 | 40.5 |
| Phisical and life sciences and technologies | 11.2 | 13.5 | 3.1 | 3.6 |
| Mathematics, computer and information sciences | 7.0 | 8.3 | 5.8 | 10.3 |
| Architecture, engineering and related technologies | 19.9 | 20.3 | 25.1 | 22.7 |
| Agriculture, natural resources and conservation | 2.4 | 2.3 | 0.8 | 1.1 |
| Health and releated fields | 2.4 | 2.5 | 6.7 | 5.9 |
| Personal, protective and transportation services | 0.1 | 0.1 | 4.4 | 3.4 |
| Other | 0.8 | 1.1 | 0.7 | 0.4 |
|
Notes: For this chart, a student is considered to be new in postsecondary education if they are not found in the previous two reporting cycles. Fields of study are categorized by the 2016 Classification of Instructional Programs into primary groupings. This analysis limits its sample to programs with a college certificate, college diploma, bachelor’s degree, master’s degree or doctorate degree. Because of insufficient numbers for analysis, students of postsecondary programs in the territories, as well as from programs in the field of personal improvement and leisure are excluded from this analysis. Bachelor’s degree programs offered in colleges and certificate or diploma programs offered in universities are also excluded from this analysis. Source: Postsecondary Student Information System. |
||||
Conclusion
While the number of international students in Canada has risen annually since the mid-2000s, there was a notable increase in the magnitude of this growth after 2015. Observations of the sociodemographic and educational characteristics of international students have led to recent policy efforts intended to diversify this population. The post-2015 period is also marked by regulatory changes in the international student program concerning institutions designated for study and work opportunities for international students. The analysis in this study sought to examine trends in the characteristics of the international student population over the past two decades, with a particular focus on the scope of diversity of the most recent cohorts as related to that of earlier arrivals.
Overall, the findings point to trends of increased concentration from 2000 to 2019 when it comes to the programs of study, source countries and provinces of study of international students. At the program level, the increase in the absolute number of international students was faster in some programs than in others. As a result, the shares of international students intending to study at the primary and secondary school levels have declined, but this was made up for by increases in the shares intending to study at the college and master’s degree levels. Related to these trends in the level of study, the share of international students aged 18 to 24 has risen significantly. In general, this analysis revealed that, despite its growth, the international student population has become less diverse in many ways over the past two decades.
In addition, the source countries of international students became more concentrated over the study period—not only did the same 7 countries remain among the top 10 source countries (South Korea, China, Japan, the United States, France, Mexico and India), but there was also growth in the total share of international student arrivals from these countries when taken as a group. In terms of province of study, Ontario attracted the largest share of international students in the early 2000s, and this attraction has grown over time (accounted for by those intending to study at the college level), while the share of those headed to British Columbia (intending to study at the college level) has decreased. The post-2015 increase in annual international student numbers was characterized by growing shares of international students from India; those intending to study at the college level; those intending to study in Ontario; and those studying in the field of business, management and public administration.
Looking forward, trends in the sociodemographic characteristics of international students have the potential to influence the sustainable growth of Canada’s international education. Increased concentration of international students by source country, level of education, province of study and field of study may have a downstream impact on the potential pool of candidates for permanent immigration and the Canadian labour force.
References
Choi, Y., E. Crossman and F. Hou. 2021a. “International students as a source of labour supply: Transition to permanent residence.” Economic and Social Reports. Statistics Canada Catalogue no. 36-28-0001. Forthcoming.
Choi, Y., E. Crossman and F. Hou. 2021b. “International students as a source of labour supply: Retention in province of study.” Economic and Social Reports. Statistics Canada Catalogue no. 36-28-0001. Forthcoming.
Frenette, M., Y. Choi, and A. Doreleyers. 2020. International Student Enrolment in Postsecondary Education Programs Prior to COVID-19. Economic Insights, no. 105. Statistics Canada Catalogue no. 11-626-X. Ottawa: Statistics Canada.
Government of Canada. 2014a. “Immigration and Refugee Protection Act: Regulations Amending the Immigration and Refugee Protection Regulations.” Canada Gazette Part II, 148 (4). Available at: https://gazette.gc.ca/rp-pr/p2/2014/2014-02-12/html/sor-dors14-eng.html.
Government of Canada. 2014b. Canada’s International Education Strategy: Harnessing our Knowledge Advantage to Drive Innovation and Prosperity. Ottawa: Government of Canada.
Government of Canada. 2019. Building on Success: International Education Strategy 2019-2024. Ottawa: Government of Canada.
- Date modified: