
Economic and Social Reports
Starting a business in a pandemic: The experiences of businesses created during COVID-19
DOI: https://doi.org/10.25318/36280001202100700004-eng
Skip to text
Text begins
Abstract
This article examines the number of entrants during the COVID-19 pandemic and their associated employment. It finds that there were 112,764 entrants in 2020, which is 5.4% less than one year earlier. The bulk of business creation in 2020 occurred following the onset of the pandemic; from June to December 2020, there were 2.8% more entrants than over the same period in 2019. Nonetheless, the employment associated with these entrants was lower than in 2019, and this finding is observed across industries, as well as provinces and territories. This provides evidence that the businesses created in 2020 were smaller on average than businesses created prior to 2020.
Author
Amélie Lafrance-Cooke is with the Economic Analysis Division, Analytical Studies and Modelling Branch, at Statistics Canada.
Introduction
In a typical year, it is common to observe job churning in an economy, which occurs through the process of business dynamics. Jobs are created by new entrants and growing incumbents, and they are destroyed by exits and shrinking incumbents. In periods of economic downturns, there may be greater job churning as businesses are negatively impacted by the circumstances.
In terms of job creation, growing incumbents tend to make the greatest contribution to employment, but the contribution from new entrants is not to be overlooked; on average, they can account for about 20% of employment growth in a given year (Dixon and Rollin 2014). In addition, entrants can have exceptional growth potential. Recent evidence in the United States on young high-growth firms documents that a small share of startups made a large contribution to multi-factor productivity growth, output growth and employment growth (Haltiwanger et al. 2017).
It is an understatement that 2020 was not a typical year for businesses and business dynamics. The COVID-19 pandemic led to thousands of business closures in March and April 2020—many of these businesses subsequently reopened, while some have potentially closed permanently. Many government programs were introduced in 2020 to support businesses during these exceptional times, including the Canada Emergency Wage Subsidy program and the Canada Emergency Business Account.
While the pandemic led to a disruption in supply chains and the nature of work, it also led to new opportunities and innovations. Remote work can allow individuals to set up businesses within their homes without incurring the costs and investments associated with larger work or office spaces. It can also allow for increased flexibility in work schedules. Rapid developments and innovation in e-commerce also enabled the creation of many online platforms to facilitate the transition to online retail. These factors, combined with low interest rates and fewer job prospects among laid-off workers, set the stage for increased entrepreneurship.
Many countries recorded substantial increases in new business registrations in 2020. For instance, in the United States, business formation applications were up 82% in the three months leading up to September compared with the same quarter in the previous year. France registered 84,000 new businesses in October 2020, which is a 20% increase from the same month in 2019 and the highest ever recorded. Indeed, the surge in recent business applications in the United States stands in contrast to the slow business formation that occurred during the 2007‑to-2009 financial crisis (Dinlersoz et al. 2021).
Using the monthly estimates of business openings and closures, this article examines entrants over the pandemic and their associated employment. It compares business formation in 2020 with that of the 2015-to-2019 period and contrasts employment created by entrants with that of incumbents and employment destruction from closing businesses and shrinking incumbents. It finds that there were 5.4% less entrants in 2020 than in 2019, largely because fewer entrants were created at the onset of the pandemic. However, from June to December 2020, 2.8% more entrants were created than over the same period in 2019. Nonetheless, the employment of these entrants was lower than in 2019. In other words, many of the businesses created in 2020 were small businesses.
The bulk of business creation in 2020 occurred in the second half of the year
With the monthly estimates of business openings and closures, it is possible to identify new businesses, or entrants, in a given month. These are defined as businesses or enterprises with employment in the current month that were not active in any previous month in the current or previous year; in other words, they are not observed in the dataset for a maximum of 24 months. Employment of entrants is calculated at the month of entry. As this analysis pertains to the contribution of entrants to employment, for an entrant to be counted in a given year, it must still be active in December of that year.Note
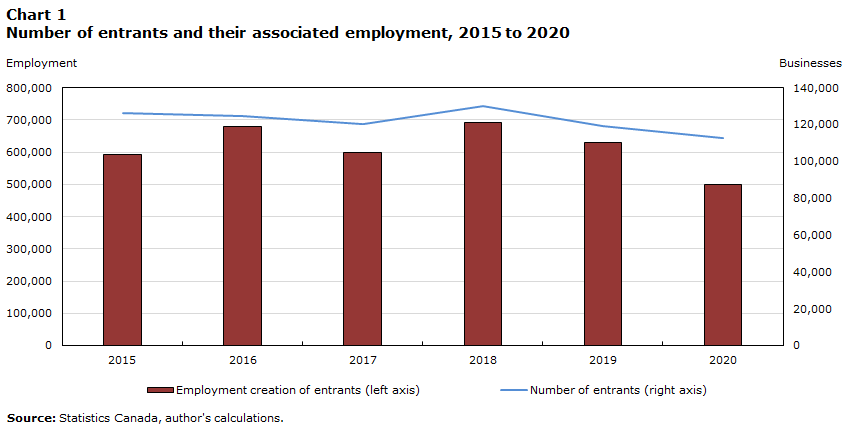
The monthly estimates show that there were 112,764 entrants in 2020—5.4% less than one year earlier (Chart 1). The associated employment derived from these entrants in 2020 was 498,923 employees, which is 20.7% less than in 2019 and 28.0% less than the peak in 2018.
Data table for Chart 1
| Number of entrants (right axis) | Employment creation of entrants (left axis) | |
|---|---|---|
| Businesses (number) | Employment (number) | |
| 2015 | 126,124 | 593,539 |
| 2016 | 124,369 | 679,378 |
| 2017 | 120,297 | 599,879 |
| 2018 | 130,082 | 692,609 |
| 2019 | 119,235 | 628,881 |
| 2020 | 112,764 | 498,923 |
| Source: Statistics Canada, author's calculations. | ||
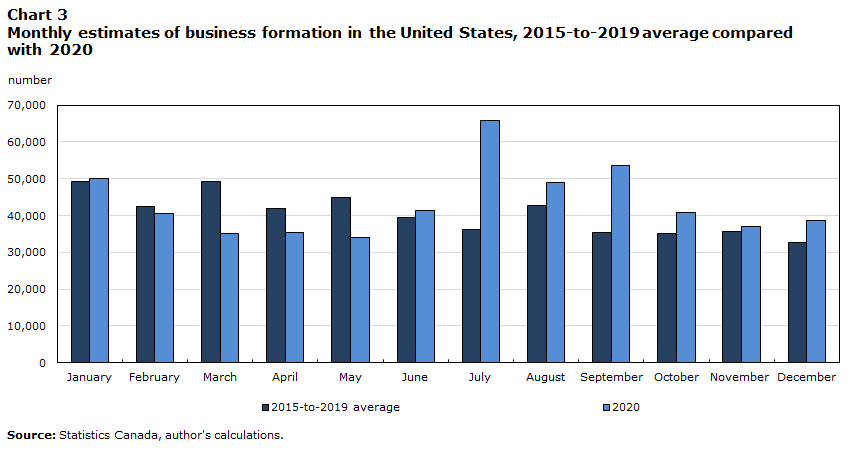
The bulk of business creation in 2020 occurred in the second half of the year, from June to December (Chart 2). At the onset of the pandemic, from March to May 2020, there were 28,008 entrants—nearly 16,000 fewer than the 2015-to-2019 average for the same months. The first few months of the pandemic led to many business closures and much uncertainty in terms of economic conditions, both of which may have made entrepreneurship appear as a less attractive option. As public health restrictions eased over the summer months, entrepreneurship became more viable. The number of entrants from September to December 2020 was higher than the 2015-to-2019 average. Nevertheless, these results contrast with those from the United States, where new business formation among businesses with planned wages was consistently higher from June to December 2020 than over the 2015-to-2019 period (Chart 3).Note Strikingly, over 60,000 businesses were created in July 2020 in the United States—a record monthly high.

Data table for Chart 2
| January | February | March | April | May | June | July | August | September | October | November | December | |
|---|---|---|---|---|---|---|---|---|---|---|---|---|
| number | ||||||||||||
| 2015-to-2019 average | 15,365 | 15,593 | 16,511 | 12,294 | 15,146 | 18,298 | 15,294 | 13,415 | 16,821 | 12,223 | 16,989 | 20,946 |
| 2020 | 14,404 | 13,231 | 11,203 | 9,099 | 7,706 | 14,330 | 13,228 | 10,201 | 17,357 | 13,102 | 17,476 | 21,592 |
| Source: Statistics Canada, author's calculations. | ||||||||||||
Data table for Chart 3
| January | February | March | April | May | June | July | August | September | October | November | December | |
|---|---|---|---|---|---|---|---|---|---|---|---|---|
| number | ||||||||||||
| 2015-to-2019 average | 49,139 | 42,483 | 49,145 | 42,047 | 44,821 | 39,611 | 36,340 | 42,612 | 35,449 | 35,066 | 35,767 | 32,552 |
| 2020 | 50,125 | 40,652 | 35,087 | 35,338 | 34,046 | 41,515 | 65,894 | 49,057 | 53,519 | 40,738 | 37,006 | 38,719 |
| Source: Statistics Canada, author's calculations. | ||||||||||||
While some industries and provinces experienced more business creation in 2020 than in 2019, these entrants tended to be smaller
The growth in entrants since 2019 varied across industries. In the months following the lowest number of entrants in 2020 (i.e., June to December), the number of entrants was higher in 2020 than in 2019Note overall in the business sector and in half of the industries (Chart 4). The largest increases in number of entrants were observed in professional, scientific and technical services (10.4%); information and cultural industries (8.5%); and wholesale trade (7.3%). These service-based industries may have seen such growth because of an increase in demand to cater to home‑based businesses (e.g., web hosting services) and because of the ability of employees in these industries to work from home. In contrast, the number of entrants declined by more than 15% in forestry, fishing and hunting, and in accommodation and food services.
While the number of entrants increased in 2020 relative to 2019 in many industries, the employment created by these entrants was lower than in the previous year in almost all industries (Chart 4). For instance, in retail trade, there were 2.4% more entrants in 2020 compared with 2019, but the number of employees in these entrants was 44.9% lower. This can be interpreted as a lower average size of entrants in 2020 than in 2019. In other words, while there were more entrants from June to December 2020 compared with the same period in 2019, they tended to be smaller in size. Indeed, at the business sector level, the average size of a business in 2020 was 4.4 employees—a decrease from the average of 5.3 employees in 2019. This may have implications in the future, as businesses that start with a larger number of employees tend to have higher survival rates over time (Innovation, Science and Economic Development Canada 2020).

Data table for Chart 4
| Employment | Number of entrants | |
|---|---|---|
| percent change from 2019 to 2020, June to December | ||
| Professional, scientific and technical services | -16.9 | 10.4 |
| Information and cultural industries | -22.6 | 8.5 |
| Wholesale trade | -29.2 | 7.3 |
| Construction | -23.7 | 4.6 |
| Business sector | -17.3 | 2.8 |
| Retail trade | -44.9 | 2.4 |
| Other services (except public administration) | 0.5 | 1.8 |
| Health care and social assistance | -1.3 | 1.0 |
| Transportation and warehousing | -23.1 | 0.4 |
| Arts, entertainment and recreation | -50.2 | 0.0 |
| Educational services | -24.5 | -3.7 |
| Mining, quarrying, and oil and gas extraction | 26.9 | -3.8 |
| Real estate and rental and leasing | -31.8 | -6.2 |
| Finance and insurance and management of companies and enterprises | -34.2 | -6.8 |
| Manufacturing | -22.8 | -7.3 |
| Administrative and support, waste management and remediation services | -30.3 | -11.8 |
| Accommodation and food services | -21.4 | -15.1 |
| Agriculture, forestry, fishing and hunting | -31.6 | -16.3 |
| Source: Statistics Canada, author's calculations. | ||
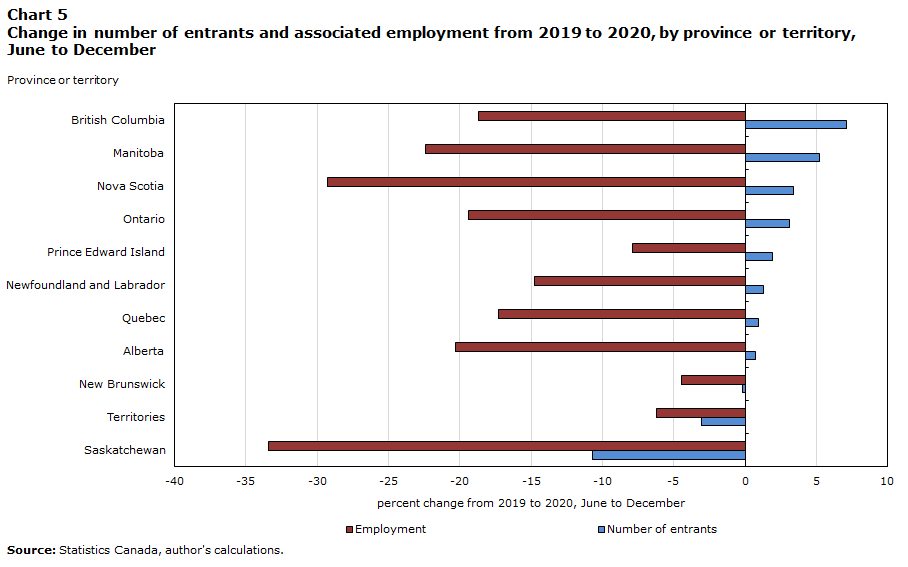
At the provincial and territorial level, there were more entrants in 2020 than in 2019 from June to December in most provinces (Chart 5). The increase in entrants ranged from 0.7% in Alberta to 7.1% in British Columbia. In contrast, the number of entrants decreased by 10.7% in Saskatchewan, 3.1% in the territories and 0.2% in New Brunswick.
Similar to the industry results, the employment associated with entrants in 2020 was lower than for entrants created in 2019 across provinces and the territories. Among the provinces with the greatest increase in entrants, employment in these entrants was more than 15% lower than in entrants that were created in 2019 (Chart 5). It is possible that businesses created during the pandemic wished to start small because of the uncertainty in the general economic conditions.
Data table for Chart 5
| Employment | Number of entrants | |
|---|---|---|
| percent change from 2019 to 2020, June to December | ||
| British Columbia | -18.7 | 7.1 |
| Manitoba | -22.4 | 5.2 |
| Nova Scotia | -29.3 | 3.4 |
| Ontario | -19.4 | 3.1 |
| Prince Edward Island | -7.9 | 1.9 |
| Newfoundland and Labrador | -14.8 | 1.3 |
| Quebec | -17.3 | 0.9 |
| Alberta | -20.3 | 0.7 |
| New Brunswick | -4.5 | -0.2 |
| Territories | -6.2 | -3.1 |
| Saskatchewan | -33.4 | -10.7 |
| Source: Statistics Canada, author's calculations. | ||
Entrants contributed nearly one-third of employment created in 2020
The year 2020 was an unusual and unique one for business dynamics. According to the monthly estimates of business openings and closures, the pandemic resulted in about 110,000 business closures in March and April 2020. About half of these businesses reopened by August 2020. These closures led to significant employment losses, but not as great as those observed in businesses that remained open (Lafrance-Cooke 2021). By examining the employment contribution of entrants, this section will provide a fuller picture of the employment dynamicsNote from the year 2020 relative to the 2015-to-2019 period.
On average, over the 2015-to-2019 period, entrants contributed 32.6% of employment created. In 2020, this share declined to 31.3% (Chart 6). This is a result of fewer entrants during the pandemic relative to previous years, the smaller size of these businesses, and the lower contribution to employment creation of continuing businesses in 2020. Moreover, while the employment created by entrants since 2015 was not enough to offset the annual employment losses from business closures, this finding is amplified in 2020. Notably, the employment loss from business closures was lower in 2020 than the average over the 2015-to-2019 period.
Growing continuers have been shown to contribute most to employment growth (Rollin 2012), and this was still the case in 2020, albeit to a slightly smaller degree relative to previous years. Moreover, the employment lost from declining continuers was particularly large in 2020, at nearly 1.6 million employees, leading to a net employment decline of nearly 500,000 for continuers in 2020. This represents the only year for which net employment growth of continuers was negative.

Data table for Chart 6
| 2015 | 2016 | 2017 | 2018 | 2019 | 2020 | |
|---|---|---|---|---|---|---|
| number | ||||||
| Entrants | 593,539 | 679,378 | 599,879 | 692,609 | 628,881 | 498,923 |
| Growing continuers | 1,316,656 | 1,281,424 | 1,363,056 | 1,315,591 | 1,311,171 | 1,097,063 |
| Declining continuers | -775,953 | -705,621 | -675,405 | -720,363 | -793,533 | -1,595,342 |
| Closing businesses | -783,078 | -700,959 | -752,809 | -735,163 | -728,781 | -722,321 |
| Net employment change | 351,164 | 554,222 | 534,721 | 552,674 | 417,738 | -721,677 |
| Source: Statistics Canada, author's calculations. | ||||||
Conclusion
This article presents new results from the experimental series on monthly business openings and closures. Specifically, it illustrates the extent of new business creation during the COVID-19 pandemic and the associated employment of those entrants.
In 2020, there were 112,764 entrants, which is 5.4% less than one year earlier. However, the bulk of business creation in 2020 occurred following the onset of the pandemic; from June to December 2020, there were 2.8% more entrants than over the same period in 2019. Nonetheless, the employment associated with these entrants was lower than in 2019, and this finding is observed across industries, as well as provinces and territories. This provides evidence that the businesses created in 2020 were smaller on average than businesses created prior to 2020.
While there continued to be entrants in Canada despite the COVID-19 pandemic, business creation did not reach record or historical levels like they did in the United States. Future work will examine differences in business creation between Canada and the United States, as well as the potential factors that may drive these differences. It will also be important to monitor the survival rates of newly created businesses over the pandemic as they may less robust due to their smaller size.
References
Bayard, K., E. Dinlersoz, T. Dunne, J. Haltiwanger, J. Miranda, and J. Stevens. 2018. Early-stage Business Formation: An Analysis of Applications for Employer Identification Numbers. Working paper no. 24364. National Bureau of Economic Research.
Dinlersoz, E., T. Dunne, J. Haltiwanger, and V. Penciakova. 2021. Business Formation: A Tale of Two Recessions. Center for Economic Studies CES 21-01.
Dixon, J., and A.-M. Rollin. 2014. The Distribution of Employment Growth Rates in Canada: The Role of High-growth and Rapidly Shrinking Firms. Economic Analysis Research Paper Series, no. 91. Statistics Canada Catalogue no. 11F0027M. Ottawa: Statistics Canada.
Haltiwanger, J., R. Jarmin, R. Kulick, and J. Miranda. 2017. “High growth firms: Contribution to job, output and productivity growth in labor markets.” In Employment Policy and Job Creation, ed. J. Haltiwanger, E. Hurst, J. Miranda, and A. Schoar, p. 11–62. National Bureau of Economic Research, University of Chicago Press.
Innovation, Science and Economic Development Canada. 2020. Key Small Business Statistics – 2020. Catalogue no. lu186-1e-PDF.
Lafrance-Cooke, A. 2021. Changes in Employment by Businesses During the COVID-19 Pandemic: New Insights on the Experimental Series on Monthly Business Openings and Closures. Economic and Social Reports. Statistics Canada Catalogue no. 36-28-0001. Ottawa: Statistics Canada.
Rollin, A.-M. 2012. Firm Dynamics: Employment Dynamics Arising from Firm Growth and Contraction in Canada, 2001 to 2009. The Canadian Economy in Transition Series, no. 24. Statistics Canada Catalogue no. 11‑622‑M. Ottawa: Statistics Canada.
- Date modified: