
Economic and Social Reports
How did the COVID-19 pandemic affect the hours worked in Canada? An analysis by industry, province and firm size

Archived Content
Information identified as archived is provided for reference, research or recordkeeping purposes. It is not subject to the Government of Canada Web Standards and has not been altered or updated since it was archived. Please "contact us" to request a format other than those available.
DOI: https://doi.org/10.25318/36280001202100100005-eng
Abstract
How did the contraction in hours worked in the wake of the COVID-19 pandemic differ by industry, province and firm size? This question is addressed by using the Labour Force Survey and comparing evidence on the hours worked in the main job in 2020 with the 2017-to-2019 average of hours worked. The analysis shows that Canadian workers—as a whole—reduced their hours worked by as much as 25% of their April 2017-to-2019 baseline. The services sector was relatively more affected than the goods sector. The arts, entertainment and recreation sector and the accommodation and food services sector were most affected, as they had a loss of about 65% in their baseline hours worked in April 2020 and were still only at about 55% of their baselines in June of the same year. Across provinces, the largest reductions in hours relative to their baselines were observed in Newfoundland and Labrador, Quebec, Prince Edward Island, and British Columbia. Importantly, the lockdown restrictions imposed led to significant differences across provinces. Firms with fewer than 20 employees were affected most severely. In the majority of industries, these firms incurred the largest or second-largest reductions in hours worked.
Author
Douwere Grekou is currently with the Census Subject Matter Secretariat and worked in the Economic Analysis Division, Analytical Studies Branch when this article was written.
Introduction
Around the world, one critical response to the COVID-19 pandemic has been the implementation of physical distancing measures.Note These policies, which are necessary to contain the spread of the virus, have had serious consequences on the organization of work. They put the global economy on hold, which is unprecedented in peacetime, and Canada is no exception. As of mid-March 2020, from coast to coast to coast and across all sectors, millions of Canadian workers were forced to stay at home idle or to modify their work habits by adopting telework or e-commerce.Note Note This situation has had a drastic effect on Canadian industries, and all regions have been impacted (Conference Board of Canada 2020a, 2020b).
What consequences has this major disruption of the organization of work had on the hours worked in Canada? Answering this question is important for at least four broad reasons. First, hours worked are a key input in production. Therefore, understanding their patterns provides information about economic activity. Second, patterns of hours worked are likely to differ from patterns of employment, especially at the onset of a crisis, since the latter is more costly to adjust and is therefore less volatile.Note Third, this study contributes to the literature on the severe effects the COVID-19 pandemic has had on the Canadian economy. Specifically, it provides evidence of the heterogeneity of the effects by describing how industries, provinces and firms were affected in different ways.Note This is relevant for policy makers aiming to mitigate the effects of the pandemic in a context marked by scarce resources. The fourth reason is a forward-looking one. An issue that emerged at the onset of the pandemic was how to quantify its effects on the labour market. By providing estimates of the evolution and largest reduction of hours worked in the wake of the lockdown, this study offers a basis that could be used each time a new lockdown is implemented.
This study used the Labour Force Survey (LFS), which makes it possible to compare the estimates of the hours worked in an employee’s main job in 2020 with the 2017-to-2019 average of hours worked (hereafter referred to as the “baseline”). The main contribution of the article is that it provides estimates of the effects of the COVID-19 pandemic not only by industry and province but also by firm size, which is an important dimension more rarely discussed. The analysis shows that the effects of the COVID-19 pandemic on hours worked differed widely across industries, provinces and firm sizes. The reduction in hours worked in April 2020 for Canada as a whole represented as much as 25% of its April 2017‑to‑2019 baseline. Although the contraction was severe for a few industries in the goods sector (e.g., the construction sector and the mining, quarrying, and oil and gas extraction sector), the services sector was relatively more affected. Almost all industries in the services sector experienced a maximum reduction in hours exceeding 10% of their baseline and 8 of the 14 industries experienced a maximum reduction exceeding 25% of their baseline. The arts, entertainment and recreation sector and the accommodation and food services sector were particularly affected, as their maximum reduction of hours worked reached 65% of their baseline.
Of the provinces, the largest reductions in hours were observed in Newfoundland and Labrador, Quebec, Prince Edward Island, and British Columbia. The least affected provinces were Manitoba and Saskatchewan. Nevertheless, the lockdown restrictions that were implemented led to significant differences across the country. Furthermore, firms with fewer than 20 employees were the most severely affected when all industries were pooled together and—consistently—by industry.
This paper first presents the methodology used for the analysis, then discusses the results by industry, by industry and province, and by industry and firm size, respectively, before concluding.
Methodology
Actual hours worked at the main job in 2017, 2018 and 2019 were retrieved from the LFS for January to June.Note Note For each month, a baseline was calculated by taking the average over the three years.Note This provides baseline levels of hours worked for the first six months of the year with which changes in hours worked in the wake of the COVID-19 pandemic can be compared.
These hours worked were obtained at the North American Industry Classification System (NAICS) two-digit level, at NAICS two-digit level and provincial level, and at NAICS two-digit level and firm size.Note
For each dimension and month of interest, an index indicating the hours worked in 2020 relative to the baseline was then constructed. Therefore, the indexes cannot be used to compare the level of hours worked across industries, provinces or firm sizes. They can be used only to compare the relative change in hours worked. The emphasis of this analysis is on the maximum reduction in hours.
How did the effects of COVID-19 differ by industry?
Overall
Hours worked as a percentage of baseline hours worked were calculated by industry and grouped by sector: goods-producing industries (Chart 1) and two groupings of services (charts 2 and 3). The first panel of services, labelled “relatively moderately hit,” shows services industries with reductions in hours not exceeding 25% (Chart 2). This panel also includes education because it had a strong recovery from a reduction exceeding 25% in March. The second panel, labelled “relatively severely hit,” shows services industries that experienced a maximum reduction exceeding 25% (Chart 2).
The levels for all industries pooled together are reported in all of the charts for reference. For the pooled industries, the lowest level of hours worked as a percentage of the baseline was reported in April 2020 (76.63%). This was followed by a slow recovery, with the hours worked in June representing only 86.83% of the baseline hours.
Indexes dropped below the 100 mark for all industries except finance and insurance (Chart 2). This trend illustrates the widespread reductions in hours caused by the COVID‑19 pandemic. For the majority of industries, the worst of the pandemic was reported in April 2020 and was followed by a slow recovery. However, a few industries reached their lowest levels in May only (e.g., transportation and warehousing; professional, scientific and technical services; and administrative support, waste management and remediation).
Unsurprisingly, this trend can be explained by the capacity to mitigate physical-distancing measures and the ability of workers to telework. The lockdown measures led to significant differences within the goods and services sectors—and even within industries—which will be discussed in Section 4.
Goods-producing sector
From March to June 2020, the agriculture, forestry, fishing and hunting sector and the utilities sector were the least affected in the goods sector, with reductions in hours worked contained within a 10% bracket of their baselines.
Other industries in the goods-producing sector were more severely affected and had reductions in hours worked beyond 10% of the baseline. For example, the construction industry was severely affected, especially in April 2020, when there was a reduction in baseline hours worked of about 40%, followed by a strong recovery beginning in May. Manufacturing followed a similar trend, but with a less severe dip. Mining, quarrying, and oil and gas extraction was already below the baseline in February because of tensions in the international oil market and drops in the price of oil since January 2020 (Wang 2020). As a result, hours worked in this industry remained below 80% of the baseline hours worked after April.

Data table for Chart 1
| 11 - Agriculture, forestry, fishing and hunting | 21 - Mining, quarrying, and oil and gas extraction | 22 - Utilities | 23 - Construction | 31–33 - Manufacturing | All industries | |
|---|---|---|---|---|---|---|
| index (monthly average 2017 to 2019=100) | ||||||
| January | 100.02 | 95.87 | 101.32 | 99.40 | 98.15 | 101.46 |
| February | 101.85 | 92.93 | 104.74 | 105.96 | 102.27 | 103.97 |
| March | 96.41 | 86.70 | 96.80 | 88.95 | 93.47 | 86.00 |
| April | 91.32 | 76.52 | 97.81 | 60.19 | 75.76 | 76.63 |
| May | 92.29 | 77.25 | 96.75 | 72.20 | 79.91 | 79.09 |
| June | 95.80 | 79.19 | 98.76 | 84.70 | 88.91 | 86.83 |
| Sources: Statistics Canada’s Labour Force Survey and author’s calculations. | ||||||
Services sector
The services sector was relatively more affected than the goods-producing sector. All except three industries in the services sector had reductions in hours worked that exceeded 10% of their baseline. The exceptions were finance and insurance; public administration; and professional, scientific and technical services (Chart 2), the higher rates for which can be explained by the fact that these industries had higher telework capacity at the onset of the pandemic (Deng, Morissette and Messacar 2020).
There are three general patterns that can explain the trends of services labelled as relatively moderately hit (Chart 2). The first applies to wholesale trade; professional, scientific and technical services; and health care and social assistance and consists of a soft decline followed by a slow recovery. Despite similar patterns, it is important to note that these industries were impacted differently. Therefore, as discussed above, professional, scientific and technical services stayed within a 10% bracket of reduced hours. However, at the beginning of the pandemic, wholesale trade was at levels below the baseline hours worked, which can be attributed to a decline in the wholesale margin price observed since 2019 (Lamboni and Zhang 2020) and—importantly—to the railway blockades that occurred in January and February.Note It reached a minimum 77% of the baseline in April 2020. Health care and social assistance maintained a level around 85% of the baseline from March to May 2020—attributable to the partial or full lockdown of general practices, diagnostic services, specialists and daycares.
The second pattern applies to public administration and education. These industries—dominated by public entities—reached their lowest levels in March 2020, right after lockdown measures were implemented, but then recovered quickly when telework adjustments and online educational programs were put in place throughout the country. Despite a strong recovery, education reached 92% of its baseline level only by June, while public administration returned to its baseline level in April. This difference can be explained by the fact that elementary and secondary schools never resumed in some provinces.

Data table for Chart 2
| 41 - Wholesale trade | 51 - Information and cultural industries | 52 - Finance and insurance | 54 - Professional, scientific and technical services | 61 - Educational services | 62 - Health care and social assistance | 91 - Public administration | All industries | |
|---|---|---|---|---|---|---|---|---|
| index (monthly average 2017 to 2019=100) | ||||||||
| January | 90.10 | 93.32 | 104.35 | 107.62 | 104.91 | 103.97 | 103.77 | 101.46 |
| February | 92.77 | 97.47 | 109.68 | 106.91 | 104.36 | 105.93 | 105.19 | 103.97 |
| March | 87.31 | 85.25 | 105.92 | 96.61 | 63.56 | 86.08 | 92.68 | 86.00 |
| April | 77.31 | 90.65 | 110.95 | 94.60 | 81.78 | 83.62 | 101.14 | 76.63 |
| May | 79.10 | 85.69 | 106.80 | 92.02 | 87.45 | 85.07 | 99.62 | 79.09 |
| June | 85.63 | 94.14 | 107.27 | 92.75 | 89.51 | 92.05 | 100.69 | 86.83 |
|
Notes: These are industries with a maximum of reduced hours lower than 25% of their baselines. Education was the exception. Sources: Statistics Canada’s Labour Force Survey and author’s calculations. |
||||||||
Data table for Chart 3
| 44–45 - Retail trade | 48–49 - Transportation and warehousing | 53 - Real estate and rental and leasing | 56 - Administrative support, waste management and remediation | 71 - Arts, entertainment and recreation | 72 - Accommodation and food services | 81 - Other services (except public administration) | All industries | |
|---|---|---|---|---|---|---|---|---|
| index (monthly average 2017 to 2019 =100) | ||||||||
| January | 102.84 | 103.82 | 108.37 | 99.20 | 99.68 | 96.03 | 98.96 | 101.46 |
| February | 106.92 | 104.80 | 105.41 | 100.74 | 109.13 | 97.85 | 102.90 | 103.97 |
| March | 87.27 | 90.92 | 81.27 | 86.78 | 49.89 | 54.53 | 76.75 | 86.00 |
| April | 71.66 | 76.69 | 65.08 | 72.73 | 36.62 | 33.76 | 54.61 | 76.63 |
| May | 78.02 | 74.74 | 68.22 | 69.73 | 42.45 | 37.21 | 61.36 | 79.09 |
| June | 89.81 | 83.57 | 77.15 | 80.84 | 56.31 | 55.45 | 74.11 | 86.83 |
|
Note: These are industries with a maximum of reduced hours higher than 25% of their baselines. Sources: Statistics Canada’s Labour Force Survey and author’s calculations. |
||||||||
Lastly, the third pattern is the saw-tooth pattern that applies to the finance and insurance industry and information and cultural industry. Both industries dropped to their lowest levels in March 2020, recovered somewhat in April, then fell back to near-minimum levels in May.
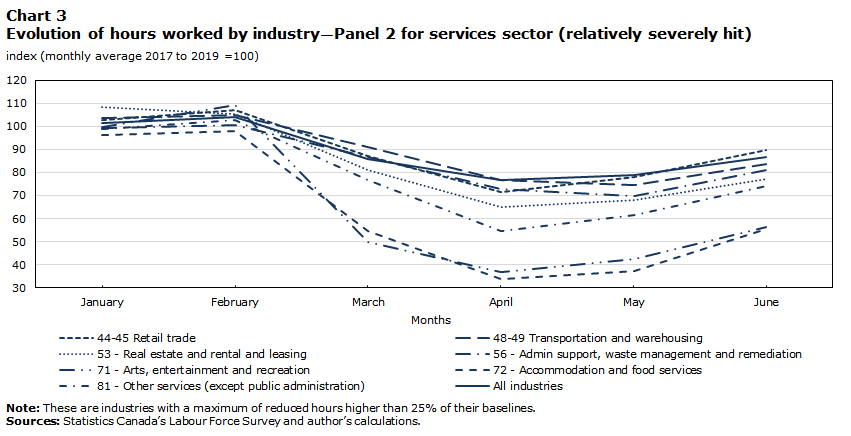
The other grouping of services industries—labelled as relatively severely affected—had one general pattern characterized by a steep decline in March 2020 that continued into April, and was followed by a generally slow recovery beginning in May (Chart 3). All of these industries still faced a reduction of at least 10% of their respective baseline hours in June and most still faced reductions higher than 20% of their respective baseline hours at that time. The arts, entertainment and recreation sector and the accommodation and food services sector were particularly affected. They lost about 65% of their baseline hours worked in April and were at about 55% of their respective baselines in June. This illustrates the dramatic effect that the COVID‑19 pandemic had on these two industries.Note Sections 4 and 5 below will show that this significant impact was observed across provinces and firm size.
How did the effects of COVID-19 differ by industry and province?
The lockdown restrictions imposed by public health authorities were heterogeneous across Canada and contributed to the COVID-19 pandemic having different impacts across provinces and industries.Note These differences can be summarized using a heat map table showing the largest reduction in hours worked relative to the baselines from March to June 2020 (Table 1), by industry and province.Note Unlike the previous section, which showed the month-to-month evolution, this section shows only one number taken from the month with the largest reduction in hours.
Across all provinces, the largest reductions in hours relative to the respective baselines were observed in Newfoundland and Labrador, Quebec, Prince Edward Island, and British Columbia. In all of these provinces, the analysis indicates that at least 9 of the 19 industries had a maximum reduction of hours worked, representing at least 30% of their baselines. The least affected provinces were in the Prairies (i.e., Manitoba and Saskatchewan).
Arts, entertainment and recreation; accommodation and food services; other services (except public administration); and real estate and rental and leasing were severely affected consistently across Canada, with at least eight provinces showing a maximum reduction of hours worked representing at least 30% of their baselines. Finance and insurance; agriculture, forestry, fishing and hunting; and public administration were the least affected consistently.
The lockdown restrictions contributed to the significant differences observed across the country for a given industry. For example, construction was severely affected in Quebec and Newfoundland and Labrador (largest reductions of 73% and 60% of their baselines, respectively), but was only moderately affected in Prince Edward Island and Nova Scotia (largest reductions of 16% and 20% of their baselines, respectively).
Interestingly, there were even differences among industries with a relatively high telework capacity. For example, according to Deng, Morissette and Messacar (2020), 70% of workers in information and cultural industries had the capacity to telework in 2019. Nevertheless, for this industry, three provinces (Nova Scotia, Ontario and Saskatchewan) had maximum reductions in hours below 10% of their baselines, three provinces (Quebec, Manitoba and Alberta) had maximum reductions between 10% and 30% of their baselines, and the remaining four (Newfoundland and Labrador, Prince Edward Island, New Brunswick, and British Columbia) had maximum reductions exceeding 30% of their baselines. This highlights the fact that internal dynamics within industries deserve more attention in future analysis. For example, there could be differences across provinces with respect to the composition of these broad industries (i.e., the two-digit NAICS code industries presented here) and the telework capacity or task attributions within an industry.
| Maximum reduction in hours worked when compared with the baseline (March to June 2020, as a % of baseline hours worked) | Summary by industry (counts over provinces only) | |||||||||||||
|---|---|---|---|---|---|---|---|---|---|---|---|---|---|---|
| Canada | Newfoundland and Labrador | Prince Edward Island | Nova Scotia | New Brunswick | Quebec | Ontario | Manitoba | Saskatchewan | Alberta | British Columbia | No loss or loss lower than 10% | Loss of 10% to 30% | Loss greater than 30% | |
| percentage of baseline hours worked | ||||||||||||||
| NAICS Industry codes and names | ||||||||||||||
| 11 – Agriculture, forestry, fishing and hunting | No loss or loss lower than 10% 8.68 | Loss greater than 30% 70.27 | No loss or loss lower than 10% 3.85 | Loss of 10% to 30% 24.32 | No loss or loss lower than 10% -2.61 | No loss or loss lower than 10% 9.99 | No loss or loss lower than 10% 8.50 | No loss or loss lower than 10% -9.54 | No loss or loss lower than 10% 4.62 | Loss greater than 30% 30.47 | Loss of 10% to 30% 10.83 | 6 | 2 | 2 |
| 21 – Mining, quarrying, and oil and gas extraction | Loss of 10% to 30% 23.48 | Loss of 10% to 30% 25.43 | Loss greater than 30% 62.80 | Loss of 10% to 30% 28.12 | Loss greater than 30% 58.56 | Loss greater than 30% 40.71 | Loss of 10% to 30% 20.91 | Loss greater than 30% 66.26 | Loss greater than 30% 42.49 | Loss of 10% to 30% 17.72 | Loss greater than 30% 47.63 | 0 | 4 | 6 |
| 22 – Utilities | No loss or loss lower than 10% 3.25 | Loss of 10% to 30% 27.35 | Loss greater than 30% 45.91 | Loss of 10% to 30% 22.97 | Loss of 10% to 30% 15.55 | Loss of 10% to 30% 13.39 | No loss or loss lower than 10% 6.59 | Loss of 10% to 30% 29.02 | Loss of 10% to 30% 28.55 | Loss of 10% to 30% 15.68 | No loss or loss lower than 10% -17.17 | 2 | 7 | 1 |
| 23 – Construction | Loss greater than 30% 39.81 | Loss greater than 30% 60.49 | Loss of 10% to 30% 15.51 | Loss of 10% to 30% 19.80 | Loss of 10% to 30% 26.61 | Loss greater than 30% 73.58 | Loss greater than 30% 37.23 | Loss of 10% to 30% 23.73 | Loss greater than 30% 39.67 | Loss greater than 30% 32.55 | Loss of 10% to 30% 26.98 | 0 | 5 | 5 |
| 31- 33 – Manufacturing | Loss of 10% to 30% 24.24 | Loss greater than 30% 36.36 | Loss of 10% to 30% 29.36 | Loss of 10% to 30% 22.83 | Loss of 10% to 30% 26.49 | Loss greater than 30% 33.50 | Loss of 10% to 30% 26.25 | Loss of 10% to 30% 18.91 | No loss or loss lower than 10% 8.02 | Loss of 10% to 30% 21.32 | Loss of 10% to 30% 19.07 | 1 | 7 | 2 |
| 41 – Wholesale trade | Loss of 10% to 30% 22.69 | Loss greater than 30% 47.48 | Loss greater than 30% 44.10 | Loss greater than 30% 34.12 | Loss of 10% to 30% 12.14 | Loss greater than 30% 41.49 | Loss of 10% to 30% 25.90 | Loss of 10% to 30% 25.33 | Loss of 10% to 30% 11.26 | Loss of 10% to 30% 27.58 | No loss or loss lower than 10% 6.80 | 1 | 5 | 4 |
| 44-45 – Retail trade | Loss of 10% to 30% 28.34 | Loss greater than 30% 37.08 | Loss of 10% to 30% 28.66 | Loss greater than 30% 30.56 | Loss of 10% to 30% 21.78 | Loss greater than 30% 31.77 | Loss of 10% to 30% 28.15 | Loss of 10% to 30% 14.16 | Loss of 10% to 30% 21.59 | Loss greater than 30% 34.43 | Loss of 10% to 30% 22.36 | 0 | 6 | 4 |
| 48-49 – Transportation and warehousing | Loss of 10% to 30% 25.26 | Loss greater than 30% 35.13 | Loss of 10% to 30% 13.40 | Loss of 10% to 30% 25.91 | Loss of 10% to 30% 20.74 | Loss of 10% to 30% 27.02 | Loss of 10% to 30% 25.99 | Loss of 10% to 30% 21.29 | Loss of 10% to 30% 28.48 | Loss of 10% to 30% 25.99 | Loss greater than 30% 30.60 | 0 | 8 | 2 |
| 51 – Information and cultural industries | Loss of 10% to 30% 14.75 | Loss greater than 30% 45.38 | Loss greater than 30% 53.26 | No loss or loss lower than 10% 9.96 | Loss greater than 30% 36.57 | Loss of 10% to 30% 22.12 | No loss or loss lower than 10% 7.37 | Loss of 10% to 30% 29.01 | No loss or loss lower than 10% 8.18 | Loss of 10% to 30% 26.50 | Loss greater than 30% 36.71 | 3 | 3 | 4 |
| 52 – Finance and insurance | No loss or loss lower than 10% -5.92 | Loss of 10% to 30% 19.98 | No loss or loss lower than 10% -2.90 | Loss of 10% to 30% 14.71 | No loss or loss lower than 10% 1.29 | No loss or loss lower than 10% -0.53 | No loss or loss lower than 10% -10.59 | Loss of 10% to 30% 16.85 | No loss or loss lower than 10% -12.53 | No loss or loss lower than 10% 5.68 | No loss or loss lower than 10% 4.61 | 8 | 2 | 0 |
| 53 – Real estate and rental and leasing | Loss greater than 30% 34.92 | Loss greater than 30% 52.25 | Loss greater than 30% 82.18 | Loss of 10% to 30% 26.23 | Loss greater than 30% 68.81 | Loss greater than 30% 39.49 | Loss greater than 30% 36.95 | Loss of 10% to 30% 16.08 | Loss greater than 30% 51.61 | Loss greater than 30% 30.17 | Loss greater than 30% 39.49 | 0 | 2 | 8 |
| 54 – Professional, scientific and technical services | No loss or loss lower than 10% 7.98 | Loss of 10% to 30% 21.36 | No loss or loss lower than 10% -11.96 | No loss or loss lower than 10% 3.68 | Loss of 10% to 30% 10.55 | No loss or loss lower than 10% 7.35 | Loss of 10% to 30% 11.46 | No loss or loss lower than 10% 6.44 | Loss of 10% to 30% 15.76 | Loss of 10% to 30% 17.65 | Loss of 10% to 30% 13.38 | 4 | 6 | 0 |
| 56 – Administrative support, waste management and remediation | Loss greater than 30% 30.27 | Loss greater than 30% 43.82 | Loss of 10% to 30% 25.86 | Loss of 10% to 30% 21.44 | Loss of 10% to 30% 27.49 | Loss greater than 30% 38.50 | Loss greater than 30% 30.45 | No loss or loss lower than 10% 8.08 | Loss of 10% to 30% 14.24 | Loss of 10% to 30% 19.49 | Loss greater than 30% 37.44 | 1 | 4 | 5 |
| 61 – Educational services | Loss greater than 30% 36.44 | Loss greater than 30% 35.63 | Loss greater than 30% 63.81 | Loss greater than 30% 43.27 | Loss of 10% to 30% 60.22 | Loss greater than 30% 60.63 | Loss of 10% to 30% 26.63 | Loss of 10% to 30% 13.45 | Loss of 10% to 30% 34.84 | Loss of 10% to 30% 18.81 | Loss greater than 30% 55.55 | 0 | 4 | 6 |
| 62 – Health care and social assistance | Loss of 10% to 30% 16.38 | Loss of 10% to 30% 14.15 | No loss or loss lower than 10% 9.90 | Loss of 10% to 30% 10.62 | Loss of 10% to 30% 16.72 | Loss of 10% to 30% 17.26 | Loss of 10% to 30% 19.32 | Loss of 10% to 30% 18.89 | No loss or loss lower than 10% 8.34 | Loss of 10% to 30% 15.51 | Loss of 10% to 30% 21.63 | 2 | 8 | 0 |
| 71 – Arts, entertainment and recreation | Loss greater than 30% 63.38 | Loss greater than 30% 63.15 | Loss greater than 30% 72.31 | Loss greater than 30% 58.99 | Loss of 10% to 30% 18.59 | Loss greater than 30% 71.36 | Loss greater than 30% 73.17 | Loss greater than 30% 52.04 | Loss greater than 30% 67.02 | Loss greater than 30% 39.04 | Loss greater than 30% 61.37 | 0 | 1 | 9 |
| 72 – Accommodation and food services | Loss greater than 30% 66.24 | Loss greater than 30% 47.67 | Loss greater than 30% 83.27 | Loss greater than 30% 68.98 | Loss greater than 30% 65.25 | Loss greater than 30% 71.13 | Loss greater than 30% 68.97 | Loss greater than 30% 53.52 | Loss greater than 30% 58.22 | Loss greater than 30% 64.70 | Loss greater than 30% 64.96 | 0 | 0 | 10 |
| 81 – Other services (except public administration) | Loss greater than 30% 45.39 | Loss greater than 30% 44.09 | Loss greater than 30% 31.49 | Loss greater than 30% 45.67 | Loss greater than 30% 40.41 | Loss greater than 30% 62.74 | Loss greater than 30% 43.35 | Loss of 10% to 30% 27.28 | Loss of 10% to 30% 19.35 | Loss greater than 30% 42.77 | Loss greater than 30% 46.69 | 0 | 2 | 8 |
| 91 – Public administration | No loss or loss lower than 10% 7.32 | Loss of 10% to 30% 28.14 | Loss of 10% to 30% 27.90 | Loss of 10% to 30% 19.48 | No loss or loss lower than 10% 7.35 | No loss or loss lower than 10% 9.63 | No loss or loss lower than 10% 6.09 | No loss or loss lower than 10% 3.83 | No loss or loss lower than 10% -5.32 | Loss of 10% to 30% 12.11 | No loss or loss lower than 10% 5.23 | 6 | 4 | 0 |
| Summary by geography | ||||||||||||||
| No loss or loss lower than 10% | 5 | 0 | 4 | 2 | 4 | 4 | 5 | 4 | 6 | 1 | 4 | Note ...: not applicable | Note ...: not applicable | Note ...: not applicable |
| Loss of 10% to 30% | 7 | 6 | 6 | 11 | 9 | 4 | 8 | 12 | 8 | 11 | 6 | Note ...: not applicable | Note ...: not applicable | Note ...: not applicable |
| Loss greater than 30% | 7 | 13 | 9 | 6 | 6 | 11 | 6 | 3 | 5 | 7 | 9 | Note ...: not applicable | Note ...: not applicable | Note ...: not applicable |
|
... not applicable Reduction in hours index No loss or loss lower than 10% Loss of 10% to 30% Loss greater than 30% Notes: The maximum reduction in hours worked was obtained by comparing the loss in hours worked in each month (March to June 2020) relative to their respective baseline (i.e., the average from 2017 to 2019 for that month) and taking the month with the largest reduction in hours worked. This was calculated for each industry and province. Colour code: No loss or loss lower than 10%, 10 to 30% loss, loss greater than 30%. A negative number means that, for each month, the number of hours worked from March to June 2020 exceeded the baseline hours worked. NAICS: North American Industry Classification System.Sources: Statistics Canada, author's calculatiosn based on data from the Labour Force Survey. |
||||||||||||||
How did the effects of COVID-19 differ by industry and firm size?
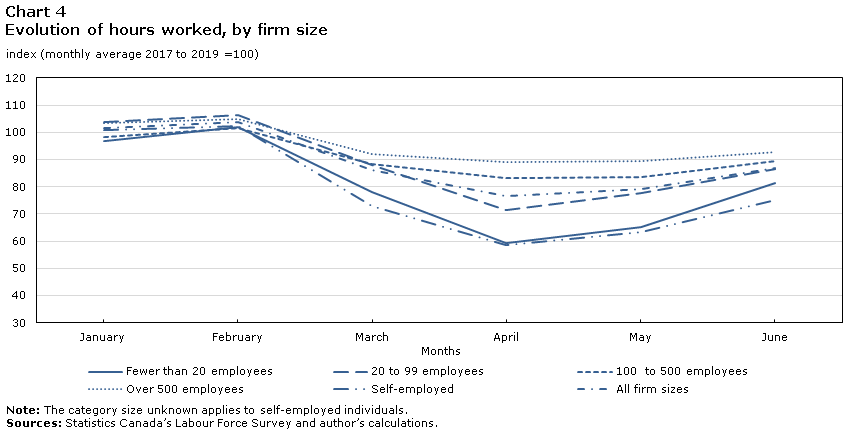
Another important dimension of interest when analyzing the effects of the COVID-19 pandemic on the Canadian economy is firm size. It was observed that, throughout the pandemic, smaller firms were affected more severely than larger ones (Chart 4).Note In particular, firms with fewer than 20 employees had reductions in hours worked that fell to as low as 59% of their baselines in April 2020, compared with 71%, 83% and 89% of the baseline hours worked for firms with 20 to 99 employees, 100 to 500 employees and more than 500 employees, respectively.
These results are important, as firms with fewer than 10 employees account for about 41% of nominal gross domestic product (GDP), compared with about 11% for firms with 100 to 500 employees and about 48% for firms with more than 500 employees (Baldwin, Leung and Rispoli 2013). These results are in line with Gu (2020), who anticipated that the decline in real GDP would be greater among smaller firms.
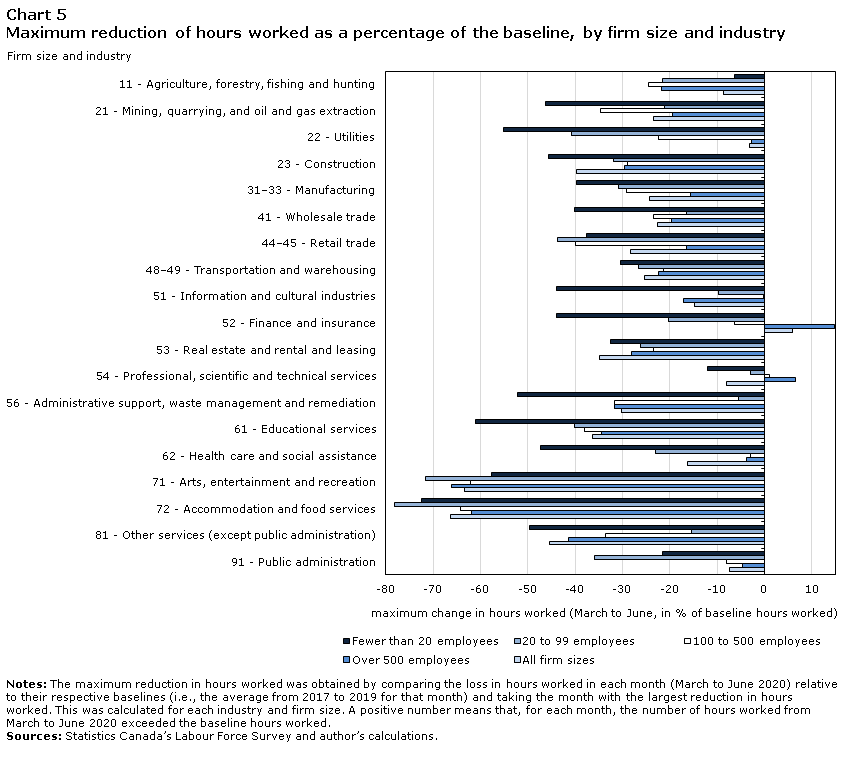
The largest reductions in hours worked by firm size can be analyzed further by industry (Chart 5). Across the vast majority of industries, firms with fewer than 20 employees incurred the largest or second-largest reductions. The only exceptions were agriculture, forestry, fishing and hunting; retail trade; and arts, entertainment and recreation. Therefore, small firms across the economy were consistently more affected than their larger counterparts.
Data table for Chart 4
| Months | Index (monthly average 2017 to 2019 =100) |
|---|---|
| Fewer than 20 employees | |
| January | 96.68 |
| February | 102.14 |
| March | 78.21 |
| April | 59.25 |
| May | 65.01 |
| June | 81.34 |
| 20 to 99 employees | |
| January | 103.88 |
| February | 106.37 |
| March | 87.91 |
| April | 71.30 |
| May | 77.50 |
| June | 86.45 |
| 100 to 500 employees | |
| January | 98.46 |
| February | 101.48 |
| March | 88.24 |
| April | 83.22 |
| May | 83.53 |
| June | 89.29 |
| Over 500 employees | |
| January | 103.38 |
| February | 105.06 |
| March | 92.21 |
| April | 89.25 |
| May | 89.33 |
| June | 92.61 |
| Self-employed | |
| January | 100.75 |
| February | 102.49 |
| March | 72.96 |
| April | 58.37 |
| May | 63.48 |
| June | 75.09 |
| All firm sizes | |
| January | 101.46 |
| February | 103.97 |
| March | 86.00 |
| April | 76.63 |
| May | 79.09 |
| June | 86.83 |
|
Note: The category size unknown applies to self-employed individuals. Sources: Statistics Canada’s Labour Force Survey and author’s calculations. |
|
Data table for Chart 5
| Firm size and industry | All firm sizes | Fewer than 20 employees | 20 to 99 employees | 100 to 500 employees | Over 500 employees |
|---|---|---|---|---|---|
| maximum change in hours worked (March to June, in % of baseline hours worked) | |||||
| 11 - Agriculture, forestry, fishing and hunting | -8.68 | -6.28 | -21.56 | -24.41 | -21.85 |
| 21 - Mining, quarrying, and oil and gas extraction | -23.48 | -46.31 | -21.23 | -34.68 | -19.39 |
| 22 - Utilities | -3.25 | -55.17 | -40.87 | -22.47 | -2.75 |
| 23 - Construction | -39.81 | -45.65 | -31.95 | -29.04 | -29.64 |
| 31–33 - Manufacturing | -24.24 | -39.76 | -30.8 | -29.24 | -15.58 |
| 41 - Wholesale trade | -22.69 | -40.24 | -16.43 | -23.56 | -19.71 |
| 44–45 - Retail trade | -28.34 | -37.58 | -43.76 | -39.86 | -16.48 |
| 48–49 - Transportation and warehousing | -25.26 | -30.34 | -26.72 | -21.24 | -22.36 |
| 51 - Information and cultural industries | -14.75 | -44.02 | -9.76 | -0.03 | -17.17 |
| 52 - Finance and insurance | 5.92 | -43.86 | -20.32 | -6.3 | 14.85 |
| 53 - Real estate and rental and leasing | -34.92 | -32.54 | -26.27 | -23.37 | -28.18 |
| 54 - Professional, scientific and technical services | -7.98 | -12.07 | -2.92 | 1.09 | 6.43 |
| 56 - Administrative support, waste management and remediation | -30.27 | -52.23 | -5.52 | -31.61 | -31.77 |
| 61 - Educational services | -36.44 | -61.12 | -40.07 | -37.93 | -34.47 |
| 62 - Health care and social assistance | -16.38 | -47.36 | -23.14 | -3.05 | -3.72 |
| 71 - Arts, entertainment and recreation | -63.38 | -57.57 | -71.61 | -62.12 | -66.02 |
| 72 - Accommodation and food services | -66.24 | -72.53 | -78.17 | -64.2 | -61.82 |
| 81 - Other services (except public administration) | -45.39 | -49.67 | -15.36 | -33.64 | -41.45 |
| 91 - Public administration | -7.32 | -21.61 | -35.86 | -7.98 | -4.57 |
|
Notes: The maximum reduction in hours worked was obtained by comparing the loss in hours worked in each month (March to June 2020) relative to their respective baselines (i.e., the average from 2017 to 2019 for that month) and taking the month with the largest reduction in hours worked. This was calculated for each industry and firm size. A positive number means that, for each month, the number of hours worked from March to June 2020 exceeded the baseline hours worked. Sources: Statistics Canada’s Labour Force Survey and author’s calculations. |
|||||
Interestingly, the only firms that were able to exceed their baseline hours worked throughout the pandemic were firms with over 500 employees in finance and insurance, and firms with over 100 employees in professional, scientific and technical services. These two industries were relatively less affected.
Conclusion
This study has shown how the effects of the COVID-19 pandemic on hours worked differed across industries, provinces and firm sizes in Canada. This study compared evidence on the hours worked in the main job in each of the first six months of 2020 with baselines defined as the 2017-to-2019 average of hours worked for each of the same months.
As a whole, Canadian workers reduced their hours worked by as much as 25% of their baselines in April 2020. This severe decline was followed by a slow recovery, illustrated by the fact that the hours worked in June represented only 86.83% of the baseline. The decline in hours worked was widespread across industries, with the sole exception of finance and insurance, as employees in this sector reported hours worked that exceeded the baseline.
Although the goods-producing sector was relatively less affected than the services sector, a few of its industries were severely affected. For example, mining, quarrying, and oil and gas extraction was already below the baseline level of hours worked in February 2020 and remained below 80% of its baseline after April that same year. Construction experienced a reduction of about 40% of its baseline in April.
Almost all industries in the services sector had reductions in hours worked that exceeded 10% of their respective baseline. Of the 14 service-sector industries, eight experienced maximum reductions in hours that exceeded 25% of their respective baselines. The arts, entertainment and recreation sector and the accommodation and food services sector were particularly affected. They lost about 65% of their baseline hours worked in April 2020 and were at about 55% of their baseline in June.
Across provinces, the largest reductions in hours relative to their baselines were observed in Newfoundland and Labrador, Quebec, Prince Edward Island, and British Columbia. For these provinces, at least 9 of their 19 industries had maximum reductions in hours worked representing at least 30% of their respective baselines. The least affected provinces were Manitoba and Saskatchewan.
Arts, entertainment and recreation; accommodation and food services; other services (except public administration); and real estate and rental and leasing were consistently severely affected across Canada, with at least eight provinces experiencing a maximum reduction in hours worked, representing at least 30% of their respective baselines. Finance and insurance; agriculture, forestry, fishing and hunting; and public administration were consistently the least affected. Nevertheless, the lockdown restrictions imposed by public health authorities led to significant differences across the country for a given industry. For example, construction was severely affected in Quebec and Newfoundland and Labrador, but was only moderately affected in Prince Edward Island and Nova Scotia.
Firms with fewer than 20 employees were the most severely affected. Across the vast majority of industries, these firms incurred the largest or second-largest reductions in hours worked. This supports the idea that the anticipated loss in real GDP will be higher for smaller firms.
The major effects of the COVID-19 pandemic on the Canadian economy have been described. However, a few questions about the heterogeneity of the effects across provinces remain unanswered. Industries with high telework capacity, such as information and cultural industries, showed significant dissimilarities across provinces, which highlights underlying differences in their ecosystems. Understanding these ecosystems will help assess the full effects of the pandemic and potentially help policy makers mitigate future crises. Furthermore, several dimensions have not been explored in this study. For example, the effects by gender or age deserve attention to assess the social impact of the COVID-19 pandemic (see Grekou and Lu forthcoming and the Statistics Canada (2020b).
References
Baldwin, J.R., D. Leung, and L. Rispoli. 2013. Canadian Labour Productivity Differences Across Firm Size Classes, 2002 to 2008. The Canadian Productivity Review, no. 32. Statistics Canada Catalogue no. 15-206-X. Ottawa: Statistics Canada.
Conference Board of Canada. 2020a. “Sharp, deep, and unprecedented – The Conference Board of Canada releases its Provincial Economic Outlook.”
Conference Board of Canada. 2020b. “Every major city is affected, some more than others in latest forecast – Pandemic reshapes economic pictures for Canadian cities.”
Deng, Z., R. Morissette, and D. Messacar. 2020. “Running the economy remotely: Potential for working from home during and after COVID-19.” StatCan COVID-19: Data to Insights for a Better Canada, no. 26. Statistics Canada Catalogue no. 45280001. Ottawa: Statistics Canada.
Globe and mail. 2020a. (accessed March 25, 2020).
Globe and mail. 2020b. (accessed April 24, 2020).
Grekou, D., and H. Liu. 2018. The Entry into and Exit out of Self-employment and Business Ownership in Canada. Analytical Studies Branch Research Paper Series, no. 407. Statistics Canada Catalogue no. 11F0019M. Ottawa: Statistics Canada.
Grekou, D., and Y. Lu. Forthcoming. “Gender differences in employment in the wake of COVID-19.” Ottawa: Statistics Canada.
Gu, W. 2020. Economic Impact of COVID-19 Pandemic on Canadian Businesses Across Firm Size Classes. Economic Insights, no. 119. Statistics Canada Catalogue no. 11-626-X. Ottawa: Statistics Canada.
Lamboni, D., and S. Zhang. 2020. “COVID-19 impact analysis and 2020 outlook: Wholesale Services Price Index.” StatCan COVID-19: Data to Insights for a Better Canada, no. 34. Statistics Canada Catalogue no. 45280001. Ottawa: Statistics Canada.
La Tribune. 2020. (accessed May 17, 2020).
Liu, H. 2020. The Economic Impact of Travel Restrictions on the Canadian Economy Due to the COVID-19 Pandemic. Economic Insights, no. 125. Statistics Canada Catalogue no. 11-626-X. Ottawa: Statistics Canada.
Ouest France. 2020. (accessed March 23, 2020).
Radio Canada. 2020. (accessed March 21, 2020).
Wang, W. 2020. The Decline in Production and Investment in Canada’s Oil and Gas Sector and its Impact on the Economy. Economic Insights, no. 109. Statistics Canada Catalogue no. 11-626-X. Ottawa: Statistics Canada.
- Date modified: