
Quality of Employment in Canada
Commuting time, 2011 to 2022
Skip to text
Text begins
Commuting is an important aspect of the workday for millions of Canadians. For those who do not work from home, being employed not only involves the time spent at the workplace, but also the time and money needed to get to and from work. Research shows that a long commute increases the risk of negative health outcomes and reduces the ability to maintain work-life balance by interfering with an individual’s capacity to participate in other important activities in their day-to-day lives.Note Commuting time, therefore, is recognized as a major factor contributing to both quality of employment and overall worker well-being.
This quality of employment indicator provides insights into the usual time spent by Canadians getting to their place of work each day (one-way), with a focus on those whose commute is 60 minutes or longer.
All analyses are based on data from the Census of Population and the National Household Survey.
Historical trends, 2011 to 2022
Across all modes of transportation—such as car trips, biking, walking, and public transit—commuters spent an overall average of 23.7 minutes travelling to their workplace in 2021, down 2.5 minutes from 26.2 minutes in 2016. In 2011, the first time when data on commuting time were collected in the National Household Survey or the Census of Population, the average commuting time was 25.4 minutes, 1.7 minutes more than in 2021.
The decline in the average commute duration in 2021 was due in part to the COVID-19 pandemic which began in 2020. After a resurgence of COVID-19 cases in the first two quarters of 2021, public health restrictions were tightened across Canada particularly among non-essential businesses requiring in-person interaction or providing front-facing services such as retailers, restaurants, and gyms. There was also a dramatic shift toward working from home at the onset of the pandemic to accommodate the public health measures aimed at curbing the virus’ spread. In May 2021, 24.3% of workers indicated that they usually worked from home, up from 7.4% in 2016. The combination of these factors resulted in fewer cars on the road and faster trips to work in 2021.
For those travelling by car, truck, or van, commuting time declined in 2021 to 22.8 minutes from 24.1 minutes in 2016 and 23.7 minutes in 2011, respectively. There was also a decrease in commuting time for those whose main mode of transportation was public transit—including bus, subway, and light rail— which fell from 44.8 minutes in 2016 to 42.9 minutes in 2021. However, the average commuting duration for those using public transit in 2021 remained similar to 2011 levels which also stood at 42.9 minutes.
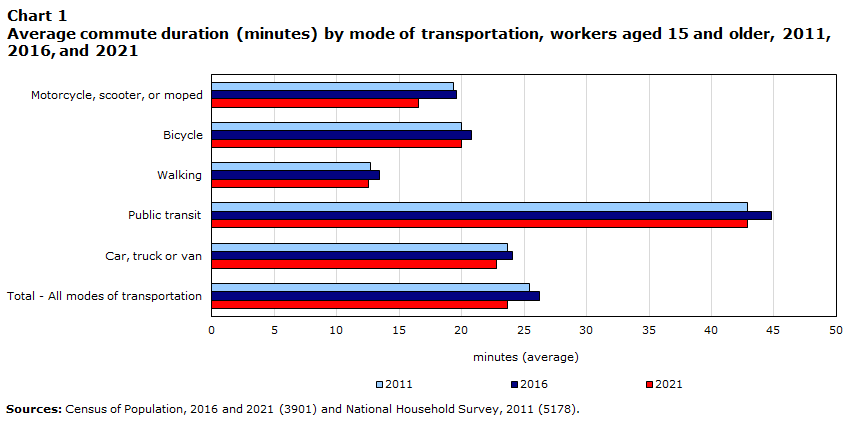
Data table for Chart 1
| 2021 | 2016 | 2011 | |
|---|---|---|---|
| minutes (average) | |||
| Motorcycle, scooter, or moped | 16.5 | 19.6 | 19.3 |
| Bicycle | 20.0 | 20.8 | 20.0 |
| Walking | 12.5 | 13.4 | 12.7 |
| Public transit | 42.9 | 44.8 | 42.9 |
| Car, truck or van | 22.8 | 24.1 | 23.7 |
| Total - All modes of transportation | 23.7 | 26.2 | 25.4 |
| Sources: Census of Population, 2016 and 2021 (3901) and National Household Survey, 2011 (5178). | |||
There were decreases in average commuting time among Canada’s top three most populous census metropolitan areas (CMAs). The largest decrease occurred in Toronto which saw the average commuting time of its residents drop by 4.2 minutes from 34 minutes in 2016. This was followed by Montréal where commuting time decreased by 3.0 minutes to an average commute of 27.0 minutes in 2021, while in Vancouver the average commute time fell by 2.4 minutes to 27.3 minutes. Despite having the largest decline, Toronto still boasted the longest commute of Canada’s three largest CMAs at 29.8 minutes, while Montréal had the shortest.
Looking at the next largest CMAs in terms of population, workers in Ottawa–Gatineau spent 23.8 minutes on average commuting in 2021, down 3.5 minutes from 2016. Over the same period, the average commuting time declined by approximately 2 minutes in both Calgary (down to 24.2) and Edmonton (down to 23.9).
A recent snapshot
Long commutes, in particular, can have an impact on commuters’ health, their safety and their personal finances. Studies indicate that longer commutes are associated with higher stress and poorer mental and physical health outcomes.Note Those with long commutes in private vehicles are at a higher risk of more negative physical health outcomes, such as obesity and cardiovascular disease, than those with long commutes using public transit.Note Long commutes also reduce time available for personal obligations and recreational activities.
In 2021, 926,000 Canadians spent at least 60 minutes commuting to work (defined as a “long commuting time” for this analysis) across all modes of transportation. This was down from 1.5 million Canadians in 2016. Among workers with long commutes in 2021, nearly two-thirds (65.7% or 609,000 people) spent that time in a car. Although many factors—including workplace schedules—may impact when a worker begins their commute, in general, those with longer morning commutes left for work earlier than their counterparts with shorter commutes.

Data table for Chart 2
| 8am to 8:59am | 7am to 7:59am | 6am to 6:59am | 5am to 5:59am | |
|---|---|---|---|---|
| percentage of start times | ||||
| Less than 15 minutes | 24.5 | 25.1 | 13.7 | 12.6 |
| 15 to 29 minutes | 21.3 | 27.5 | 17.4 | 6.3 |
| 60 minutes or more | 15.1 | 22.0 | 22.0 | 4.8 |
|
Notes: Since start times after 8:59 are not displayed, percentages do not add up to 100. Data covers all modes of transportation. Source: Census of Population, 2021 (3901). |
||||
Across all modes of transportation, workers in certain occupational groups and industries were more likely to have long commutes. In 2021, workers employed in natural and applied sciences and related occupations were most likely to report a long commute (10.9%), followed by trades, transport, and equipment operators and related occupations (10.3%) and natural resources, agriculture, and related production occupations (10.1%). These three occupational groups also had the longest average commute times at 28.8 minutes, 27.7 minutes, and 24.8 minutes, respectively.
In contrast, sales and service occupations (20.6 minutes) and occupations in education, law and social, community and government services (21.8 minutes) had the shortest average commute times, with workers in these occupations also least likely to commute 60 minutes or more (5.3% and 5.1%, respectively) in 2021.
At the industry level, workers employed in mining, quarrying, and oil and gas extraction (21.3%) and construction (13.6%) were most likely to have a long commute in 2021, while workers in retail trade (4.0%), educational services (4.3%), and accommodation and food services (4.9%) were least likely to have a long commute.
In 2021, men (8.5%) were more likely to report having a long commute than women (5.4%). Men also had a longer average commute length (25.6 minutes) than women (21.6 minutes). This difference in commute duration between men and women is partly attributable to the fact that men are more likely to be employed in industries and occupations where a longer commute is more common, such as in construction, while women are more likely to work in industries and occupations with shorter commutes such as educational services.
This difference in average commute duration between men and women held across all age groups, though was more evident among men (26.6 minutes) and women (22.3 minutes) aged 25 to 54 and was least pronounced among younger men (21.4 minutes) and women (19.5 minutes) aged 15 to 24.
Start of text box
Information on the indicator
Description or definition
The commuting time indicator refers to the length of time, in minutes, usually required by a person to travel to their place of work in their main job (one way). The data are for all employed persons aged 15 and older who have a usual place of work located in Canada. Employed persons who worked from home or worked outside of Canada are excluded.
Source
Statistics Canada, National Household Survey (NHS) (2011) and Census of Population (2016 and 2021).
Data and analyses are based on the following tables:
Information for interpretation
For more information on concepts and methodology, see: Census of population
Occupations are coded according to the National Occupational Classification (NOC) 2021.
Industries are coded according to the North American Industry Classification System (NAICS) 2017.
Other related information
For more information on journey to work and commuting, please see The Daily article from November 29, 2017.
For long commutes in a car, please consult the following Statistics Canada analytical paper, “Results from the 2016 Census: Long commutes to work by car”, from February 25, 2019.
To learn more about the changing flow of commuters within and across Canada’s largest CMAs, please go to the following study: “Results from the 2016 Census: Commuting within Canada’s largest cities”, published May 29, 2019.
Additional Statistics Canada data are available on the following subject:
End of text box
- Date modified: