
Quality of Employment in Canada
Days not worked due to strikes and lockouts, 1976 to 2021
Skip to text
Text begins
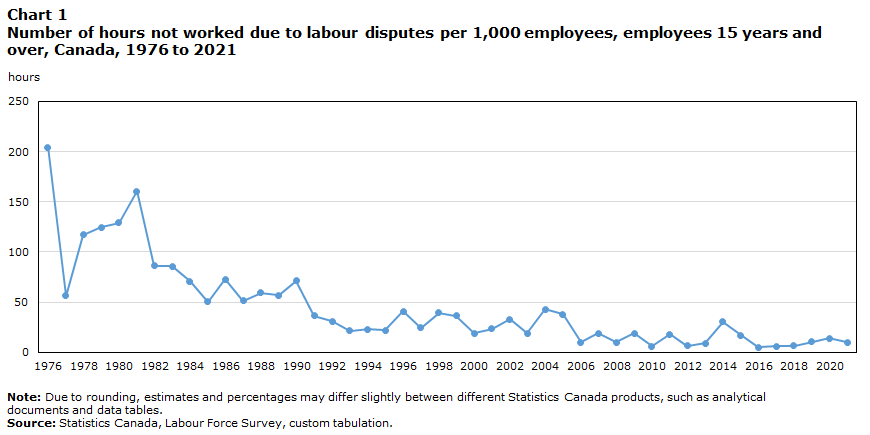
From the early 1980s to the mid-2000s, the number of hours not worked due to strikes and lockouts has generally followed a long-term downward trend.
The number of hours not worked due to labour disputes can have economic and social impacts. Fewer hours worked can lead to reduced economic output, lower earnings for workers, as well as an increase in social tensions. As part of the quality of employment framework, this indicator provides information on the effectiveness of social dialogue between employees’ organizations, employers’ organizations, and governments, in terms of employment opportunities and earnings, social security, and the right to strike.
Annual changes in the hours not worked due to labour disputes may be affected by dynamics such as the number and length of collective agreements, the size of the unions involved, the duration of the disputes, economic conditions, in addition to any changes in industrial relations legislation.
The number of hours not worked due to strikes or lockouts per 1,000 employees is calculated using data from the Labour Force Survey (LFS).
The COVID-19 pandemic did not have a major impact on hours lost due to strikes and lockouts, and the number of hours lost per 1000 employees was little changed in 2020 at 13.7. However, the number of hours lost due to labour disputes fell by 3.8 hours per 1,000 employees to 9.9 hours in 2021. The decline was driven by the public sector, where hours lost per 1,000 employees fell by 19.0 to 10.5.
Historical trends, 1976 to 2021
In 1976, over 200 hours per 1,000 employees were not worked as a result of labour disputes such as strikes or lockouts. While the number of hours not worked due to labour disputes per 1,000 employees decreased notably the following year, it trended up from 1978 until 1981, when it reached 160 hours per 1,000 employees.
The long-term trend in hours not worked due to labour disputes in Canada since 1981 has been of one of relatively rapid decline from 1982 to 1993 and a very slow downward trend until 2006. With the notable exception of 2014, there has been only minor variability since.
Data table for Chart 1
| Hours | |
|---|---|
| 1976 | 204.2 |
| 1977 | 56.2 |
| 1978 | 117.0 |
| 1979 | 124.4 |
| 1980 | 128.9 |
| 1981 | 160.4 |
| 1982 | 86.3 |
| 1983 | 85.9 |
| 1984 | 71.0 |
| 1985 | 50.2 |
| 1986 | 72.7 |
| 1987 | 51.4 |
| 1988 | 59.2 |
| 1989 | 56.8 |
| 1990 | 71.2 |
| 1991 | 36.6 |
| 1992 | 30.9 |
| 1993 | 21.5 |
| 1994 | 22.9 |
| 1995 | 22.1 |
| 1996 | 41.1 |
| 1997 | 24.2 |
| 1998 | 39.2 |
| 1999 | 36.6 |
| 2000 | 18.7 |
| 2001 | 23.3 |
| 2002 | 33.0 |
| 2003 | 18.8 |
| 2004 | 42.9 |
| 2005 | 37.9 |
| 2006 | 9.9 |
| 2007 | 19.1 |
| 2008 | 9.9 |
| 2009 | 18.9 |
| 2010 | 5.9 |
| 2011 | 17.7 |
| 2012 | 6.6 |
| 2013 | 9.0 |
| 2014 | 30.5 |
| 2015 | 16.9 |
| 2016 | 4.9 |
| 2017 | 5.9 |
| 2018 | 6.6 |
| 2019 | 10.2 |
| 2020 | 13.7 |
| 2021 | 9.9 |
|
Note: Due to rounding, estimates and percentages may differ slightly between different Statistics Canada products, such as analytical documents and data tables. Source: Statistics Canada, Labour Force Survey, custom tabulation. |
|
A recent snapshot
There were a similar number of hours not worked due to strikes or lockouts per 1000 employees in the public sector (10.5) compared with the private sector (9.7) in 2021. In most years, a higher number of hours are lost due to labour disputes in the public sector. As noted by the trade union density rate indicator, the proportion of employees who are union members is higher in the public sector compared with the private sector. However, there is variability from year-to-year for a variety of reasons, including the timing of collective bargaining negotiations.
The 2021 decline of 19.0 hours lost per 1,000 employees in the public sector was partly due to a drop of 55.8 hours lost per 1,000 employees in the educational services industry. Hours lost due to labour disputes in this industry were at a relatively high level in 2020. The annual average was pushed up in the context of the February 2020 strike among public school teachers in Ontario.
Start of text box
Information on the indicator
Description or definition
The days not worked due to strikes and lockouts indicator measures annual changes in the hours not worked due to labour disputes per 1,000 employees. In the Labour Force Survey, hours not worked due to labour disputes are one of the many reasons for absence from work that are collected for both part- and full-week absences among employees.
Source
Statistics Canada, Labour Force Survey, 1976 to 2021.
Information for interpretation
For more information on the Labour Force Survey (LFS) methodology and population coverage, please consult the Guide to the Labour Force Survey, 2020.
The LFS estimates are based on a sample and are therefore subject to sampling variability. The analysis focuses on differences between estimates that are statistically significant at the 95% confidence level. Due to rounding, estimates and percentages may differ slightly between different Statistics Canada products, such as analytical documents and data tables.
Industry coding is based on the North American Industry Classification System (NAICS) 2017.
Other related information
Additional Statistics Canada data are available on the following subjects:
End of text box
- Date modified: