
Quality of Employment in Canada
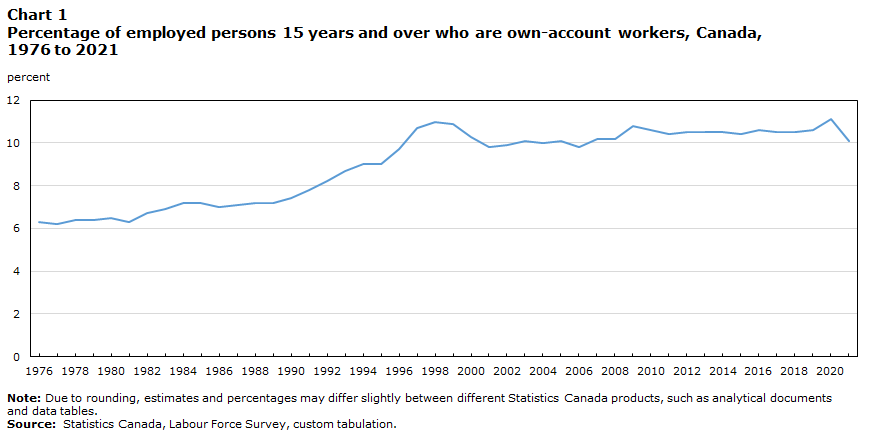
Own-account worker rate, 1976 to 2021
Skip to text
Text begins
Historically, working as an own-account worker in Canada has been most common in the agriculture industry. While the share of own-account workers remains high in agriculture, the industry now represents a smaller proportion of all own-account workers in the Canadian economy than in the past. Professional, scientific and technical services accounted for the largest share (18.0%) of all own-account workers in 2021.
Own-account workers are self-employed workers who may work with one or more partners, but do not have any employees working for them on a continuous basis. Based on available data from the Labour Force Survey (LFS), own-account workers are defined as self-employed workers without employees who are either unincorporated or incorporated. In the context of measuring the quality of employment, this indicator may help highlight the share of workers whose employment status places them in a potentially vulnerable situation in terms of income and social protection. All estimates presented below are based on annual averages from the LFS.
In the context of the COVID-19 pandemic in 2020, the own-account worker rate rose by 0.5 percentage points to 11.1%, with employment declining markedly among employees (-5.5% or 892,000), but recording little change among own-account workers. This pattern reversed in 2021 with the number of own account workers falling by 4.6% (92,000) and the number of employees increasing by 6.4% (968,000). As a result, the proportion of own-account workers dropped to 10.1% in 2021, 0.5 percentage points below the level observed before the pandemic in 2019. The employment decline among own-account workers was especially pronounced for unincorporated own-account workers (-6.7% or 93,000).
Historical trends, 1976 to 2021
In 1976, 6.3% of all employed persons were own-account workers. After trending upward from the late-1980s to the late 1990s, this proportion has remained relatively stable, and was 10.1% in 2021.
From 1976 to 2021, the proportion of own-account workers increased among both men (7.4% to 11.4%) and women (4.4% to 8.6%). Over this period, growth in the number of female own-account workers outpaced gains for their male counterparts (+388.1% compared with +150.4%).
Data table for Chart 1
| Percent | |
|---|---|
| 1976 | 6.3 |
| 1977 | 6.2 |
| 1978 | 6.4 |
| 1979 | 6.4 |
| 1980 | 6.5 |
| 1981 | 6.3 |
| 1982 | 6.7 |
| 1983 | 6.9 |
| 1984 | 7.2 |
| 1985 | 7.2 |
| 1986 | 7.0 |
| 1987 | 7.1 |
| 1988 | 7.2 |
| 1989 | 7.2 |
| 1990 | 7.4 |
| 1991 | 7.8 |
| 1992 | 8.2 |
| 1993 | 8.7 |
| 1994 | 9.0 |
| 1995 | 9.0 |
| 1996 | 9.7 |
| 1997 | 10.7 |
| 1998 | 11.0 |
| 1999 | 10.9 |
| 2000 | 10.3 |
| 2001 | 9.8 |
| 2002 | 9.9 |
| 2003 | 10.1 |
| 2004 | 10.0 |
| 2005 | 10.1 |
| 2006 | 9.8 |
| 2007 | 10.2 |
| 2008 | 10.2 |
| 2009 | 10.8 |
| 2010 | 10.6 |
| 2011 | 10.4 |
| 2012 | 10.5 |
| 2013 | 10.5 |
| 2014 | 10.5 |
| 2015 | 10.4 |
| 2016 | 10.6 |
| 2017 | 10.5 |
| 2018 | 10.5 |
| 2019 | 10.6 |
| 2020 | 11.1 |
| 2021 | 10.1 |
|
Note: Due to rounding, estimates and percentages may differ slightly between different Statistics Canada products, such as analytical documents and data tables. Source: Statistics Canada, Labour Force Survey, custom tabulation. |
|
Own-account workers are most common in the agriculture industry. In 1987, when comparable data on self-employment by industry became available, agriculture (38.8%) and “other services” (excluding public administration)Note (19.7%) were among the industries with the highest proportion of own-account workers. By 2021, despite a long-term decline in overall employment in agriculture, the industry continued to have the highest own-account worker rate (36.2%). The next highest rates of own-account workers were in “other services” (21.2%) and professional, scientific and technical services (20.5%), followed by business, building and other support services (17.5%).
Finance, insurance, real estate, rental and leasing (+8.8 percentage points to 13.1%), transportation and warehousing (+7.6 percentage points to 15.9%), and professional, scientific and technical services (+7.1 percentage points to 20.5%), were the industries with the largest increases in the proportion of own-account workers from 1987 to 2021.
From 1987 to 2021, the characteristics of a typical own-account worker shifted. While 20.7% were employed in agriculture in 1987, the industry only represented 4.8% of all own-account workers in 2021. Professional, scientific and technical services accounted for the largest share (18.0%) of own-account workers across the economy in 2021, followed by construction (12.6%) and healthcare and social assistance (12.1%).
In 1987, Saskatchewan (15.6%), Prince Edward Island (11.0%), Manitoba (10.1%) and Alberta (9.3%) had the highest proportions of own-account workers within their employed populations. By 2021, British Columbia (11.7%), Alberta (11.0%), Saskatchewan (10.8%), and Ontario (10.6%) were the provinces with the highest own-account worker rates. Despite still having one of the highest rates of own-account workers in 2021, the proportion of own-account workers in Saskatchewan declined by 4.8 percentage points from 1987 to 2021—one of the largest decreases among all provinces. This coincides with pronounced declines in the number of workers employed in agriculture over this period in the province.
A recent snapshot
Despite the increase in the own-account worker rate in 2020 followed by its subsequent decrease in 2021, the main characteristics of this group of workers were little affected by the COVID-19 pandemic.
In 2021, there was a slightly higher proportion of own-account workers among men (11.4%) than women (8.6%). Furthermore, own-account workers had an average age of 48.6 years in 2021, and were older than employees, whose average age was 40.4 years. Own-account workers were also more likely to work part-time (32.2%) (less than 30 hours per week) than employees (16.8%).
At the level of major occupational groups, the highest proportion of own-account workers was among managers in natural resources production and fishing, and agriculture, horticulture and aquaculture (60.6%). Professional occupations in art and culture (50.0%) and managers in construction and facility operation and maintenance (35.4%), also had among the highest proportions of own-account workers.
Start of text box
Information on the indicator
Description or definition
The own-account worker indicator is the proportion of the employed population who are own-account workers. Own-account workers are defined as private-sector workers, who are self-employed, do not have employees and are either unincorporated or incorporated.
Source
Statistics Canada, Labour Force Survey, 1976 to 2021.
Information for interpretation
For more information on the Labour Force Survey (LFS) methodology and population coverage, please consult the Guide to the Labour Force Survey, 2020.
The LFS estimates are based on a sample and are therefore subject to sampling variability. The analysis focuses on differences between estimates that are statistically significant at the 95% confidence level. Due to rounding, estimates and percentages may differ slightly between different Statistics Canada products, such as analytical documents and data tables.
Occupations are coded according to the National Occupational Classification (NOC) 2016, while industry coding is based on the North American Industry Classification System (NAICS) 2017.
The United Nations Economic Commission for Europe Expert Group framework defines own-account workers as workers who, working on their own account or with one or more partners, hold a self-employment job and have not engaged on a continuous basis any employees to work for them during the reference period. The partners may or may not be members of the same family or household.
The LFS only asks if a self-employed person had employees during the reference week, and does not ascertain whether these employees are employed “continuously” or not.
Other related information
For more information on self-employment in general, see the article Self-employed Canadians: Who and Why?
Additional Statistics Canada data are available on the following subject:
End of text box
- Date modified: