
Quality of Employment in Canada
Employment rate of mothers and fathers, 1976 to 2021
Skip to text
Text begins
From 1976 to 2021, a major labour market trend in Canada has been an increase in the proportion of mothers in employment. Despite this increase, mothers continue to have a lower employment rate than men (both with and without children), as well as women without children. The level of education has an impact on the employment rate of mothers—mothers with a high school diploma or less have a lower employment rate than mothers with a university degree.
This indicator compares the employment rates of mothers and fathers aged 20 to 49 with the rates of women and men without children in the same age group. In the context of measuring the quality of employment, the indicator may highlight the distribution of care responsibilities between mothers and fathers, as well as the impact of having children on employment.
The indicator defines mothers and fathers as persons aged 20 to 49 living with their own children 17 years or younger. All analyses are based on annual estimates from the Labour Force Survey (LFS).
Public health measures introduced to reduce the spread of COVID-19 resulted in a decrease in labour demand, employment losses, and notable declines in the employment rates of parents and non-parents during the spring of 2020. Employment rates recovered among both parents and non-parents over the remainder of 2020 and 2021, and by 2021 the employment rates of mothers (76.5%) and fathers (91.8%) had largely returned to their 2019 levels. Despite also bouncing back in 2021, the employment rates of women without children (77.6%) and men without children (77.9%) remained below their 2019 levels.
Historical trends, 1976 to 2021
In 1976, 40.5% of mothers were employed. By 2021, this had increased to 76.5%. The 36.0 percentage point rise in the employment rate of mothers occurred alongside a number of important legal and cultural changes related to gender norms and gender roles in Canada.
Fathers had less variation in their employment rate over time. The rate was 93.3% in 1976, and had decreased slightly to 92.2% by 2019. Due to the COVID-19 pandemic, their employment rate fell to 89.4% in 2020, but recovered to 91.8% in 2021.
Women without children also experienced an increase in their employment rate over this period. While the employment rate of men without children (81.2%) was higher than the rate for women without children (72.5%) in 1976, by 2019, women without children (80.1%) had an employment rate that was similar to the rate of their male counterparts (79.4%). This trend reversed in 2020 as the employment rate among men without children temporarily surpassed that of women without children by 1.1 percentage points. By 2021, the employment rate for all individuals without children rebounded, with women (77.6%) and men (77.9%) posting similar rates.

Data table for Chart 1
| Male non-parent | Female non-parent | Fathers | Mothers | |
|---|---|---|---|---|
| percent | ||||
| 1976 | 81.2 | 72.5 | 93.3 | 40.5 |
| 1977 | 79.8 | 72.6 | 92.9 | 41.9 |
| 1978 | 80.6 | 72.8 | 92.8 | 44.3 |
| 1979 | 82.0 | 74.4 | 93.4 | 46.3 |
| 1980 | 82.1 | 74.9 | 92.7 | 48.8 |
| 1981 | 82.0 | 75.8 | 92.9 | 51.0 |
| 1982 | 76.1 | 73.4 | 88.8 | 50.5 |
| 1983 | 74.3 | 73.2 | 88.1 | 51.3 |
| 1984 | 75.3 | 73.5 | 88.8 | 53.1 |
| 1985 | 77.1 | 74.4 | 89.6 | 55.5 |
| 1986 | 78.3 | 75.9 | 90.3 | 58.0 |
| 1987 | 80.0 | 76.2 | 90.6 | 59.6 |
| 1988 | 81.2 | 77.6 | 91.6 | 61.8 |
| 1989 | 81.8 | 78.1 | 91.3 | 63.6 |
| 1990 | 80.2 | 78.5 | 90.3 | 64.1 |
| 1991 | 76.2 | 76.4 | 87.8 | 64.0 |
| 1992 | 74.0 | 75.1 | 86.4 | 63.2 |
| 1993 | 74.4 | 73.6 | 86.3 | 63.6 |
| 1994 | 75.7 | 74.6 | 87.0 | 64.0 |
| 1995 | 76.1 | 75.1 | 87.9 | 64.8 |
| 1996 | 76.0 | 74.7 | 87.9 | 65.5 |
| 1997 | 76.9 | 75.3 | 88.8 | 66.9 |
| 1998 | 78.1 | 76.5 | 89.5 | 68.1 |
| 1999 | 78.9 | 77.0 | 90.2 | 69.5 |
| 2000 | 79.7 | 77.7 | 90.9 | 70.4 |
| 2001 | 79.1 | 77.4 | 90.4 | 71.0 |
| 2002 | 79.3 | 77.8 | 90.0 | 72.2 |
| 2003 | 79.8 | 78.7 | 90.2 | 72.5 |
| 2004 | 79.8 | 78.8 | 90.7 | 73.4 |
| 2005 | 79.7 | 78.5 | 91.0 | 73.5 |
| 2006 | 80.3 | 79.1 | 91.3 | 73.6 |
| 2007 | 80.5 | 79.3 | 91.4 | 74.8 |
| 2008 | 80.8 | 79.6 | 91.4 | 74.5 |
| 2009 | 76.7 | 78.5 | 88.7 | 73.5 |
| 2010 | 77.2 | 77.7 | 89.2 | 73.6 |
| 2011 | 78.2 | 78.0 | 90.1 | 73.7 |
| 2012 | 78.2 | 78.0 | 91.0 | 74.0 |
| 2013 | 77.9 | 78.1 | 91.2 | 74.8 |
| 2014 | 78.0 | 77.9 | 90.7 | 74.1 |
| 2015 | 78.2 | 77.9 | 91.1 | 74.3 |
| 2016 | 77.8 | 78.1 | 90.8 | 74.4 |
| 2017 | 78.8 | 78.9 | 91.6 | 75.4 |
| 2018 | 79.1 | 79.5 | 92.1 | 75.0 |
| 2019 | 79.4 | 80.1 | 92.2 | 76.6 |
| 2020 | 74.0 | 72.9 | 89.4 | 74.1 |
| 2021 | 77.9 | 77.6 | 91.8 | 76.5 |
|
Note: Due to rounding, estimates and percentages may differ slightly between different Statistics Canada products, such as analytical documents and data tables. Source: Statistics Canada, Labour Force Survey, custom tabulation. |
||||
A recent snapshot
Among the four groups—men and women with, and without children—fathers had the highest employment rate in 2021.
One demographic factor which partly explains why fathers typically have a higher employment rate than men and women without children is their age. In 2021, a vast majority of fathers were in their 30s and 40s, an age range which typically has a higher employment rate. At the same time, about half of men and women without children were in their 20s.
The COVID-19 pandemic disproportionately impacted employment among 20-to-29 year-olds. In 2020, the employment rate in this group decreased by 7.6 percentage points, compared with 3.3 percentage points for 30-to-39 year-olds and 3.4 percentage points for 40-to-49 year-olds. Although employment among youth aged 20 to 29 increased by 225,000 (+6.6%) in 2021, people in this age group continued to have a lower employment rate (73.3%) than 30-to-39 year olds (82.7%) and 40-to-49 year-olds (83.7%).
Part of the larger decline in the employment rate of people aged 20 to 29 during the pandemic is attributable to their greater concentration in sales and service occupations; an occupational group which accounted for more than half of net job losses (55.9%) across the three age groups in 2020. In 2019, 32.0% of workers aged 20 to 29 worked in sales and service occupations, compared with 18.3% among those aged 30 to 39 and 17.6% among workers aged 40 to 49.
While mothers had a lower employment rate than non-mothers before the pandemic, mothers are older than non-mothers on average and experienced a smaller decline in their employment rate in 2020 (-2.5 percentage points compared with -7.2 percentage points). However, in 2021, non-mothers experienced a greater increase in their employment rate (+4.7 percentage points) than mothers (+2.4 percentage points) and non-mothers returned to having a higher employment rate (77.6% compared with 76.5%).
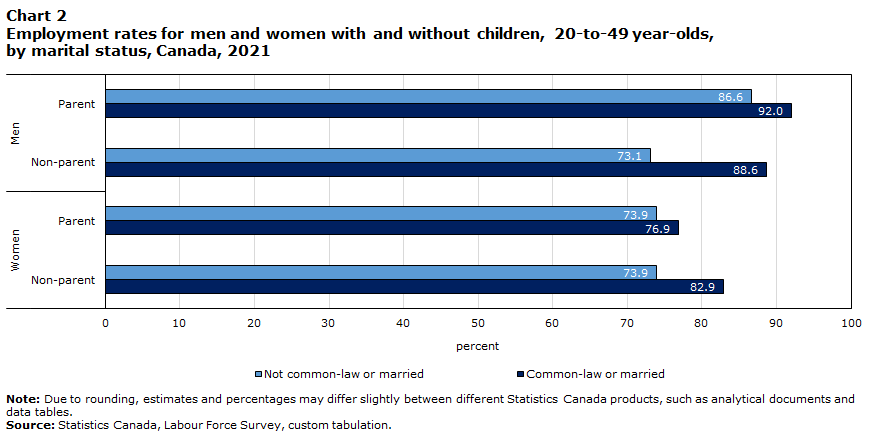
Marital status also continued to be associated with differences in employment rates, particularly among men.
Before and during the COVID-19 pandemic, men who were married or in a common-law relationship had a higher employment rate than men who were not, regardless of their status as a parent. Similarly, women who were married or in a common-law relationship also had a higher employment rate, irrespective of their parental status. This pattern continued into 2021 for both groups.
Data table for Chart 2
| Marital status | Women | Men | ||
|---|---|---|---|---|
| Non-parent | Parent | Non-parent | Parent | |
| percent | ||||
| Not common-law or married | 73.9 | 73.9 | 73.1 | 86.6 |
| Common-law or married | 82.9 | 76.9 | 88.6 | 92.0 |
|
Note: Due to rounding, estimates and percentages may differ slightly between different Statistics Canada products, such as analytical documents and data tables. Source: Statistics Canada, Labour Force Survey, custom tabulation. |
||||
In 2021, fathers with at least a bachelor’s degree (94.0%), with postsecondary education below a bachelor’s degree (92.7%), or with a high school diploma or less (86.2%) had higher employment rates than mothers with the corresponding level of education. When comparing fathers to men who were not parents, fathers had higher employment rates, no matter the level of educational attainment.
There were proportionally more mothers in employment among those who had higher levels of education. The employment rate for mothers with at least a bachelor’s degree was 82.8%, while it was 77.1% for mothers with postsecondary education below a bachelor’s degree, and 57.8% for those with a high school diploma or less.
Start of text box
Information on the indicator
Description or definition
The employment rate of mothers and fathers indicator is the percentage of mothers and fathers who are in employment.
Source
Statistics Canada, Labour Force Survey, 1976 to 2021.
Information for interpretation
For more information on the Labour Force Survey (LFS) methodology and population coverage, please consult the Guide to the Labour Force Survey, 2020.
The LFS estimates are based on a sample and are therefore subject to sampling variability. The analysis focuses on differences between estimates that are statistically significant at the 95% confidence level. Due to rounding, estimates and percentages may differ slightly between different Statistics Canada products, such as analytical documents and data tables.
The definition of mothers and fathers is restricted to persons aged 20 to 49 who live in the same household as at least one of their own children aged 17 years or younger. The effect of having children and the challenges related to work-life balance are unlikely to be the same for parents of adult children living at home.
Other related information
Additional Statistics Canada data are available on the following subject:
End of text box
- Date modified: