
Quality of Employment in Canada
Pay gap, 1998 to 2021
Skip to text
Text begins
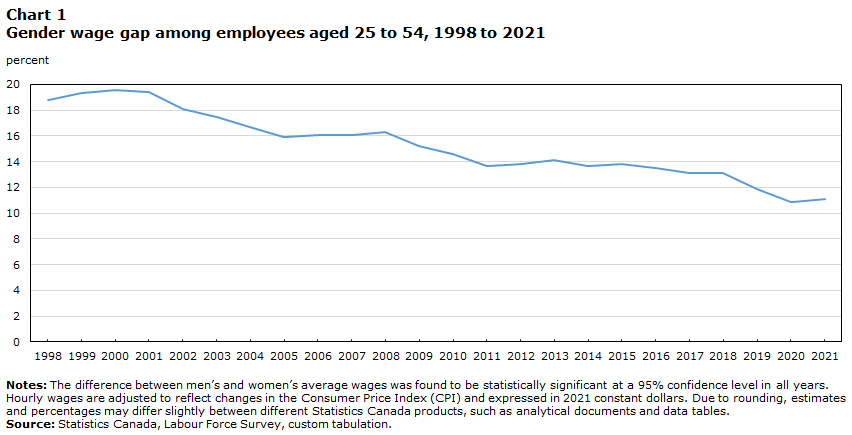
Although the gender gap in hourly wages declined from 1998 to 2021 among employees in Canada, male employees continued to have higher hourly earnings than female employees in 2021. The distribution of male and female employees across industries plays a key role in explaining this gap, particularly the higher proportion of men working in highly paid industries such as construction.
The difference in gross hourly earnings between sub-population groups can be a partial indicator of the degree of equal opportunity or discrimination in the labour market. Average hourly wages may differ between some groups for a variety of reasons, including the level of educational attainment, work experience, industry of job, occupation or the share of part-time employment. As the “raw” or “unadjusted” wage gap does not account for these differences in observable characteristics, it is but a first step for understanding wage differences between sub-populations.
The following analysis focuses on the gender gap in the self-reported gross hourly wages of employees in the core working ages of 25 to 54, as captured by the Labour Force Survey (LFS). The gender wage gap is the difference in average hourly earnings between men and women expressed as a proportion of men’s average hourly earnings. A short section on pay gaps among population groups designated as visible minorities is also included. Unless otherwise stated, hourly wages are adjusted for the Consumer Price Index (CPI) and expressed in 2021 constant dollars.
In 2021, female employees earned 11.1% less per hour than male employees, with the wage gap little changed compared with 2020.
Historical trends, 1998 to 2021
Among employees aged 25 to 54, the gender wage gap decreased 7.7 percentage points to 11.1% from 1998 to 2021. Wages grew faster for core-aged women than for core-aged men over this period. Specifically, the average hourly wages of female employees increased 28.6%, while men’s increased 17.4%.
Data table for Chart 1
| Percent | |
|---|---|
| 1998 | 18.8 |
| 1999 | 19.3 |
| 2000 | 19.6 |
| 2001 | 19.4 |
| 2002 | 18.1 |
| 2003 | 17.5 |
| 2004 | 16.7 |
| 2005 | 15.9 |
| 2006 | 16.1 |
| 2007 | 16.1 |
| 2008 | 16.3 |
| 2009 | 15.2 |
| 2010 | 14.6 |
| 2011 | 13.7 |
| 2012 | 13.8 |
| 2013 | 14.1 |
| 2014 | 13.7 |
| 2015 | 13.8 |
| 2016 | 13.5 |
| 2017 | 13.1 |
| 2018 | 13.1 |
| 2019 | 11.9 |
| 2020 | 10.9 |
| 2021 | 11.1 |
|
Notes: The difference between men’s and women’s average wages was found to be statistically significant at a 95% confidence level in all years. Hourly wages are adjusted to reflect changes in the Consumer Price Index (CPI) and expressed in 2021 constant dollars. Due to rounding, estimates and percentages may differ slightly between different Statistics Canada products, such as analytical documents and data tables. Source: Statistics Canada, Labour Force Survey, custom tabulation. |
|
The reduction in the gender wage gap from 1998 to 2018 is largely explained by changes relating to three factors: the distribution of men and women across occupations; women’s increased educational attainment; and the decline in the share of men in unionized employment. Similar results are found when considering all employees aged 15 and older.
From 2018 to 2021 the largest contributor to the decline in the pay gap was industry of employment, followed by occupation, and educational attainment. Over this period, the share of men working in construction (-0.6 percentage points to 11.9%) and manufacturing (-1.3 percentage points to 14.3%) declined.
More information on the analysis of the gender pay gap can be found in the publication: The gender wage gap in Canada: 1998 to 2018.
A recent snapshot
In 2021, female employees aged 25 to 54 earned $3.79 (11.1%) less per hour, on average, than their male counterparts. In other words, women in this age group earned $0.89 for every dollar earned by men.
The industrial distribution of female and male employees plays a key role in explaining this gap, particularly the over-representation of men in the more highly paid industries of construction, manufacturing, and mining, quarrying, and oil and gas extraction. Women’s higher rate of part-time work, which has lower average wages than full-time work, also contributed notably to the gender wage gap in 2021.
While the above-noted factors were important, nearly two-thirds of the gender wage gap in 2021 was unexplained by standard controls for human capital, job attributes, occupation and industry, and demographics. This is consistent with studies of the gender wage gap in countries such as the United States and United Kingdom.
Pay gaps among population groups designated as visible minorities
Pay gaps also exist among visible minority groups. In 2021, Filipino employees aged 25 to 54 earned $0.74 for every dollar earned by an employee who was not Indigenous nor a visible minority—a pay gap of 25.9%. The pay gap between core-aged Black employees and non-visible minority employees was 16.1%. In contrast, Chinese employees aged 25 to 54 ($33.83) earned about the same per hour as non-visible minority employees ($33.44).
| Visible minority group | Average hourly earnings |
|---|---|
| dollars | |
| South Asian | 31.23 |
| Chinese | 33.83 |
| Black | 28.07 |
| Filipino | 24.79 |
| Arab | 29.83 |
| Latin American | 29.17 |
| Southeast Asian | 29.82 |
| West Asian | 29.54 |
| Korean | 30.77 |
| Japanese | 34.56 |
| Visible minority not included elsewhere | 29.94 |
| Multiple visible minorities | 30.90 |
| Not Indigenous or a visible minority | 33.44 |
|
Note: Due to rounding, estimates and percentages may differ slightly between different Statistics Canada products, such as analytical documents and data tables. Due to a distinct weighting strategy, the average hourly wage of Indigenous employees living off-reserve is not available in the LFS supplement on a comparable basis. Data on the wages of Indigenous employees are available in table 14-10-0370-01. Source: Statistics Canada, Labour Force Survey Supplement, custom tabulation. |
|
Information on the indicator
Description or definition
The pay gap indicator is based on the self-reported usual hourly wages of paid employees aged 25 to 54 at their main job. The wage gap is calculated as:
Source
Statistics Canada, Labour Force Survey, 1998 to 2021 and Labour Force Survey Supplement, 2021.
Information for interpretation
For more information on the Labour Force Survey (LFS) methodology and population coverage, please consult the Guide to the Labour Force Survey, 2020.
The LFS estimates are based on a sample and are therefore subject to sampling variability. The analysis focuses on differences between estimates that are statistically significant at the 95% confidence level. Due to rounding, estimates and percentages may differ slightly between different Statistics Canada products, such as analytical documents and data tables.
Occupations are coded according to the National Occupational Classification (NOC) 2016, while industry coding is based on the North American Industry Classification System (NAICS) 2017.
Beginning in January 1997, information is collected on the usual wages or salaries of employees at their main job. Respondents are asked to report their wage/salary before taxes and other deductions, and include tips and commissions. Weekly and hourly wages/salaries are calculated on the basis of usual paid work hours per week. Average hourly wages, average weekly wages and wage distributions can then be cross-tabulated by other characteristics such as age, sex, education, occupation, and union status. In the present article, the analysis is restricted to the 23-year period of 1998 to 2021.
Hourly wages are used rather than weekly earnings or annual income, in order to avoid comparing different quantities of work. Real hourly wages were calculated from these nominal hourly wages, by dividing them by the Consumer Price Index (CPI) for the year, then multiplying the result by 100. For this study, CPI=100 in 2021, meaning that results are presented in 2021 constant dollars.
CPI values are from Statistics Canada Table 18-10-0005-01: Consumer Price Index, annual average, not seasonally adjusted.
Other related information
For more information, see: The gender wage gap in Canada: 1998 to 2018.
Additional Statistics Canada data are available on the following subject:
End of text box
- Date modified: