
Latest Developments in the Canadian Economic Accounts
An analysis of Canadian business support programs in response to the global COVID-19 pandemic
Skip to text
Text begins
Acknowledgements
This work would not have been possible without the invaluable contributions and expertise of innumerable dedicated staff from Statistics Canada including Amanda Sinclair, Andreas Trau, Brandon Murray, Brenda Bugge, Carolina Cabañas-Leòn, Danielle Lafontaine-Sorgo, Dave Krochmalnek, Dave Stiles, Dovile Séguin, Jason Fu, Jennifer Withington, Jonathan Aikens, Joycelyn Francisco, Mingyu Yu, Monique Deschambault, Nathalie Bisson, Peter Cordeiro, Pierre-Louis Venne, Robert Campbell, Simon Bourassa-Viau, Stephen West, Steven Miscione, Tasmin Pan, and Xiang Zhou. Additional thanks to those who provided invaluable feedback and suggestions.
Introduction
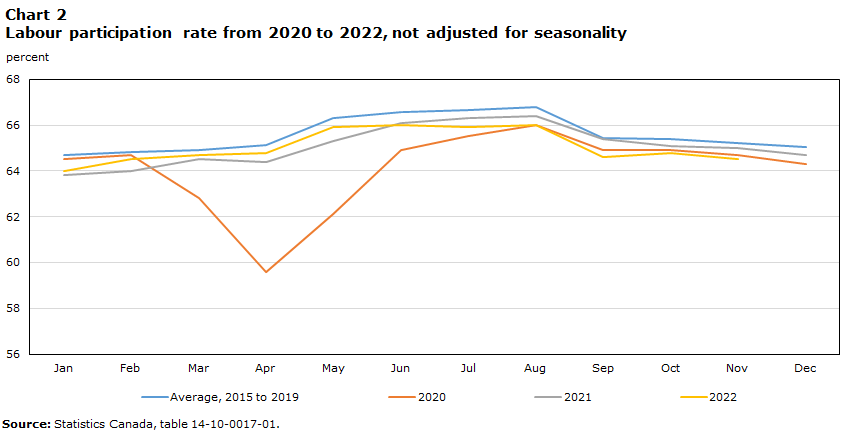
On March 11, 2020, the World Health Organization (WHO) officially declared a pandemic related to the emergence of severe acute respiratory syndrome coronavirus 2 (SARS-CoV-2) and the resultant and accelerating progression of COVID-19, the concomitant disease, across the globeNote . This event caused, and continues to cause, significant disruptions in people’s health and way of life, the global economy, and the financial system. Like other countries, Canada was greatly affected by this event, as all levels of government enacted a range of public health measures including lockdowns and other restrictions meant to slow the spread of COVID-19 and ease the strain on the healthcare system. These led to significant, but predictable impacts on the economy including a steep rise in unemploymentNote , a drastic drop in revenues and output among many industriesNote , and an overall disruption to economic activity including consumer expenditures on many goods and services. Compared with the great recession and global financial crisis that affected the Canadian economy starting in late 2008, the COVID-19 pandemic has had a more acute impact akin to a natural disaster. During the global financial crisis, real gross domestic product (GDP) fell 2.3% in the first quarter of 2009 whereas in the second quarter of 2020 GDP contracted 10.9% (Chart 1). The economic rebound in the COVID-19 era was also noticeably sharper. By the end of 2021, real GDP had reached its pre-pandemic level with the easing of restrictions and the pickup in consumer demand. Labour markets largely recovered as the participation rate nearly returned to pre-pandemic levels (Chart 2). However, new challenges to economic expansion arose in the form of rising and persistent inflation, conflict induced commodity disruptions, and supply-chain instabilities.

Data table for Chart 1
| Real GDP (chained dollars, seasonally adjusted, left axis) | Quarterly GDP growth (seasonally adjusted, right axis) | Unemployment rate (unadjusted, right axis) | |
|---|---|---|---|
| billions, $CAD | percent | ||
| 2000 | |||
| Q1 | 1,426.8 | 1.6 | 7.3 |
| Q2 | 1,443.8 | 1.2 | 6.7 |
| Q3 | 1,458.5 | 1.0 | 6.8 |
| Q4 | 1,461.0 | 0.2 | 6.4 |
| 2001 | |||
| Q1 | 1,468.7 | 0.5 | 7.5 |
| Q2 | 1,472.7 | 0.3 | 7.1 |
| Q3 | 1,471.7 | -0.1 | 7.1 |
| Q4 | 1,480.6 | 0.6 | 7.1 |
| 2002 | |||
| Q1 | 1,502.6 | 1.5 | 8.5 |
| Q2 | 1,511.5 | 0.6 | 7.7 |
| Q3 | 1,524.6 | 0.9 | 7.5 |
| Q4 | 1,532.9 | 0.5 | 7.0 |
| 2003 | |||
| Q1 | 1,541.4 | 0.6 | 7.9 |
| Q2 | 1,539.1 | -0.1 | 7.7 |
| Q3 | 1,544.9 | 0.4 | 7.7 |
| Q4 | 1,555.5 | 0.7 | 7.0 |
| 2004 | |||
| Q1 | 1,566.7 | 0.7 | 7.8 |
| Q2 | 1,585.3 | 1.2 | 7.2 |
| Q3 | 1,604.1 | 1.2 | 7.1 |
| Q4 | 1,615.6 | 0.7 | 6.7 |
| 2005 | |||
| Q1 | 1,621.2 | 0.3 | 7.4 |
| Q2 | 1,632.9 | 0.7 | 6.8 |
| Q3 | 1,652.7 | 1.2 | 6.8 |
| Q4 | 1,669.1 | 1.0 | 6.1 |
| 2006 | |||
| Q1 | 1,682.6 | 0.8 | 6.9 |
| Q2 | 1,683.5 | 0.1 | 6.2 |
| Q3 | 1,688.2 | 0.3 | 6.5 |
| Q4 | 1,694.9 | 0.4 | 5.8 |
| 2007 | |||
| Q1 | 1,705.7 | 0.6 | 6.6 |
| Q2 | 1,722.3 | 1.0 | 6.1 |
| Q3 | 1,729.5 | 0.4 | 6.0 |
| Q4 | 1,731.5 | 0.1 | 5.5 |
| 2008 | |||
| Q1 | 1,732.8 | 0.1 | 6.4 |
| Q2 | 1,739.1 | 0.4 | 6.1 |
| Q3 | 1,753.3 | 0.8 | 6.2 |
| Q4 | 1,733.0 | -1.2 | 6.1 |
| 2009 | |||
| Q1 | 1,693.8 | -2.3 | 8.4 |
| Q2 | 1,675.3 | -1.1 | 8.6 |
| Q3 | 1,682.9 | 0.4 | 8.6 |
| Q4 | 1,702.5 | 1.2 | 7.9 |
| 2010 | |||
| Q1 | 1,723.0 | 1.2 | 8.9 |
| Q2 | 1,732.1 | 0.5 | 8.2 |
| Q3 | 1,744.3 | 0.7 | 8.2 |
| Q4 | 1,763.8 | 1.1 | 7.2 |
| 2011 | |||
| Q1 | 1,777.1 | 0.8 | 8.2 |
| Q2 | 1,780.6 | 0.2 | 7.6 |
| Q3 | 1,805.2 | 1.4 | 7.5 |
| Q4 | 1,819.4 | 0.8 | 7.0 |
| 2012 | |||
| Q1 | 1,820.6 | 0.1 | 7.9 |
| Q2 | 1,826.5 | 0.3 | 7.3 |
| Q3 | 1,829.0 | 0.1 | 7.3 |
| Q4 | 1,832.8 | 0.2 | 6.8 |
| 2013 | |||
| Q1 | 1,849.2 | 0.9 | 7.6 |
| Q2 | 1,859.9 | 0.6 | 7.1 |
| Q3 | 1,875.1 | 0.8 | 7.2 |
| Q4 | 1,894.8 | 1.1 | 6.6 |
| 2014 | |||
| Q1 | 1,897.9 | 0.2 | 7.5 |
| Q2 | 1,915.2 | 0.9 | 7.1 |
| Q3 | 1,933.6 | 1.0 | 7.0 |
| Q4 | 1,947.0 | 0.7 | 6.2 |
| 2015 | |||
| Q1 | 1,936.3 | -0.5 | 7.2 |
| Q2 | 1,931.0 | -0.3 | 6.9 |
| Q3 | 1,937.8 | 0.4 | 7.1 |
| Q4 | 1,939.3 | 0.1 | 6.5 |
| 2016 | |||
| Q1 | 1,949.9 | 0.5 | 7.7 |
| Q2 | 1,940.3 | -0.5 | 7.0 |
| Q3 | 1,960.3 | 1.0 | 7.1 |
| Q4 | 1,971.4 | 0.6 | 6.4 |
| 2017 | |||
| Q1 | 1,992.8 | 1.1 | 7.2 |
| Q2 | 2,013.2 | 1.0 | 6.5 |
| Q3 | 2,021.7 | 0.4 | 6.4 |
| Q4 | 2,032.1 | 0.5 | 5.5 |
| 2018 | |||
| Q1 | 2,049.9 | 0.9 | 6.3 |
| Q2 | 2,066.0 | 0.8 | 6.0 |
| Q3 | 2,080.3 | 0.7 | 6.1 |
| Q4 | 2,087.4 | 0.3 | 5.3 |
| 2019 | |||
| Q1 | 2,088.8 | 0.1 | 6.2 |
| Q2 | 2,109.5 | 1.0 | 5.6 |
| Q3 | 2,117.4 | 0.4 | 5.8 |
| Q4 | 2,124.3 | 0.3 | 5.3 |
| 2020 | |||
| Q1 | 2,079.1 | -2.1 | 6.8 |
| Q2 | 1,851.9 | -10.9 | 13.1 |
| Q3 | 2,018.9 | 9.0 | 10.3 |
| Q4 | 2,061.9 | 2.1 | 8.1 |
| 2021 | |||
| Q1 | 2,088.9 | 1.3 | 8.8 |
| Q2 | 2,076.6 | -0.6 | 8.1 |
| Q3 | 2,106.3 | 1.4 | 7.3 |
| Q4 | 2,141.5 | 1.7 | 5.7 |
| 2022 | |||
| Q1 | 2,156.1 | 0.7 | 6.1 |
| Q2 | 2,173.2 | 0.8 | 5.1 |
| Q3 | 2,189.1 | 0.7 | 5.3 |
|
Note: The shaded areas represent the Great recession (from Q4 2008 to Q3 2010) and COVID-19 pandemic (Q1 2020 to Q3 2021). Both timespans are measured as the first quarter of decline in real GDP up to and including the quarter when real GDP reached pre-event levels. Source: Statistics Canada, tables 14-10-0077-01, 36-10-0104-01. |
|||
Data table for Chart 2
| Average, 2015 to 2019 | 2020 | 2021 | 2022 | |
|---|---|---|---|---|
| percent | ||||
| January | 64.7 | 64.5 | 63.8 | 64.0 |
| February | 64.8 | 64.7 | 64.0 | 64.5 |
| March | 64.9 | 62.8 | 64.5 | 64.7 |
| April | 65.1 | 59.6 | 64.4 | 64.8 |
| May | 66.3 | 62.1 | 65.3 | 65.9 |
| June | 66.6 | 64.9 | 66.1 | 66.0 |
| July | 66.6 | 65.5 | 66.3 | 65.9 |
| August | 66.8 | 66.0 | 66.4 | 66.0 |
| September | 65.4 | 64.9 | 65.4 | 64.6 |
| October | 65.4 | 64.9 | 65.1 | 64.8 |
| November | 65.2 | 64.7 | 65.0 | 64.5 |
| December | 65.0 | 64.3 | 64.7 | Note ...: not applicable |
|
... not applicable Source: Statistics Canada, table 14-10-0017-01. |
||||
In response to the COVID-19 pandemic, governments around the word implemented policies, both fiscal and monetary, and launched support programs meant to blunt the economic and financial distress created by the pandemic and associated health measures. These efforts were unprecedented in both their size and swiftness, with significant amounts of funds distributed from government coffers within weeks of the WHO declaration. In Canada, the federal government announced numerous financial support measures over the course of 2020, with new programs coming online in 2021 as successors to previously phased out initiatives and more targeted interventions as the situation continued to evolve. These programs served both households and businesses with some supports directly funded and administered by the federal government while others were funded by the federal government but administered by federal government business enterprisesNote .
The Canadian COVID-19 Business Support Measures database
This introductory paper will focus on specific COVID-19 support programs that were available to businesses in Canada since 2020 with the objective of providing a high level, but comprehensive overview of the overall uptake of business support programs across a range of characteristics. To accomplish this, data across an array of programs has been organized in terms of structure and classifications (i.e., industry, business size) and integrated into a consistent dataset referred to as the Canadian COVID-19 Business Support Measures database (CCBSM). Results are drawn from a preliminary version of the CCBSMLE, which is based on the legal entity concept (i.e., incorporated and unincorporated businesses and partnerships) and captures information from the program applicant perspective. As such, the CCBSMLE represents a consolidated administrative file covering claimants at the same level they would file taxes for their businessNote . For groups of corporations that comprise larger and complex enterprises, each legal entity is treated as its own unique business. For the purposes of this paper, the term business and legal entity will be used interchangeably. The process used to allocate program amounts by industry, sector, and business size as well as the vintage of source data result in estimates that may not necessarily align with official program costs.
Table 1 provides an overview of the eight measures covered by the CCBSM, which account for the bulk of government outlays on COVID-19 business support and covers the major programs announced by the federal government. However, this list is not exhaustive, and measures enacted by other levels of government as well as smaller programs are omitted. In addition, future policies may still be adopted. As such, the CCBSM data referenced in this paper includes information updated as of November 2nd, 2022.
| COVID-19 Measure | Brief Description |
|---|---|
| Canada Emergency Wage Subsidy (CEWS) | A subsidy for eligible businesses, charities, and non-profits covering salary, wages, certain taxable benefits, and fees/commissions. |
| Canada Recovery Hiring Program (CRHP) | A subsidy for eligible businesses, charities, and non-profits covering salary, wages, certain taxable benefits, and fees/commissions. |
| Canada Emergency Commercial Rent Assistance (CECRA) | A subsidy for eligible businesses, charities, and non-profits covering 50 percent of three to six monthly rent payments for commercial property between the months of April and September 2020. |
| Canada Emergency Rent Subsidy (CERS) | A subsidy for eligible businesses, charities, and non-profits covering real or immovable property that does not generate primarily rental income. |
| Tourism and Hospitality Recovery Program (THRP) | A combined wage and rent subsidy targeting specific sectors of the tourism and hospitality industry that continued to face difficulties due to COVID-19. |
| Hardest-Hit Business Recovery Program (HHBRP) | A combined wage and rent subsidy targeting those businesses that continued to face significant challenges, but who did not qualify for the THRP. |
| Canadian Emergency Business Account (CEBA) | An interest-free loan for eligible businesses and non-profits of up to $60,000. Repaying the balance of the loan on or before December 31, 2023 will result in loan forgiveness of up to 33 percent (up to $20,000). |
| Large Employer Emergency Financing Facility (LEEFF) | An interest-bearing term loan for large employers of at least $60 million. Eligible businesses were required to have significant operations in Canada or support a significant workforce in Canada. |
| Source: Statistics Canada, "Statistics Canada, An analysis of Canadian business support programs in response to the global COVID-19 pandemic", Latest Developments in the Canadian Economic Accounts (13-605-X), 2023. | |
Business supports peak at outset of pandemic
Within a month after the pandemic was officially declared, the federal government had announced and began to roll out a set of measures, some effective retroactively, to help counter the initial widespread lockdowns. The two largest of these programs were CEWS and CEBA, each accounting for roughly half of the business support funds provided in the second quarter of 2020 (Chart 3).

Data table for Chart 3
| Canada Emergency Wage Subsidy (CEWS) | Canada Recovery Hiring Program (CRHP) | Canada Emergency Commercial Rent Assistance (CECRA) | Canada Emergency Rent Subsidy (CERS) | Tourism and Hospitality Recovery and Hardest-Hit Business Recovery Programs | Canadian Emergency Business Account (CEBA) | Large Employer Emergency Financing Facility (LEEFF) | Lockdown Support (LS) | Total | |
|---|---|---|---|---|---|---|---|---|---|
| millions $CAD | |||||||||
| 2020 | |||||||||
| Q1 | 4,547 | Note ...: not applicable | Note ...: not applicable | Note ...: not applicable | Note ...: not applicable | Note ...: not applicable | Note ...: not applicable | Note ...: not applicable | 4,547 |
| Q2 | 30,448 | Note ...: not applicable | 1,130 | Note ...: not applicable | Note ...: not applicable | 27,309 | Note ...: not applicable | Note ...: not applicable | 58,887 |
| Q3 | 23,768 | Note ...: not applicable | 904 | 55 | Note ...: not applicable | 2,856 | 60 | 5 | 27,648 |
| Q4 | 12,262 | Note ...: not applicable | 0 | 1,783 | Note ...: not applicable | 7,972 | 50 | 245 | 22,312 |
| 2021 | |||||||||
| Q1 | 11,730 | Note ...: not applicable | Note ...: not applicable | 1,943 | Note ...: not applicable | 6,685 | 204 | 390 | 20,952 |
| Q2 | 11,712 | 56 | Note ...: not applicable | 1,839 | Note ...: not applicable | 2,264 | 1,499 | 380 | 17,750 |
| Q3 | 5,798 | 432 | Note ...: not applicable | 922 | Note ...: not applicable | 499 | 725 | 83 | 8,459 |
| Q4 | 415 | 452 | Note ...: not applicable | 73 | 1364 | -615 | -220 | 13 | 1,482 |
| 2022 | |||||||||
| Q1 | Note ...: not applicable | 266 | Note ...: not applicable | Note ...: not applicable | 1,782 | -2,520 | 240 | Note ...: not applicable | -232 |
| Q2 | Note ...: not applicable | 121 | Note ...: not applicable | Note ...: not applicable | 139 | -830 | 34 | Note ...: not applicable | -536 |
| Q3 | Note ...: not applicable | 0 | Note ...: not applicable | Note ...: not applicable | 0 | -904 | 96 | Note ...: not applicable | -808 |
|
... not applicable Note: CEBA and LEEFF amounts reflect the change in the stock of loans. These quarterly estimates may not align to the annual values from the CCBSM given different data vintages and allocation methods. Source: Statistics Canada, table 36-10-0687-01. |
|||||||||
Wage subsidies served as the primary vehicle of support
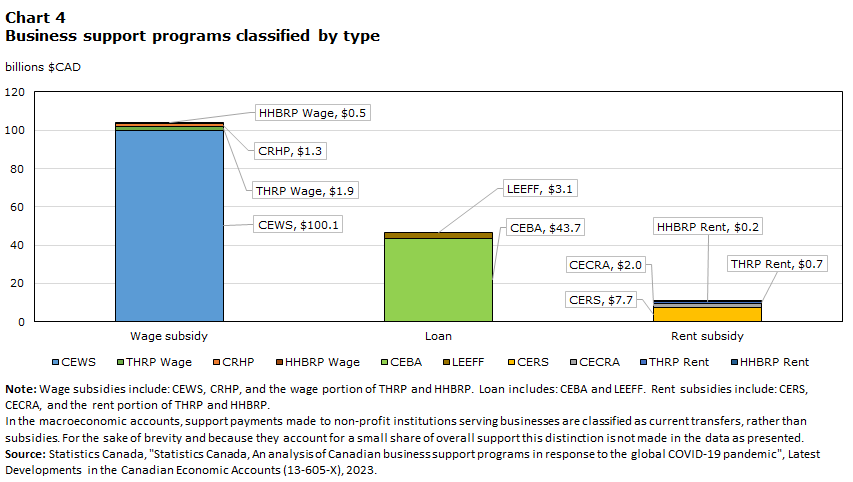
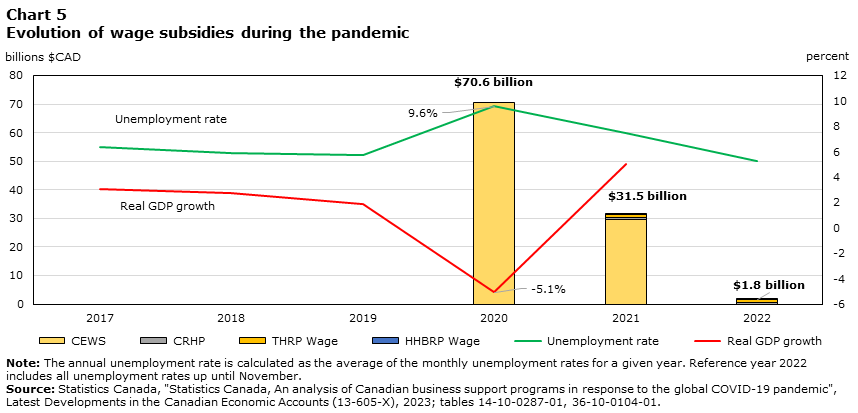
Overall, from March 2020 to June 2022, wage and rent support programs totalled approximately $114 billionNote , representing 71% of the total funds provided to businesses while loans accounted for the remaining 29% ($47 billion). As the largest portion of the total measures, wage subsidiesNote accounted for 62% of funds disbursed with CEWS as the dominate contributor representing 96% of total wage subsidies (Chart 4). CEWS was the principal wage subsidy program during the first year of the pandemic in 2020 as real GDP declined 5.1% annually and the unemployment rate reached almost 10% for the year (Chart 5), peaking in the month of May at 13.4%Note . During this period many businesses scaled back production and furloughed workers. Against this backdrop, wage subsidies such as CEWS helped businesses that were significantly impacted by the pandemic to retain their workforce until economic activity resumed. Without CEWS, the unemployment rate would likely have been higher as these subsidies acted as a buffer to lessen financial hardships faced by businesses and their employees.
Data table for Chart 4
| Support Program | Wage subsidy | Loan | Rent subsidy |
|---|---|---|---|
| billions $CAD | |||
| CEWS | 100.06 | Note ...: not applicable | Note ...: not applicable |
| THRP Wage | 1.92 | Note ...: not applicable | Note ...: not applicable |
| CRHP | 1.34 | Note ...: not applicable | Note ...: not applicable |
| HHBRP Wage | 0.48 | Note ...: not applicable | Note ...: not applicable |
| CEBA | Note ...: not applicable | 43.73 | Note ...: not applicable |
| LEEFF | Note ...: not applicable | 3.10 | Note ...: not applicable |
| CERS | Note ...: not applicable | Note ...: not applicable | 7.69 |
| CECRA | Note ...: not applicable | Note ...: not applicable | 2.03 |
| THRP Rent | Note ...: not applicable | Note ...: not applicable | 0.68 |
| HHBRP Rent | Note ...: not applicable | Note ...: not applicable | 0.16 |
|
... not applicable Note: Wage subsidies include: CEWS, CRHP, and the wage portion of TRHP and HHBRP. Loan includes: CEBA and LEEFF. Rent subsidies include: CERS, CECRA, and the rent portion of THRP and HHBRP. In the macroeconomic accounts, support payments made to non-profit institutions serving businesses are classified as current transfers, rather than subsidies. For the sake of brevity and because they account for a small share of overall support this distinction is not made in the data as presented. Source: Statistics Canada, "Statistics Canada, An analysis of Canadian business support programs in response to the global COVID-19 pandemic", Latest Developments in the Canadian Economic Accounts (13-605-X), 2023. |
|||
In 2021, with the rising vaccination rate and the re-opening of businesses, the general economic situation improved and the pool of affected businesses and the degree to which they were affected became smaller. As the unemployment rate trended lower, business revenues recovered, and the formula and qualification criteria for determining CEWS subsidies evolvedNote , the level of wage subsidies fell by more than half from 2020 to 2021. By 2022, the employment situation across the country had recovered to pre-pandemic levels. CEWS and CERS, having ended in October 2021, were replaced by new programs, including the THRP and HHBRB, each offering wage and rent support to specific industries or more affected businesses. Together with CRHP, the number of applicant and eligible businesses for such subsidies decreased significantly at the end of 2021 and into 2022.
Data table for Chart 5
| CEWS | CRHP | THRP Wage | HHBRP Wage | Unemployment rate | Real GDP growth | |
|---|---|---|---|---|---|---|
| billions of dollars | percent | |||||
| 2017 | Note ...: not applicable | Note ...: not applicable | Note ...: not applicable | Note ...: not applicable | 6.4 | 3.0 |
| 2018 | Note ...: not applicable | Note ...: not applicable | Note ...: not applicable | Note ...: not applicable | 5.9 | 2.8 |
| 2019 | Note ...: not applicable | Note ...: not applicable | Note ...: not applicable | Note ...: not applicable | 5.8 | 1.9 |
| 2020 | 70.58 | Note ...: not applicable | Note ...: not applicable | Note ...: not applicable | 9.6 | -5.1 |
| 2021 | 29.49 | 0.95 | 0.80 | 0.23 | 7.4 | 5.0 |
| 2022 | Note ...: not applicable | 0.39 | 1.12 | 0.25 | 5.3 | Note ...: not applicable |
|
... not applicable Note: The annual unemployment rate is calculated as the average of the monthly unemployment rates for a given year. Reference year 2022 includes all unemployment rates up until November. Source: Statistics Canada, "Statistics Canada, An analysis of Canadian business support programs in response to the global COVID-19 pandemic", Latest Developments in the Canadian Economic Accounts (13-605-X), 2023; tables 14-10-0287-01, 36-10-0104-01. |
||||||
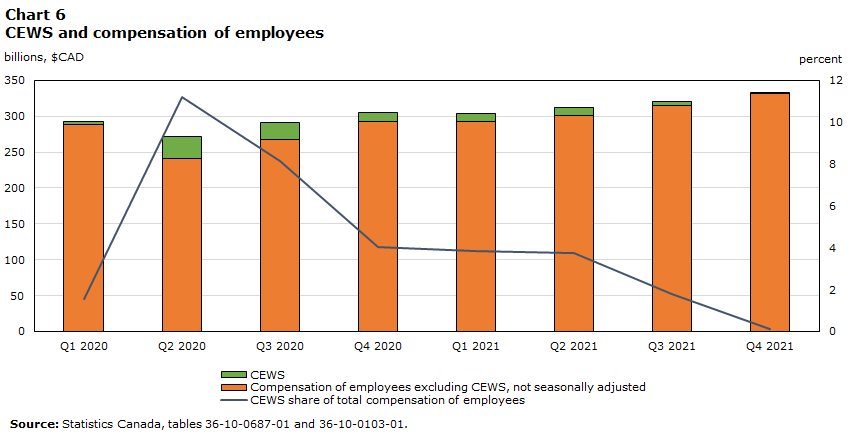
Wage subsidy programs were also beneficial to households, who are the primary recipients of wages and salaries. While there was significant direct support to households in the form of government transfers via the Canada Emergency Recovery Benefit (CERB) and other household support programs, wage subsidies also bolstered household incomes. CEWS-related wage subsidies accounted for over 11% of household compensation of employees during the second quarter of 2020. In this way, CEWS provided relief to both employers and employees. Business supports in general likely benefitted employees by ensuring that businesses were able to maintain staffing levels, continue operations even if partially, weather temporary financial difficulties, and more readily resume operations once the situation improved.
Data table for Chart 6
| CEWS share of total compensation of employees | Compensation of employees excluding CEWS, not seasonally adjusted | CEWS | |
|---|---|---|---|
| percent | billions of dollars | ||
| 2020 | |||
| Q1 | 1.6 | 288.4 | 4.5 |
| Q2 | 11.2 | 241.5 | 30.4 |
| Q3 | 8.2 | 267.8 | 23.8 |
| Q4 | 4.0 | 292.3 | 12.3 |
| 2021 | |||
| Q1 | 3.9 | 292.3 | 11.7 |
| Q2 | 3.8 | 300.5 | 11.7 |
| Q3 | 1.8 | 315.2 | 5.8 |
| Q4 | 0.1 | 332.3 | 0.4 |
| Source: Statistics Canada, tables 36-10-0687-01 and 36-10-0103-01. | |||
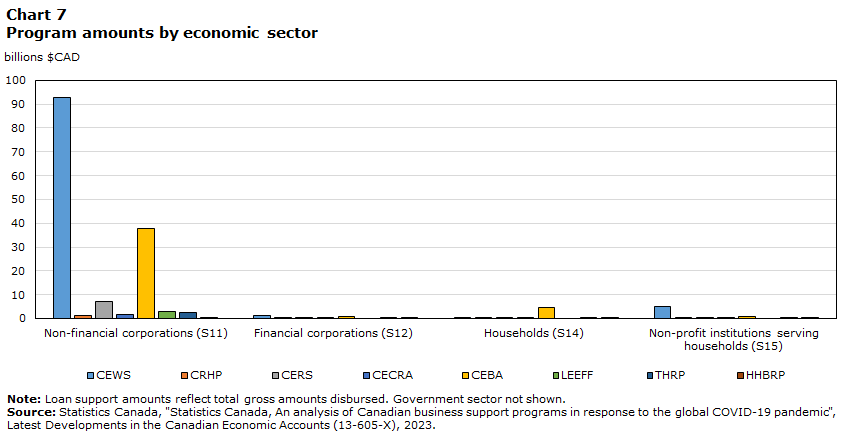
Non-financial corporations capture majority of business support dollars
Within the macroeconomic accounts, the domestic economy is divided into institutional sectors given their different roles and economic behaviour. Broadly, these sectors include households, non-profit institutions serving households (NPISH), financial and non-financial corporations, and government. During the pandemic, the greatest flow of business supports was directed to industries concentrated in the non-financial corporations sector, which accounted for 91% ($146 billion) of overall funds received. This was likely the result of a higher proportion of non-financial businesses that met the revenue decline thresholds and the sheer number of businesses that produce goods and non-financial services in Canada relative to other sectors. Within the financial corporations sector, a much smaller amount of support was received ($2.5 billion), as this sector fared better during 2020 and 2021 and did not have the same eligibility for many support programsNote .
Unincorporated businesses, which are classified to the household sector, received the second largest amount of funds ($5.5 billion)Note . Agriculture, forestry, fishing and hunting as well as construction, transportation and warehousing and other services (except public administration) were the predominant recipient industries within the household sector, together representing almost half of what households received overall. Agriculture and construction are two notable industries where there is sizeable activity undertaken by unincorporated businesses. Additionally, unincorporated businesses tend to feature a higher percentage of smaller businesses making programs such as CEBA popular whereas many unincorporated businesses may not be significant employers resulting in lower uptake of wage subsidy programs.
Data table for Chart 7
| CCIUS 2 Digits | CEWS | CRHP | CERS | CEBA | CECRA | LEEFF | THRP | HHBRP |
|---|---|---|---|---|---|---|---|---|
| billions $CAD | ||||||||
| Non-financial corporations (S11) | 92.91 | 1.26 | 7.03 | 37.66 | 1.53 | 3.10 | 2.37 | 0.56 |
| Financial corporations (S12) | 1.25 | 0.01 | 0.10 | 0.81 | 0.27 | 0.00 | 0.02 | 0.01 |
| General government (S13) | 0.35 | 0.00 | 0.00 | 0.01 | 0.02 | 0.00 | 0.01 | 0.00 |
| Households (S14) | 0.56 | 0.01 | 0.36 | 4.43 | 0.06 | 0.00 | 0.03 | 0.03 |
| Non-profit institutions serving households (S15) | 4.99 | 0.05 | 0.20 | 0.70 | 0.02 | 0.00 | 0.17 | 0.04 |
|
Note: Loan support amounts reflect total gross amounts disbursed. Government sector not shown. Source: Statistics Canada, "Statistics Canada, An analysis of Canadian business support programs in response to the global COVID-19 pandemic", Latest Developments in the Canadian Economic Accounts (13-605-X), 2023. |
||||||||
CEWS accounts for largest distribution of funds, CEBA supports greatest number of businesses
According to the various policies and eligibility requirements specific to each program (i.e., size of business, industry of activity, revenue decline recorded), a business could receive varying amounts from one or more programs. The distribution and summary statistics for each program can be found in the following table:
| Program recipients | Amount received | Amount received | Mean of amount received | Median of amount received | Standard deviation for amount received | Skewness for amount received | |
|---|---|---|---|---|---|---|---|
| count | thousands of dollars | percent | thousands of dollars | thousands of dollars | thousands of dollars | measure of symmetry | |
| Total all programs | 1,056,946 | 161,202,489.4 | 100.0 | 153.0 | 60.0 | 2,872.3 | 578 |
| Canada Emergency Wage Subsidy (CEWS) | 446,936 | 100,063,724.6 | 62.1 | 223.9 | 50.2 | 2,532.8 | 214 |
| Canada Recovery Hiring Program (CRHP) | 58,064 | 1,336,948.7 | 0.8 | 23.0 | 5.8 | 145.5 | 72 |
| Canada Emergency Commercial Rent Assistance (CECRA) | 44,376 | 2,034,216.2 | 1.3 | 45.8 | 15.3 | 297.6 | 70 |
| Canada Emergency Rent Subsidy (CERS) | 223,438 | 7,690,835.9 | 4.8 | 34.4 | 14.1 | 106.4 | 46 |
| Tourism and Hospitality Recovery Program (THRP) Rent | 29,764 | 684,521.9 | 0.4 | 23.0 | 10.5 | 58.2 | 18 |
| Tourism and Hospitality Recovery Program (THRP) Wage | 29,303 | 1,918,125.7 | 1.2 | 65.5 | 21.4 | 369.4 | 34 |
| Hardest-Hit Business Recovery Program (HHBRP) Rent | 20,480 | 160,266.7 | 0.1 | 7.8 | 3.9 | 20.3 | 19 |
| Hardest-Hit Business Recovery Program (HHBRP) Wage | 10,611 | 481,359.6 | 0.3 | 45.4 | 12.4 | 316.5 | 47 |
| Canadian Emergency Business Account (CEBA) | 892,811 | 43,729,680.0Table 2 Note † | 27.1 | 49.0 | 40.0 | 10.1 | 0.33 |
| Large Employer Emergency Financing Facility (LEEFF) | 7 | 3,102,810.0 | 1.9 | 443,258.6 | 259,470.0 | 420,165.5 | 1.7 |
Source: Statistics Canada, "Statistics Canada, An analysis of Canadian business support programs in response to the global COVID-19 pandemic", Latest Developments in the Canadian Economic Accounts (13-605-X), 2023. |
|||||||
From March 2020, when the pandemic was officially declared by the WHO, until June 2022, a total of $161 billion of financial support went to over 1 million businesses across Canada. As the largest programs, CEWS and CEBA combined account for roughly 90% of the total business support (Table 2). CEWS, being the program active for the longest duration from March 2020 to October 2021, recorded the greatest amount of funds disbursed at over $100 billion. This accounted for 62% of the total amount of funds received across the eight programs. In terms of number of recipients, the CEBA program outnumbered all the other programs with almost 900 thousand recipients; however, the smaller loan size of CEBA (i.e., targeting smaller businesses, which are more numerous), the absence of qualification criteria based on revenue decline, and the forgiveness aspect of the program whereby applicants could keep a portion of the borrowed funds, may have contributed to greater uptake among small businesses. CEWS and CHRP as well as CECRA and CERS were targeted measures that focused on providing wage and salary or rent support, while CEBA had broader coverage as an emergency loan program providing funds to cover various operating expenses including wage, salary and rent expense and other non-deferrable expenses.
Distribution of support programs amounts impacted by large values
On average, businesses participating in the LEEFF program received the highest amount of the eight support programs. By the design of the program, loans of $60 million and above were made available, based on the applicant’s cash flow needs for the subsequent 12 months. Next to LEEFF, the CEWS program had the next highest average amount disbursed.
Except CEBA and LEEFF (i.e., loan programs), all other programs (i.e., subsidies/transfers) had high positive skewness with a mean that was higher than the median value for the amount received. This implies a right skewed distribution (Image 1). With a skewness of over 200, CEWS had a much longer tail, as more extreme values influenced the entire distribution. At the same time, CEWS receipts produced the highest standard deviation as values were spread out over a wider range. In this case, the median is a more robust statistic compared to mean as it represents a better measure of the central distribution. Overall, because CEWS was open to many businesses it more closely mirrored the general variability seen in the size distribution of businesses. Additionally, the CEWS program underwent changes in eligibility and subsidy calculations that may have also contributed to this increased skewness. CEBA, designed to provide loans of either $40K or $60K to each business, possessed a symmetric bimodal distribution while LEEFF, with only a handful of participants, had a symmetric multimodal distribution.

Description for image 1
Image 1 is a histogram depicting the distribution of the COVID-19 support amounts by program at the business level. The title of each panel refers to a specific support program. Within each panel, the x-axis represents the range of the amounts a business may have received, and the y-axis displays the count of businesses within that specific value range. For example, for the CEWS program, some 6,000 businesses received around $200 thousand each. Eight charts are presented across two rows and four columns.
In the first row, from left to right, the charts illustrate the amount distribution of CEWS, CRHP, CERS and CECRA respectively. The first chart shows that more than 50 thousand businesses received roughly 0 to 14 thousand dollars from the CEWS program. Within the next value range, 14 to 28 thousand dollars, this number increased to around 90,000 businesses. As the amount received rises, the count of businesses decreases gradually. The chart limits the x-axis to a maximum of 500 thousand dollars to help make the chart visually interpretable. In reality, the maximum value is much higher resulting in a distribution with a right skewed tail, indicating that as the amount of support increases there are fewer businesses receiving that level of support. The distributions of CRHP, CERS, CECRA have a similar pattern: the number of businesses peak in the second value range and gradually decreased as the amount received increases, although each program histogram has different maximum values and skewness.
In the second row, the first two charts are the distributions of amounts for THRP and HHBRP. Their pattern is similar to the first four programs. The third and fourth chart are the distributions for CEBA and LEEFF and represent a different pattern compared to the other six programs. For CEBA, given the amount one business can receive is fixed the histogram illustrates a bimodal distribution, indicating that there are two distinct groups in the data, those businesses receiving $40,000 (around 500 thousand businesses) and those receiving $60,000 (roughly 400 thousand businesses). LEEFF has also its unique multimodal distribution given that only seven businesses participated in the program. The amounts received range from $120 million and $1.3 billion.
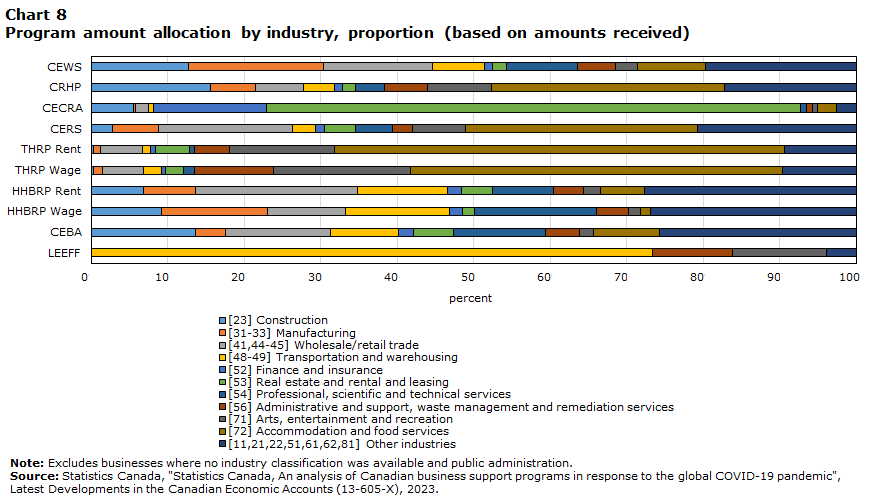
Program uptake varies significantly by industry
The distribution of amounts received by industryNote can provide a clear picture of the scale of each program by economic activity (Chart 8). Across CEWS, CRHP, CERS, CEBA and HHBRP (both wage and rent portions), the distributions are relatively even as the bulk of these programs were open to all industries. On the other hand, THRP (both wage and rent portions), as its name suggests, was designed to help impacted business in the tourism, hospitality, arts, entertainment, and recreation industries. Therefore, accommodation and food services along with arts, entertainment and recreation together account for almost 70% of the total THRP claims amount. This compares with administrative and support, waste management and remediation services, which is the third largest industry after those two listed above, accounting for 9% of THRP wage and rent claims.
The CECRA program was targeted at landlords to enable lower rent expenses for tenants. Thus, landlords can be considered the direct beneficiaries with most of the funds disbursed ending up in the real estate and rental and leasing industries. Those CECRA funds outside this industry group represent businesses in other industries that may have secondary activities involving rental of commercial real estate. Compared to other programs, LEEFF only targeted seven large businesses for which the transportation and warehousing industry dominates.
Data table for Chart 8
| Industry (NAICS) | CEWS | CRHP | CECRA | CERS | THRP Rent | THRP Wage | HHBRP Rent | HHBRP Wage | CEBA | LEEFF |
|---|---|---|---|---|---|---|---|---|---|---|
| percent | ||||||||||
| [23] Construction | 12.7 | 15.6 | 5.6 | 2.8 | 0.3 | 0.4 | 6.8 | 9.2 | 13.6 | 0.0 |
| [31-33] Manufacturing | 17.6 | 5.9 | 0.3 | 5.9 | 0.9 | 1.1 | 6.8 | 13.9 | 4.0 | 0.0 |
| [41,44-45] Wholesale/retail trade | 14.4 | 6.3 | 1.7 | 17.6 | 5.5 | 5.4 | 21.1 | 10.2 | 13.7 | 0.0 |
| [48-49] Transportation and warehousing | 6.7 | 4.1 | 0.6 | 3.0 | 1.0 | 2.3 | 11.8 | 13.5 | 8.9 | 73.4 |
| [52] Finance and insurance | 1.1 | 1.0 | 14.7 | 1.2 | 0.6 | 0.6 | 1.8 | 1.8 | 2.0 | 0.0 |
| [53] Real estate and rental and leasing | 1.8 | 1.7 | 69.8 | 4.0 | 4.4 | 2.4 | 4.1 | 1.6 | 5.2 | 0.0 |
| [54] Professional, scientific and technical services | 9.3 | 3.8 | 0.9 | 4.8 | 0.7 | 1.4 | 7.9 | 15.9 | 12.1 | 0.0 |
| [56] Administrative and support, waste management and remediation services | 5.0 | 5.7 | 0.8 | 2.7 | 4.6 | 10.4 | 3.9 | 4.2 | 4.5 | 10.5 |
| [71] Arts, entertainment and recreation | 2.8 | 8.4 | 0.6 | 6.9 | 13.8 | 17.8 | 2.3 | 1.5 | 1.7 | 12.3 |
| [72] Accommodation and food services | 8.9 | 30.4 | 2.6 | 30.4 | 58.7 | 48.7 | 5.8 | 1.4 | 8.6 | 0.0 |
| [11,21,22,51,61,62,81] Other industries | 19.7 | 17.2 | 2.5 | 20.7 | 9.4 | 9.6 | 27.6 | 26.9 | 25.7 | 3.9 |
|
Note: Excludes businesses where no industry classification was available and public administration. Source: Statistics Canada, "Statistics Canada, An analysis of Canadian business support programs in response to the global COVID-19 pandemic", Latest Developments in the Canadian Economic Accounts (13-605-X), 2023. |
||||||||||
Fewer and fewer businesses involved as program uptake count increases
Most programs were implemented at the outset of the pandemic and ended in 2020 or 2021, such as CEWS, CERS, CECRA, and CEBA, whereas CRHP, THRP and HHBRP began in mid-to-late 2021. Therefore, even though a business could apply for one or more programs, it could not necessarily be involved in multiple programs simultaneously because they may have been active over different time periods. Several more recent programs were successors of preceding support measures and thus share a certain amount of continuity. If a business applied for CEWS, for instance, then it was likely to be eligible for CRHP assuming the business’ situation remained challenging as per the eligibility criteria of the new program; both CRHP and CEWS shared similar requirements for prospective applicants. By the same token, if a business applied for CEWS or CERS, it may also have been eligible for THRP or HHBRP, so long as it met the conditions of each program.
| Program uptake count | Business count | Percentage |
|---|---|---|
| 1 | 613,191 | 58.0 |
| 2 | 277,242 | 26.2 |
| 3 | 116,977 | 11.1 |
| 4 | 36,094 | 3.4 |
| 5 | 12,637 | 1.0 |
| 6 | Less than 900 | < 0.1 |
| 7 | Less than 10 | < 0.01 |
| Total | 1,056,946 | 100 |
|
Note: Excludes the LEEFF program. Source: Statistics Canada, "Statistics Canada, An analysis of Canadian business support programs in response to the global COVID-19 pandemic", Latest Developments in the Canadian Economic Accounts (13-605-X), 2023. |
||
Over the course of more than two years, around 600,000 businesses, representing nearly 60% of all participants across the seven support measures, took part in only one program (Table 3). As the program participation count increased, the number of participating businesses declined, with less than ten businesses participating in all seven programs. There are two main explanations for this trend. First, a business which is eligible for one program may not meet the requirements for another. Hence, as the program participation count increases, the overall pool of eligible businesses declines.
Data table for Chart 9
| Group Labels | CEWS | CEBA | CERS | CECRA | LEEFF | CRHP | HHBRP Rent | HHBRP Wage | THRP Rent | THRP Wage |
|---|---|---|---|---|---|---|---|---|---|---|
| billions $CAD | ||||||||||
| Emergency Programs (CEWS, CERS, CEBA, CECRA, LEEFF) | 100.06 | 43.73 | 7.69 | 2.03 | 3.10 | Note ...: not applicable | Note ...: not applicable | Note ...: not applicable | Note ...: not applicable | Note ...: not applicable |
| Recovery Programs (CRHP, HHBRP, THRP) | Note ...: not applicable | Note ...: not applicable | Note ...: not applicable | Note ...: not applicable | Note ...: not applicable | 1.34 | 0.16 | 0.48 | 0.68 | 1.92 |
|
... not applicable Source: Statistics Canada, "Statistics Canada, An analysis of Canadian business support programs in response to the global COVID-19 pandemic", Latest Developments in the Canadian Economic Accounts (13-605-X), 2023. |
||||||||||
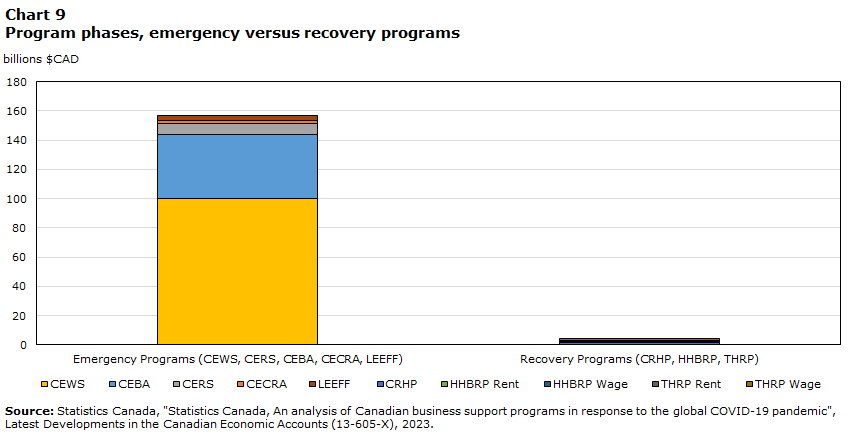
Second, recovery programs such as CRHP, THRP and HHBRP were implemented much later in the pandemic at a time when the general economic situation had improved, and the initial emergency programs had ended. Altogether, these three programs accounted for a relatively small portion of the entire support amount (Chart 9) and had considerably fewer recipients than the earlier programs. Businesses participating in five or more programs would have participated in one of these three.

Data table for Chart 10
| Industry (NAICS) | Program count | ||||||
|---|---|---|---|---|---|---|---|
| 1 | 2 | 3 | 4 | 5 | 6 | 7 | |
| percent | |||||||
| [23] Construction | 14.24 | 15.27 | 9.17 | 3.94 | 0.77 | 0.51 | 0.00 |
| [31-33] Manufacturing | 3.55 | 5.61 | 6.32 | 4.43 | 2.26 | 1.27 | 0.00 |
| [41,44-45] Wholesale/retail trade | 12.45 | 14.91 | 17.33 | 12.52 | 8.03 | 16.65 | 20.00 |
| [48-49] Transportation and warehousing | 11.26 | 5.19 | 3.36 | 1.63 | 0.77 | 0.25 | 0.00 |
| [52] Finance and insurance | 2.66 | 1.57 | 1.10 | 0.65 | 0.31 | 0.13 | 0.00 |
| [53] Real estate and rental and leasing | 8.80 | 4.67 | 2.58 | 2.00 | 1.34 | 3.05 | 0.00 |
| [54] Professional, scientific and technical services | 12.63 | 12.07 | 9.07 | 5.41 | 1.88 | 1.78 | 0.00 |
| [56] Administrative and support, waste management and remediation services | 4.53 | 4.27 | 3.92 | 4.41 | 2.27 | 2.29 | 0.00 |
| [71] Arts, entertainment and recreation | 1.22 | 1.89 | 2.87 | 5.63 | 7.41 | 9.15 | 0.00 |
| [72] Accommodation and food services | 3.84 | 6.41 | 16.15 | 36.46 | 58.72 | 32.40 | 40.00 |
| [11,21,22,51,61,62,81] Other industries | 24.82 | 28.14 | 28.12 | 22.93 | 16.22 | 32.53 | 40.00 |
|
Note: Excludes businesses where no industry classification was available and public administration. Source: Statistics Canada, "Statistics Canada, An analysis of Canadian business support programs in response to the global COVID-19 pandemic", Latest Developments in the Canadian Economic Accounts (13-605-X), 2023. |
|||||||
Businesses from the accommodation and food service industry tended to participate in more programs compared to other industries (Chart 10), while they represented about 7.3% of total recipients. This industry’s share grew as the program participation count increased to five programs.
Small businesses receive majority of support
Businesses can be classified by size based on employee count, that is, small businesses (0 to 99 employees), medium businesses (100 to 499 employees) and large businesses (over 500 employees)Note . Overall, small business recipients accounted for about 98.6% of total participants while only 0.3% were large businesses (Chart 11). However, the story is different when considering the amount of funds received, with 68% of funds going to small businesses compared with 20% to large businesses. On average, large businesses received more support per business. This is attributable to the fact that CEWS accounted for the lion’s share of support and that CEWS applicants provide the wages and counts of eligible employees on which claim amounts are based. Thus, larger businesses or those business with more employees were able to make larger CEWS claims.

Data table for Chart 11
| Size Class | Small | Medium | Large |
|---|---|---|---|
| billions of dollars (except business count) | |||
| CEWS | 54.55 | 17.06 | 28.45 |
| CRHP | 0.89 | 0.25 | 0.20 |
| CERS | 6.36 | 0.73 | 0.60 |
| CEBA | 43.66 | 0.06 | 0.01 |
| CECRA | 1.92 | 0.03 | 0.09 |
| LEEFF | 0.00 | 0.12 | 2.98 |
| THRP Rent | 0.56 | 0.07 | 0.05 |
| THRP Wage | 1.10 | 0.33 | 0.48 |
| HHBRP Rent | 0.15 | 0.01 | 0.01 |
| HHBRP Wage | 0.33 | 0.06 | 0.10 |
| number | |||
| Business count | 1,042,648 | 10,783 | 3,515 |
|
Note: Businesses with no employees are categorized as small businesses. Source: Statistics Canada, "Statistics Canada, An analysis of Canadian business support programs in response to the global COVID-19 pandemic", Latest Developments in the Canadian Economic Accounts (13-605-X), 2023. |
|||
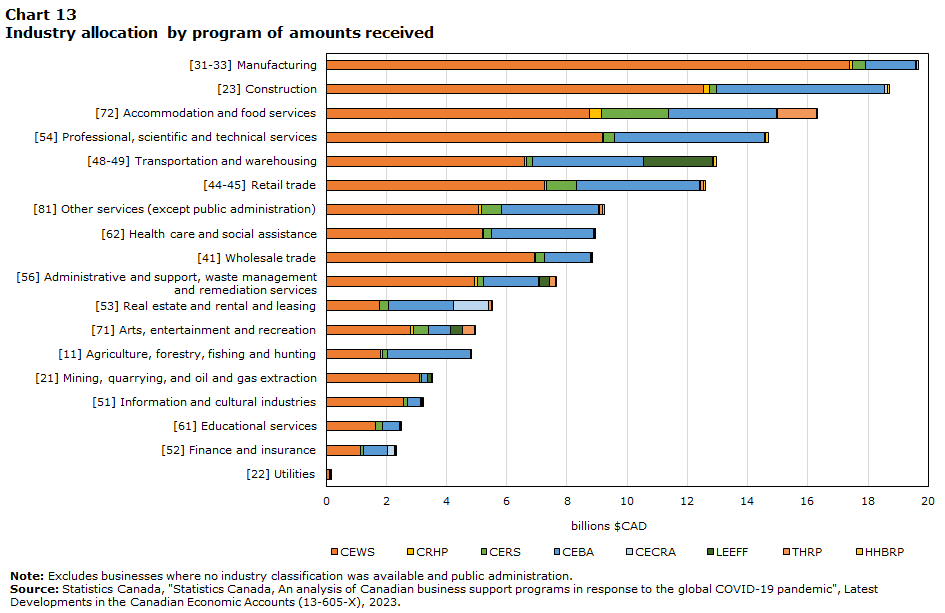
At the industry level, there is a significant positive correlation between the number of employees within an industry and the CEWS support received (Chart 12). Among applicants for CEWS, manufacturing represented the greatest share of employees compared with other industries and consequently, it received the most CEWS support (Chart 13). Beyond this, another factor contributing to the difference in amounts received is the gap between employee wages by industry. In 2020 and 2021, for example, the average hourly wage rates were $26.91 and $27.67 in the manufacturing industry, compared to $16.86 and $17.18 in accommodation and food servicesNote . This helps explain the significant discrepancy in the amount received by the two industries, even with the similar number of employees within each industry and given the maximum subsidy allowable per employee.

Data table for Chart 12
| Industry (NAICS) | Number of employees | CEWS Amount |
|---|---|---|
| thousands | billions $CAD | |
| Agriculture, forestry, fishing and hunting | 233.45 | 1.80 |
| Mining, quarrying, and oil and gas extraction | 574.83 | 3.09 |
| Utilities | 25.43 | 0.12 |
| Construction | 1,527.22 | 12.54 |
| Manufacturing | 2,765.21 | 17.39 |
| Wholesale trade | 1,460.50 | 6.93 |
| Retail trade | 1,549.74 | 7.26 |
| Transportation and warehousing | 1,189.03 | 6.60 |
| Information and cultural industries | 1,076.65 | 2.56 |
| Finance and insurance | 215.33 | 1.13 |
| Real estate and rental and leasing | 321.23 | 1.76 |
| Professional, scientific and technical services | 1,433.97 | 9.17 |
| Administrative and support, waste management and remediation services | 1,201.58 | 4.94 |
| Educational services | 175.80 | 1.64 |
| Health care and social assistance | 1,368.52 | 5.18 |
| Arts, entertainment and recreation | 657.18 | 2.80 |
| Accommodation and food services | 2,612.18 | 8.75 |
| Other services (except public administration) | 728.11 | 5.08 |
|
Notes: Excludes businesses where no industry classification was available and public administration. R2 = 0.80 The R-squared (R2) represents a measure of how much variance in CEWS receipts is explained by the number of employees within businesses applying for CEWS by industry. It ranges from 0 to 1 with a higher value representing a closer relationship between the two variables. Source: Statistics Canada, "Statistics Canada, An analysis of Canadian business support programs in response to the global COVID-19 pandemic", Latest Developments in the Canadian Economic Accounts (13-605-X), 2023. |
||
Data table for Chart 13
| Industry (NAICS) | CEWS | CRHP | CERS | CEBA | CECRA | LEEFF | THRP | HHBRP |
|---|---|---|---|---|---|---|---|---|
| billions $CAD | ||||||||
| [31-33] Manufacturing | 17.394 | 0.077 | 0.435 | 1.663 | 0.004 | Note ...: not applicable | 0.026 | 0.075 |
| [23] Construction | 12.536 | 0.206 | 0.209 | 5.601 | 0.095 | Note ...: not applicable | 0.009 | 0.053 |
| [72] Accommodation and food services | 8.748 | 0.402 | 2.239 | 3.564 | 0.043 | Note ...: not applicable | 1.302 | 0.015 |
| [54] Professional, scientific and technical services | 9.165 | 0.050 | 0.356 | 4.979 | 0.015 | Note ...: not applicable | 0.031 | 0.085 |
| [48-49] Transportation and warehousing | 6.597 | 0.054 | 0.220 | 3.664 | 0.010 | 2.276 | 0.051 | 0.080 |
| [44-45] Retail trade | 7.257 | 0.053 | 0.993 | 4.103 | 0.020 | Note ...: not applicable | 0.123 | 0.050 |
| [81] Other services (except public administration) | 5.076 | 0.075 | 0.679 | 3.221 | 0.018 | Note ...: not applicable | 0.109 | 0.053 |
| [62] Health care and social assistance | 5.182 | 0.050 | 0.250 | 3.409 | 0.015 | Note ...: not applicable | 0.023 | 0.028 |
| [41] Wholesale trade | 6.933 | 0.030 | 0.301 | 1.527 | 0.009 | Note ...: not applicable | 0.015 | 0.028 |
| [56] Administrative and support, waste management and remediation services | 4.944 | 0.075 | 0.200 | 1.846 | 0.013 | 0.327 | 0.225 | 0.025 |
| [53] Real estate and rental and leasing | 1.759 | 0.022 | 0.297 | 2.144 | 1.182 | Note ...: not applicable | 0.074 | 0.013 |
| [71] Arts, entertainment and recreation | 2.797 | 0.111 | 0.505 | 0.717 | 0.010 | 0.380 | 0.426 | 0.010 |
| [11] Agriculture, forestry, fishing and hunting | 1.804 | 0.061 | 0.172 | 2.754 | 0.002 | Note ...: not applicable | 0.002 | 0.011 |
| [21] Mining, quarrying, and oil and gas extraction | 3.090 | 0.017 | 0.061 | 0.201 | 0.000 | 0.120 | 0.000 | 0.007 |
| [51] Information and cultural industries | 2.565 | 0.011 | 0.124 | 0.452 | 0.001 | Note ...: not applicable | 0.059 | 0.039 |
| [61] Educational services | 1.635 | 0.013 | 0.235 | 0.546 | 0.006 | Note ...: not applicable | 0.050 | 0.028 |
| [52] Finance and insurance | 1.129 | 0.014 | 0.085 | 0.810 | 0.250 | Note ...: not applicable | 0.015 | 0.011 |
| [22] Utilities | 0.120 | 0.000 | 0.002 | 0.018 | 0.000 | Note ...: not applicable | 0.000 | 0.000 |
|
... not applicable Note: Excludes businesses where no industry classification was available and public administration. Source: Statistics Canada, "Statistics Canada, An analysis of Canadian business support programs in response to the global COVID-19 pandemic", Latest Developments in the Canadian Economic Accounts (13-605-X), 2023. |
||||||||
The domain of small business was CEBA, while larger businesses claim the largest share of CEWS support
Looking at the data by more granular categories of business size, most recipients of CEWS are businesses with 1 to 4 and 5 to 19 employees. The amount of CEWS support received generally increases with the greater number of employees a business has, consistent with the positive correlation mentioned previously.
For CEBA, as with CEWS, most businesses receiving loan support had 1 to 4 employees. For this particular program, the total amount received and the number of recipients are highly related. This reflects the structure of the program for which each business could only receive $40,000 or $60,000, regardless of how many employees were on payroll.

Data table for Chart 14
| CEWS | Number of businesses (left axis) | CEWS amount (right axis) |
|---|---|---|
| Size of group | business count | billions $CAD |
| <1 | 2,477 | 0.51 |
| 1-4 | 180,725 | 8.07 |
| 5-19 | 181,983 | 19.10 |
| 20-99 | 67,999 | 26.88 |
| 100-249 | 8,163 | 11.08 |
| 250+ | 5,589 | 34.43 |
| Source: Statistics Canada, "Statistics Canada, An analysis of Canadian business support programs in response to the global COVID-19 pandemic", Latest Developments in the Canadian Economic Accounts (13-605-X), 2023. | ||

Data table for Chart 15
| CEBA | Number of businesses (left axis) | CEBA amount (right axis) |
|---|---|---|
| Size of Group | business count | billions $CAD |
| <1 | 132,085 | 6.78 |
| 1-4 | 464,691 | 22.49 |
| 5-19 | 244,688 | 11.93 |
| 20-99 | 49,956 | 2.46 |
| 100-249 | 1,023 | 0.05 |
| 250+ | 368 | 0.02 |
| Source: Statistics Canada, "Statistics Canada, An analysis of Canadian business support programs in response to the global COVID-19 pandemic", Latest Developments in the Canadian Economic Accounts (13-605-X), 2023. | ||
Quintile distribution analysis: top 20% of businesses (based on total claim amount) receive majority of support
If we rank all the businesses by the total support amount they received and assign them into five groups with equal number of businesses, then across all the programs (except CEBA and LEEFF), the quintile distribution shows that the top 20% of businesses (fifth quintile) received at least 60% of the total support amounts (Chart 16). This grows to over 80% for CEWS, higher than the same quintile among other programs. With CEWS, almost 90% of large business are in the top quintile and represent nearly all (99.9%) support received in this quintile. Consistent with the previous analysis, CEWS claims are highly related with the number of employees and, therefore, most large businesses are classified within the top quintile. While there are still about 10% of large businesses in other quintiles, they accounted for only 0.1% of the total amounts received. In particular, around 2% of large businesses appear in the bottom quintile where, on average, they received disproportionally less than their counterparts in the top 20%. This may indicate that among larger businesses in the lower quintiles, some did not have as significant a revenue drop and therefore qualified for smaller subsidy amounts.
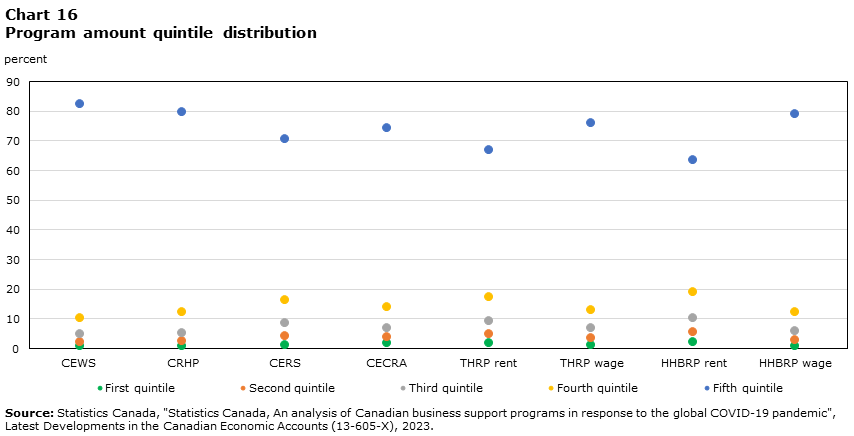
Data table for Chart 16
| Program | First quintile | Second quintile | Third quintile | Fourth quintile | Fifth quintile |
|---|---|---|---|---|---|
| percent | |||||
| CEWS | 0.67 | 2.14 | 4.60 | 10.28 | 82.32 |
| CRHP | 0.64 | 2.25 | 5.21 | 12.32 | 79.58 |
| CERS | 1.15 | 3.97 | 8.29 | 16.13 | 70.46 |
| CECRA | 1.56 | 3.73 | 6.76 | 13.70 | 74.26 |
| THRP rent | 1.86 | 4.86 | 9.26 | 17.28 | 66.74 |
| THRP wage | 1.18 | 3.41 | 6.68 | 12.75 | 75.98 |
| HHBRP rent | 2.08 | 5.41 | 10.01 | 18.99 | 63.51 |
| HHBRP wage | 0.83 | 2.71 | 5.62 | 12.06 | 78.79 |
| Source: Statistics Canada, "Statistics Canada, An analysis of Canadian business support programs in response to the global COVID-19 pandemic", Latest Developments in the Canadian Economic Accounts (13-605-X), 2023. | |||||
Next steps
Overall, business support measures during COVID-19 were both significant in size and scope, with the uptake of many programs occurring very broadly across industries and business sizes. In terms of sectors, non-financial corporations were the main recipients of support while within this sector businesses classified to the accommodation and food services industry were significant beneficiaries in terms of the number of support programs. As these programs have ended, there remains future work in terms of analyzing other business characteristics and medium-term outcomes of support program participants. This can help reveal additional insight into the effectiveness of these programs in bolstering a return to economic activity as conditions improved while highlighting the structural shifts among businesses and industries that may have occurred because of this significant event.
A preliminary version of the CCBSMLE data, on which the analysis above is based, will be made available in the future along with a guide to the methodologies and data sources used.
- Date modified: