
Latest Developments in the Canadian Economic Accounts
An overview of revisions to the Financial and Wealth Accounts, 1990 to 2021
Text begins
Overview
Statistical revisions are carried out regularly in the Canadian System of Macroeconomic Accounts (CSMA) to incorporate the most current information available. Generally, these revisions are limited to the months or quarters within a given reference year, or, on an annual basis, to the preceding two to three years.
Periodically, comprehensive revisions are conducted, which generally entail revisions beyond the scope of the standard revision window. These provide an opportunity to enhance estimation methods and incorporate improved data sources and concepts.
A number of comprehensive revisions were incorporated with the third quarter 2021 release of the Financial and Wealth Accounts (FWA), which is comprised of the National Balance Sheet Accounts (NBSA), the Financial Flow Accounts (FFA), and the Other Changes in Assets Account (OCAA). These represent an integrated set of accounts within the larger Canadian System of Macroeconomic Accounts (CSMA). This initiative was motivated by the need to further map the interlinkages between sectors of the economy, increase granularity, and better align to international guidelines. The result are estimates that will better serve the needs of domestic and international users, aid policy-makers in making informed decisions, and allow Canadians to further understand the financial footing on which they rest. The revisions were carried back to 1990 for certain instruments and sectors.
Firstly, with the third quarter 2021 release of the FWA, the presentation of the non-financial asset categories has been redesigned to better align with international requirements as well as to present more detail to users. Among other key revisions, several were the result of updated methodologies meant to expand the counterparty information available for specific instruments and sectors.
One aspect involved the development of a comprehensive methodology for estimating the value of unlisted shares within a from-whom-to-whom (FWTW) framework. An important result of this exercise was the upward revision of household net worth due to their increased holdings of unlisted shares. This was accompanied by a similar initiative to clearly delineate the holdings of the mutual fund sector by counterparty using all available sources, which resulted in revisions to the value of mutual fund shares held by households and their purchase and redemption activity.
Another important update involved further alignment of the NBSA with the Monthly Credit Aggregates (MCA) program to improve coherence. The MCA decomposes a portion of the NBSA (stocks) on a monthly basis, providing details on lending to households and non-financial corporations across a range of credit instruments. Additional sector granularity was introduced to facilitate direct comparisons between the institutional sectors covered in the NBSA and those same lender sectors found in the MCA. Moreover, estimates of chartered bank mortgage lending to households and private non-financial corporations were re-calibrated to make use of currently available information from regulatory reporting sources. Lastly, the mortgage portion of combined mortgage-HELOC loan plans, which are classified entirely to non-mortgage loans by some institutions, was reclassified as mortgage loans in the NBSA.
The third quarter also saw the introduction of a new instrument, repurchase agreements, which were previously included under other assets and liabilities, but have now been reclassified to loans. This change was joined by numerous statistical revisions arising from updates to specific concepts and methodologies as well as revised source data. Altogether, these updates further align the FWA with international guidelines for compiling national accounts such as the System of National Accounts 2008 (SNA2008).
Re-alignment and addition of detail on non-financial assets
In the past the NBSA contained a fairly detailed delineation of non-financial assets. Moreover, this classification broadly aligned with the internationally recommended taxonomy, but important differences existed, which hampered international comparability. To remedy this situation, the NBSA presentation of non-financial assets was updated to provide a more comparable structure while also adding additional detail. These added dimensions include separate estimates for land and expanded information on natural resource wealth. In many cases, previous detail has been re-labelled, but is accessible using the same vector identifiers as the concepts have not changed (see table 1 for a summary of changes).
| New structure for non-financial assets | Summary of changes |
|---|---|
| Non-financial assets | No change (same vector as before) |
| Produced non-financial assets | No change (same vector as before) |
| Fixed assets | New series aggregation |
| Dwellings | Label changed from “residential structures” (same vector as before) |
| Other buildings and structures | Label changed from “non-residential structures” (same vector as before) |
| Buildings other than dwellings | New series |
| Other structures | New series |
| Machinery and equipment | No change (same vector as before) |
| Intellectual property products | No change (same vector as before) |
| Research and development | New series |
| Mineral exploration and evaluation | New series |
| Software and databases | New series |
| Weapons systems | No change (same vector as before) |
| Consumer durables | No change (same vector as before). The System of National Accounts suggest displaying this as a memo item, but in the NBSA it is shown as part of the core classification. |
| Inventories | No change (same vector as before). Cultivated biological resources are currently included in inventories instead of fixed assets. |
| Non-produced non-financial assets | No change (same vector as before) |
| Natural resources | New series |
| Land | No change (same vector as before) |
| Land underlying dwellings | New series |
| Land underlying buildings and structures | New series |
| Agricultural Land | New series |
| Natural resources excluding land | Previous label was “Natural resources” (same vector as before) |
| Mineral and energy reserves | New series |
| Timber | New series |
| Radio spectra | New series |
| Other non-produced non-financial assets | No change (same vector as before) |
| Source: Statistics Canada, "An overview of revisions to the Financial and Wealth Accounts, 1990 to 2021", Latest Developments in the Canadian Economic Accounts (13-605-X), 2021. | |
Extension of from-whom-to-whom detail
Statistics Canada has continued its work to address informational deficits identified as part of the G20 Data Gaps InitiativesNote and adhere to the Special Data Dissemination Standard PlusNote (SDDS Plus). These efforts include developing more granular estimates that highlight the financial interdependencies between the economic sectors of the economy via the integration of a From-Whom-To-Whom (FWTW) framework within the FWA. This framework explicitly identifies the financial interconnectedness across all sectors of the economy by linking financial assets and liabilities with their corresponding counterparties (i.e., a debtor borrowing funds from a creditor represents the two sides of a contractual loan agreement).
To date, explicit counterparty information for numerous financial instruments has been developed and released as part of “Financial accounts on a from-whom-to-whom basis”. Work continues on further populating the FWTW framework including the development of sound methodologies that support the incorporation of additional instruments in the near term.
Unlisted shares
Unlisted share liabilities in the FWA represent the equity of legally incorporated or otherwise constructed entities in the Canadian economy that are not traded on public exchanges such as the Toronto Stock Exchange. In the FWA, this equity is both classified as a liability (i.e., issuers) and an asset (i.e., shareholders). The previous methodology for estimating both sides of the ledger aligned Canadian-controlled private corporations with their ultimate parent. This approach had the added benefit of providing explicit counterparty linkages, but was hampered by several weaknesses including the inability to accurately capture entities held by multiple non-controlling parties and statistical gaps in consistently identifying ultimate parent sectors for all issuers.
In response to these challenges, a new methodology was developed that more clearly and comprehensively linked share issuers and shareholders using a variety of administrative data sources, estimates from the Annual and Financial Taxation Statistics program and the Quarterly Survey of Financial Statements, and Statistics Canada’s business register. Figure 1 shows an overview of the estimation process as these sources are combined, entities are classified to issuer sectors, and a set of decision rules is implemented to identify child-parent relationships and ultimately, allocate equity to final shareholder sectors.
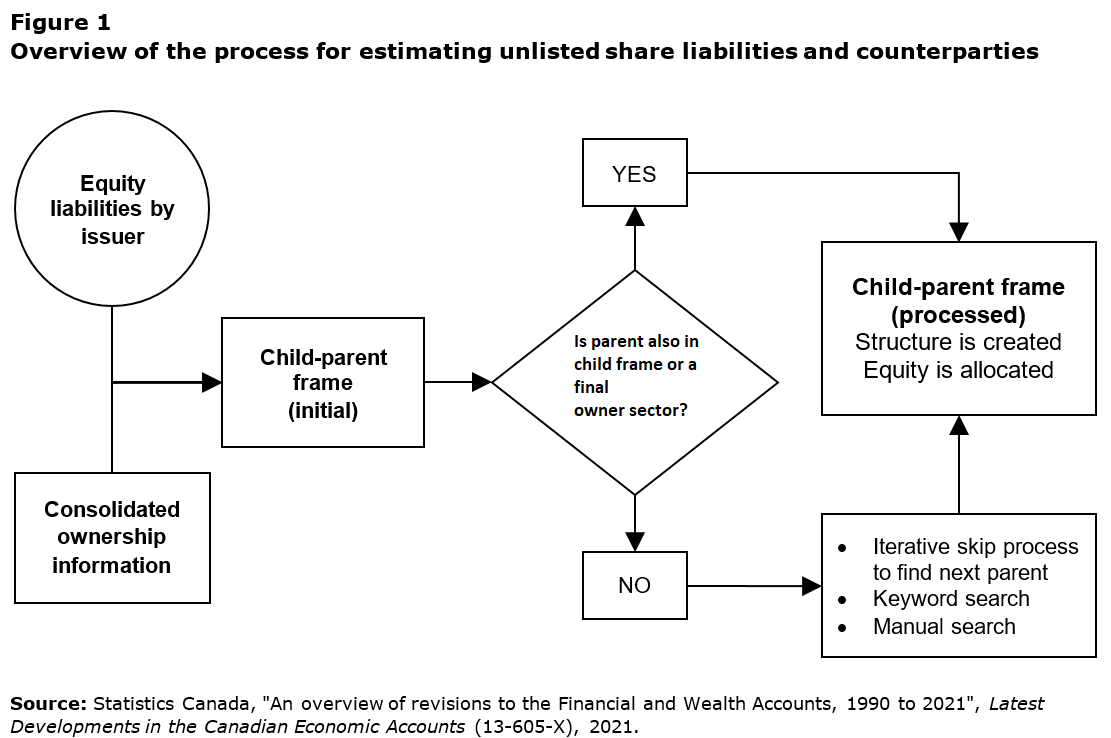
Description for Figure 1
Figure 1 shows an overview of the methodology for allocating unlisted share liabilities to shareholder sectors. The leftmost side of the diagram represents the first phase of the process in which two sets of data, equity liabilities and ownership information are combined into a child-parent frame, represented by the middle rectangle. To the right of this rectangle is a decision point. If the parent record is itself a child or can be classified as a final owner sector then the file is processed to create the ownership structure and allocate equity for that record. If one of those conditions are not met then the record is processed further to find a parent further up the ownership chain.
This methodology allocated all equity liabilities, in an exhaustive manner, to each intermediate and final holder sector where final holders represent sectors such as households, government, non-residents, and institutional investors such as Trusteed Pension Plans. One clear indication from this new methodology was that households held significantly more unlisted equity than was previously captured in the FWA. Chart 1 highlights the aggregate revisions to the market-value of household unlisted share assets.

Data table for Chart 1
| Household unlisted share assets, current | Household unlisted share assets, previous | ||
|---|---|---|---|
| billions of dollars | |||
| 1990 | Quarter 1 | 73.1 | 45.7 |
| Quarter 2 | 86.3 | 46.4 | |
| Quarter 3 | 92.5 | 49.9 | |
| Quarter 4 | 91.8 | 49.5 | |
| 1991 | Quarter 1 | 86.7 | 46.4 |
| Quarter 2 | 82.6 | 44.3 | |
| Quarter 3 | 86.1 | 46.0 | |
| Quarter 4 | 86.2 | 46.2 | |
| 1992 | Quarter 1 | 83.6 | 44.5 |
| Quarter 2 | 89.6 | 48.1 | |
| Quarter 3 | 98.6 | 53.7 | |
| Quarter 4 | 94.8 | 51.7 | |
| 1993 | Quarter 1 | 92.2 | 49.7 |
| Quarter 2 | 92.1 | 49.7 | |
| Quarter 3 | 97.1 | 52.6 | |
| Quarter 4 | 92.1 | 49.6 | |
| 1994 | Quarter 1 | 99.8 | 53.3 |
| Quarter 2 | 104.3 | 55.8 | |
| Quarter 3 | 100.2 | 53.6 | |
| Quarter 4 | 110.2 | 59.3 | |
| 1995 | Quarter 1 | 119.3 | 65.0 |
| Quarter 2 | 121.3 | 66.2 | |
| Quarter 3 | 125.9 | 69.0 | |
| Quarter 4 | 125.8 | 69.1 | |
| 1996 | Quarter 1 | 122.8 | 67.2 |
| Quarter 2 | 123.6 | 67.3 | |
| Quarter 3 | 118.5 | 64.2 | |
| Quarter 4 | 137.8 | 75.5 | |
| 1997 | Quarter 1 | 147.3 | 80.9 |
| Quarter 2 | 146.6 | 80.4 | |
| Quarter 3 | 151.2 | 83.2 | |
| Quarter 4 | 173.6 | 96.1 | |
| 1998 | Quarter 1 | 186.0 | 103.9 |
| Quarter 2 | 191.2 | 107.2 | |
| Quarter 3 | 190.7 | 107.3 | |
| Quarter 4 | 197.8 | 112.4 | |
| 1999 | Quarter 1 | 180.4 | 109.0 |
| Quarter 2 | 175.5 | 104.9 | |
| Quarter 3 | 191.7 | 114.1 | |
| Quarter 4 | 201.5 | 119.0 | |
| 2000 | Quarter 1 | 199.5 | 128.1 |
| Quarter 2 | 207.9 | 142.6 | |
| Quarter 3 | 205.3 | 142.2 | |
| Quarter 4 | 177.5 | 134.3 | |
| 2001 | Quarter 1 | 183.7 | 133.3 |
| Quarter 2 | 187.4 | 134.8 | |
| Quarter 3 | 186.9 | 126.5 | |
| Quarter 4 | 195.3 | 132.9 | |
| 2002 | Quarter 1 | 200.1 | 136.9 |
| Quarter 2 | 193.7 | 132.3 | |
| Quarter 3 | 212.1 | 139.6 | |
| Quarter 4 | 205.0 | 141.2 | |
| 2003 | Quarter 1 | 215.7 | 145.9 |
| Quarter 2 | 218.1 | 153.4 | |
| Quarter 3 | 222.9 | 160.7 | |
| Quarter 4 | 237.0 | 161.6 | |
| 2004 | Quarter 1 | 257.4 | 174.4 |
| Quarter 2 | 272.9 | 181.9 | |
| Quarter 3 | 267.6 | 184.6 | |
| Quarter 4 | 237.9 | 168.9 | |
| 2005 | Quarter 1 | 298.5 | 206.0 |
| Quarter 2 | 320.5 | 221.0 | |
| Quarter 3 | 329.2 | 233.6 | |
| Quarter 4 | 298.1 | 214.0 | |
| 2006 | Quarter 1 | 344.8 | 250.7 |
| Quarter 2 | 360.0 | 265.3 | |
| Quarter 3 | 347.3 | 256.2 | |
| Quarter 4 | 334.3 | 247.1 | |
| 2007 | Quarter 1 | 389.9 | 287.4 |
| Quarter 2 | 400.8 | 304.2 | |
| Quarter 3 | 410.2 | 320.7 | |
| Quarter 4 | 399.3 | 303.7 | |
| 2008 | Quarter 1 | 434.7 | 322.9 |
| Quarter 2 | 431.3 | 318.3 | |
| Quarter 3 | 353.5 | 245.7 | |
| Quarter 4 | 442.0 | 298.2 | |
| 2009 | Quarter 1 | 457.4 | 304.4 |
| Quarter 2 | 534.6 | 366.1 | |
| Quarter 3 | 548.7 | 390.5 | |
| Quarter 4 | 542.9 | 389.9 | |
| 2010 | Quarter 1 | 546.8 | 395.9 |
| Quarter 2 | 554.6 | 407.1 | |
| Quarter 3 | 588.0 | 431.3 | |
| Quarter 4 | 625.0 | 458.7 | |
| 2011 | Quarter 1 | 590.4 | 433.9 |
| Quarter 2 | 597.9 | 444.2 | |
| Quarter 3 | 607.2 | 458.3 | |
| Quarter 4 | 617.8 | 465.4 | |
| 2012 | Quarter 1 | 653.9 | 490.8 |
| Quarter 2 | 659.0 | 488.1 | |
| Quarter 3 | 669.9 | 505.6 | |
| Quarter 4 | 676.0 | 520.8 | |
| 2013 | Quarter 1 | 713.0 | 522.8 |
| Quarter 2 | 711.6 | 501.3 | |
| Quarter 3 | 729.3 | 527.9 | |
| Quarter 4 | 753.0 | 566.8 | |
| 2014 | Quarter 1 | 800.3 | 603.0 |
| Quarter 2 | 826.0 | 641.4 | |
| Quarter 3 | 829.5 | 640.3 | |
| Quarter 4 | 826.8 | 629.7 | |
| 2015 | Quarter 1 | 893.5 | 655.9 |
| Quarter 2 | 911.2 | 638.9 | |
| Quarter 3 | 873.1 | 572.0 | |
| Quarter 4 | 901.3 | 559.9 | |
| 2016 | Quarter 1 | 871.0 | 587.0 |
| Quarter 2 | 907.8 | 616.9 | |
| Quarter 3 | 921.1 | 641.3 | |
| Quarter 4 | 933.7 | 668.5 | |
| 2017 | Quarter 1 | 987.9 | 661.8 |
| Quarter 2 | 1,004.5 | 655.6 | |
| Quarter 3 | 1,025.0 | 675.2 | |
| Quarter 4 | 1,045.3 | 691.0 | |
| 2018 | Quarter 1 | 1,066.2 | 643.6 |
| Quarter 2 | 1,081.1 | 660.1 | |
| Quarter 3 | 1,092.7 | 655.5 | |
| Quarter 4 | 1,130.6 | 609.0 | |
| 2019 | Quarter 1 | 1,110.4 | 659.5 |
| Quarter 2 | 1,213.8 | 668.8 | |
| Quarter 3 | 1,229.1 | 674.5 | |
| Quarter 4 | 1,248.6 | 690.9 | |
| 2020 | Quarter 1 | 1,168.8 | 524.2 |
| Quarter 2 | 1,179.0 | 606.8 | |
| Quarter 3 | 1,208.3 | 636.6 | |
| Quarter 4 | 1,275.0 | 679.5 | |
| Source: Statistics Canada, "An overview of revisions to the Financial and Wealth Accounts, 1990 to 2021", Latest Developments in the Canadian Economic Accounts (13-605-X), 2021. | |||
The revisions to household as well as other issuer and holder sectors were primarily the result of the following:
- A change in the sectoral allocation of unlisted share assets, given the accurate tracing of equity holdings to final holder sectors such as households. Under the previous methodology, if information on ultimate parent was absent, the issuer sector was classified as its own shareholder.
- Statistical revisions to the total level of unlisted share liabilities (book-value) as a result of benchmarking to the latest information from the Quarterly Survey of Financial Statements
- The adjustment of any negative equity to a value of zero; the existence of negative equity liabilities is not necessarily uncommon given the inclusion of retained earnings (losses). While in business accounting a negative level of equity may be acceptable, for example among start-ups that may have greater expenses and debt relative to their revenues and assets, the notion is problematic in a from-whom- to-whom framework as a shareholder would very likely not have shares worth less than zero. While there are some exceptions to this, it is difficult to discern when to apply them.
Aggregate estimates of unlisted shares were updated using this new approach with the counter-party information to be released in the near future as part of the Financial and Wealth Accounts on a from-whom-to-whom basis: selected financial instruments. And while this methodology resulted in significant revisions, it provides a level of granularity that will enable more robust validation and new avenues for analysis. Future releases of the FWA may incorporate further revisions as this new approach is fine-tuned.
Mutual funds
The mutual fund sector is an important source of household wealth. The estimates of fund assets were reviewed and more detailed counterparty information was incorporated. This exercise included the integration of third-party data on mutual fund holdings with the securities statistics program and other data sources to improve the asset composition of the mutual fund sector.
Additionally, several benchmarks were constructed from mutual fund industry data to provide a better indication of the net purchases and reinvested income of mutual fund unit holders. This resulted in notable revisions to the net transactions of households as they recorded greater inflows into mutual funds over the period 2014 to 2019 as well as revised holdings among funds-of-funds.
Finally, the from-whom-to-whom exercise helped uncover various statistical issues that have been addressed, including improved imputation for missing funds, which do not always report each month, as well as the more comprehensive removal of duplication for some exchange-traded funds (ETFs) that appear in both the mutual fund and ETF data.

Data table for Chart 2
| Household net transactions in mutual fund shares, current | Household net transactions in mutual fund shares, previous | ||
|---|---|---|---|
| billions of dollars | |||
| 2014 | Quarter 1 | 12.4 | 2.5 |
| Quarter 2 | 11.2 | 12.9 | |
| Quarter 3 | 4.3 | -7.5 | |
| Quarter 4 | 6.9 | -11.2 | |
| 2015 | Quarter 1 | 13.4 | -2.5 |
| Quarter 2 | 9.9 | 4.2 | |
| Quarter 3 | 13.9 | -8.3 | |
| Quarter 4 | 18.1 | -8.3 | |
| 2016 | Quarter 1 | 12.2 | 14.9 |
| Quarter 2 | 10.5 | 2.9 | |
| Quarter 3 | 5.5 | -2.8 | |
| Quarter 4 | 12.9 | -1.7 | |
| 2017 | Quarter 1 | 11.4 | 16.6 |
| Quarter 2 | 6.3 | 7.6 | |
| Quarter 3 | 5.0 | 3.2 | |
| Quarter 4 | 13.8 | 5.5 | |
| 2018 | Quarter 1 | 10.9 | 3.0 |
| Quarter 2 | 4.2 | 3.2 | |
| Quarter 3 | 4.1 | 1.4 | |
| Quarter 4 | 2.2 | -10.8 | |
| 2019 | Quarter 1 | 11.0 | 12.1 |
| Quarter 2 | 4.6 | 3.2 | |
| Quarter 3 | 6.5 | 5.4 | |
| Quarter 4 | 16.1 | 4.9 | |
| 2020 | Quarter 1 | 5.1 | 0.6 |
| Quarter 2 | 14.2 | 8.5 | |
| Quarter 3 | 9.2 | 10.1 | |
| Quarter 4 | 31.4 | 25.2 | |
| Source: Statistics Canada, "An overview of revisions to the Financial and Wealth Accounts, 1990 to 2021", Latest Developments in the Canadian Economic Accounts (13-605-X), 2021. | |||
Revisions to mortgage and non-mortgage loans
Mortgage and non-mortgage loans are already available with detailed counterparty information. However, when mortgages were initially incorporated into the from-whom-to-whom framework, there was less information on the mortgage balances that households had with chartered banks. The Z4 return (Balance sheet by booking location) is a monthly regulatory banking return that is administered by the Bank of Canada and was designed in partnership with Statistics Canada to serve each organization’s needs. The return was implemented in 2020 and although it provided additional detail on aggregate chartered bank mortgage lending by debtor, it was only recently introduced at the time of the initial from-whom-to-whom implementation. However, with nearly two years of monthly Z4 data available, an exercise was undertaken to reconcile this return with other well-established returns such as the ES – Mortgage Loans Report, and the A4 – Report on new and Existing Lending. The result was a consistent estimate for chartered bank originated mortgages extended to households that represented a slightly higher share than previously estimated. Correspondingly, chartered bank mortgage lending to other sectors was revised lower.
Additionally, some banks include mortgage assets in the HELOC balances they report on various regulatory returns. Specifically, with combined mortgage-HELOC plans there is, as the name suggests, both a mortgage and HELOC component, but these combined plans are sometimes classified entirely as HELOCs. This mortgage component classified as a non-mortgage loan has been a sizeable contributor to the overall growth in HELOCs as explained by the Bank of Canada in their article “Reassessing the Growth of HELOCs in Canada Using New Regulatory Data.Note ” Thus, efforts were undertaken to identify this mortgage component of combined plans so that it could be re-classified to mortgage loans, providing a more accurate split between mortgage and non-mortgage debt.
The new estimates clearly highlight that the previous growth in HELOC balances, which were classified as consumer credit in the FWA, were being fueled by strong growth in the mortgage component of combined plans over the recent period, during which mortgage lending has grown rapidly while non-mortgage debt has remained relatively stationary.
The debt service ratioNote was also impacted by these revisions as the mortgage component of overall household credit market debt was revised higher; however, the re-classification of mortgages by itself primarily shifted obligated payments from the non-mortgage component of the DSR to the mortgage one, with these changes largely offsetting.

Data table for Chart 3
| Household mortgage liabilities, previous | Revisions due to increased household share of chartered bank residential mortgages | Revisions due to home equity line of credit reclassification | ||
|---|---|---|---|---|
| billions of dollars | ||||
| 1990 | Quarter 1 | 234.0 | 3.2 | 0.0 |
| Quarter 2 | 241.7 | 3.3 | 0.0 | |
| Quarter 3 | 246.0 | 3.4 | 0.0 | |
| Quarter 4 | 251.2 | 3.4 | 0.0 | |
| 1991 | Quarter 1 | 254.4 | 3.5 | 0.0 |
| Quarter 2 | 259.7 | 3.6 | 0.0 | |
| Quarter 3 | 266.9 | 3.7 | 0.0 | |
| Quarter 4 | 271.8 | 3.8 | 0.0 | |
| 1992 | Quarter 1 | 272.9 | 3.8 | 0.0 |
| Quarter 2 | 279.7 | 3.9 | 0.0 | |
| Quarter 3 | 284.6 | 4.0 | 0.0 | |
| Quarter 4 | 290.5 | 4.1 | 0.0 | |
| 1993 | Quarter 1 | 292.0 | 4.3 | 0.0 |
| Quarter 2 | 300.3 | 4.4 | 0.0 | |
| Quarter 3 | 303.0 | 4.6 | 0.0 | |
| Quarter 4 | 306.2 | 4.7 | 0.0 | |
| 1994 | Quarter 1 | 308.5 | 4.7 | 0.0 |
| Quarter 2 | 311.9 | 4.9 | 0.0 | |
| Quarter 3 | 317.0 | 4.9 | 0.0 | |
| Quarter 4 | 322.0 | 5.0 | 0.0 | |
| 1995 | Quarter 1 | 324.1 | 5.0 | 0.0 |
| Quarter 2 | 327.5 | 5.0 | 0.0 | |
| Quarter 3 | 333.6 | 5.1 | 0.0 | |
| Quarter 4 | 334.9 | 5.2 | 0.0 | |
| 1996 | Quarter 1 | 335.3 | 5.1 | 0.0 |
| Quarter 2 | 340.1 | 5.2 | 0.0 | |
| Quarter 3 | 344.1 | 5.3 | 0.0 | |
| Quarter 4 | 349.2 | 5.4 | 0.0 | |
| 1997 | Quarter 1 | 351.5 | 5.5 | 0.0 |
| Quarter 2 | 356.1 | 5.5 | 0.0 | |
| Quarter 3 | 360.9 | 5.7 | 0.0 | |
| Quarter 4 | 364.0 | 5.8 | 0.0 | |
| 1998 | Quarter 1 | 368.0 | 5.9 | 0.0 |
| Quarter 2 | 373.8 | 6.0 | 0.0 | |
| Quarter 3 | 380.0 | 6.1 | 0.0 | |
| Quarter 4 | 386.7 | 6.2 | 0.0 | |
| 1999 | Quarter 1 | 385.9 | 6.2 | 0.0 |
| Quarter 2 | 393.0 | 6.3 | 0.0 | |
| Quarter 3 | 396.5 | 6.3 | 0.0 | |
| Quarter 4 | 399.6 | 6.4 | 0.0 | |
| 2000 | Quarter 1 | 404.5 | 6.7 | 0.0 |
| Quarter 2 | 409.0 | 6.8 | 0.0 | |
| Quarter 3 | 413.1 | 6.9 | 0.0 | |
| Quarter 4 | 415.7 | 7.0 | 0.0 | |
| 2001 | Quarter 1 | 417.7 | 7.0 | 0.0 |
| Quarter 2 | 424.6 | 7.1 | 0.0 | |
| Quarter 3 | 432.3 | 7.3 | 0.0 | |
| Quarter 4 | 439.7 | 7.4 | 0.0 | |
| 2002 | Quarter 1 | 444.5 | 7.4 | 0.0 |
| Quarter 2 | 457.7 | 7.7 | 0.0 | |
| Quarter 3 | 465.6 | 7.8 | 0.0 | |
| Quarter 4 | 474.0 | 8.0 | 0.0 | |
| 2003 | Quarter 1 | 478.7 | 8.0 | 0.0 |
| Quarter 2 | 486.5 | 8.1 | 0.0 | |
| Quarter 3 | 500.6 | 8.4 | 0.0 | |
| Quarter 4 | 511.1 | 8.5 | 0.0 | |
| 2004 | Quarter 1 | 518.8 | 8.7 | 0.0 |
| Quarter 2 | 536.6 | 8.9 | 0.0 | |
| Quarter 3 | 552.1 | 9.2 | 0.0 | |
| Quarter 4 | 565.0 | 9.4 | 0.0 | |
| 2005 | Quarter 1 | 570.9 | 9.5 | 0.0 |
| Quarter 2 | 588.0 | 9.8 | 0.0 | |
| Quarter 3 | 606.6 | 10.0 | 0.0 | |
| Quarter 4 | 620.7 | 10.2 | 0.0 | |
| 2006 | Quarter 1 | 631.0 | 10.4 | 1.5 |
| Quarter 2 | 646.3 | 10.6 | 1.9 | |
| Quarter 3 | 663.7 | 10.8 | 2.3 | |
| Quarter 4 | 683.7 | 11.1 | 2.8 | |
| 2007 | Quarter 1 | 700.8 | 11.4 | 3.2 |
| Quarter 2 | 727.6 | 11.8 | 3.8 | |
| Quarter 3 | 754.3 | 12.2 | 4.9 | |
| Quarter 4 | 776.7 | 12.5 | 6.0 | |
| 2008 | Quarter 1 | 786.2 | 12.8 | 6.6 |
| Quarter 2 | 809.5 | 13.1 | 7.5 | |
| Quarter 3 | 831.5 | 13.4 | 9.2 | |
| Quarter 4 | 846.0 | 13.5 | 10.5 | |
| 2009 | Quarter 1 | 855.8 | 13.7 | 10.6 |
| Quarter 2 | 874.6 | 14.0 | 10.5 | |
| Quarter 3 | 895.0 | 14.2 | 11.5 | |
| Quarter 4 | 912.7 | 14.5 | 12.3 | |
| 2010 | Quarter 1 | 922.9 | 14.6 | 14.1 |
| Quarter 2 | 950.4 | 14.9 | 16.5 | |
| Quarter 3 | 965.9 | 15.1 | 18.1 | |
| Quarter 4 | 981.3 | 15.2 | 19.8 | |
| 2011 | Quarter 1 | 990.9 | 15.0 | 21.4 |
| Quarter 2 | 1,015.6 | 15.2 | 23.7 | |
| Quarter 3 | 1,037.2 | 15.4 | 25.9 | |
| Quarter 4 | 1,046.6 | 15.5 | 27.1 | |
| 2012 | Quarter 1 | 1,057.2 | 15.7 | 27.9 |
| Quarter 2 | 1,074.4 | 16.0 | 28.9 | |
| Quarter 3 | 1,091.0 | 16.2 | 29.4 | |
| Quarter 4 | 1,101.9 | 16.4 | 29.7 | |
| 2013 | Quarter 1 | 1,106.8 | 16.5 | 29.8 |
| Quarter 2 | 1,125.9 | 16.8 | 31.0 | |
| Quarter 3 | 1,143.8 | 17.2 | 31.5 | |
| Quarter 4 | 1,154.1 | 17.5 | 31.5 | |
| 2014 | Quarter 1 | 1,161.5 | 17.6 | 31.8 |
| Quarter 2 | 1,179.2 | 17.8 | 32.5 | |
| Quarter 3 | 1,200.2 | 18.1 | 33.4 | |
| Quarter 4 | 1,213.2 | 18.2 | 34.2 | |
| 2015 | Quarter 1 | 1,224.3 | 18.4 | 34.7 |
| Quarter 2 | 1,247.1 | 18.6 | 36.3 | |
| Quarter 3 | 1,273.7 | 18.9 | 38.0 | |
| Quarter 4 | 1,293.0 | 19.2 | 39.6 | |
| 2016 | Quarter 1 | 1,303.0 | 19.3 | 40.4 |
| Quarter 2 | 1,328.8 | 19.5 | 42.2 | |
| Quarter 3 | 1,354.1 | 20.0 | 43.9 | |
| Quarter 4 | 1,369.9 | 18.9 | 45.8 | |
| 2017 | Quarter 1 | 1,380.8 | 20.1 | 46.9 |
| Quarter 2 | 1,404.1 | 19.8 | 49.5 | |
| Quarter 3 | 1,423.5 | 19.7 | 52.1 | |
| Quarter 4 | 1,437.8 | 18.4 | 54.9 | |
| 2018 | Quarter 1 | 1,445.6 | 17.3 | 56.8 |
| Quarter 2 | 1,457.9 | 15.7 | 60.5 | |
| Quarter 3 | 1,473.3 | 14.4 | 63.7 | |
| Quarter 4 | 1,483.7 | 16.5 | 65.8 | |
| 2019 | Quarter 1 | 1,491.9 | 15.4 | 67.0 |
| Quarter 2 | 1,510.2 | 16.5 | 70.4 | |
| Quarter 3 | 1,532.2 | 18.1 | 73.5 | |
| Quarter 4 | 1,549.9 | 17.9 | 76.3 | |
| 2020 | Quarter 1 | 1,568.3 | 16.5 | 78.5 |
| Quarter 2 | 1,593.4 | 16.1 | 80.8 | |
| Quarter 3 | 1,626.2 | 16.2 | 84.1 | |
| Quarter 4 | 1,658.5 | 15.3 | 88.8 | |
| Source: Statistics Canada, "An overview of revisions to the Financial and Wealth Accounts, 1990 to 2021", Latest Developments in the Canadian Economic Accounts (13-605-X), 2021. | ||||
Other statistical, conceptual, and methodological revisions
The following section highlights additional revisions incorporated into the third quarter release of the FWA.
New instrument: reverse repurchase and repurchase agreements
As stated in the Bank of Canada article “Canadian Repo Market Ecology”,Note “a repurchase agreement (or repo) is essentially a collateralized loan. One party to a repo lends cash and earns interest on the cash lent. The other party borrows the cash and pays the interest. The borrower secures the loan by posting a security as collateral.” While legally a repurchase agreement may be structured as a sale of collateral to the lender and a repurchase of that collateral at a later date, the System of National Accounts 2008 guidelines (on which the FWA is broadly based) also recognizes these instruments as collateralized loans and recommends treating them as such with some conditions.
In the FWA, reverse repurchase agreements (securities recipient, cash provider; asset) and repurchase agreements (securities provider, cash recipient; liability), collectively referred to as repos, have always been captured in other assets and liabilities. However, repos are now available as a distinct instrument given the recommended treatment above and the desire to remove quantifiable amounts from other assets and liabilities. Estimates were based on and supplemented by various sources in which this instrument was separately identifiable including government finance statistics, financial statements, and administrative tax data. This initial accounting of repos contains some data gaps; future work will focus on obtaining longer time series, broader sectoral coverage, and improved current period detail.
Revisions to other sectors and instruments
Table 2 summarizes other changes that were incorporated into certain FWA time series.
| Revision | Description of change |
|---|---|
| Incorporating benchmark information on the value of Canadian real estate | The value of residential real estate (dwellings and land) incorporated the most recently available information from municipal property assessment files, which provide a comprehensive estimate for the total value of residential real estate. This data, in conjunction with estimates from the most recent Survey of Financial Security, indicated that an upward revision to land was required in order to properly estimate the value of residential real estate. These new data sources have been incorporated into the land estimate included in Canada’s national wealth. |
| Historical alignment for the sector classifications of large enterprises | Sometimes there are changes to the industry classification of an entity, such as a corporation, which is captured in the FWA aggregates. To eliminate breaks in the time series for the affected sectors entities are re-coded to provide longer and more consistent time series. This activity was undertaken for several financial enterprises as part of this revision. |
| Canadian Emergency Business Account (CEBA) funds provided to unincorporated businesses | The Canadian Emergency Business Account provided loans to businesses affected by the COVID-19 pandemic. While these funds were primarily lent to non-financial corporations a portion was also extended to unincorporated businesses, which the FWA includes within the household sector. To better reflect this split, information on CEBA recipients was sectored and aggregated. As a result, non-mortgage loans to households were revised upward from the outset of this program onwards while loans to non-financial corporations, which were initially shown as the recipients of all CEBA funds, were correspondingly revised down. |
| Additional sectoral granularity | The quasi-bank sector is composed of credit unions and trust and mortgage loan companies. To provide additional details to data users and more closely align with the sectoral detail available on the MCA, these two sub-sectors are now published as part of the FWA. |
| Source: Statistics Canada, "An overview of revisions to the Financial and Wealth Accounts, 1990 to 2021", Latest Developments in the Canadian Economic Accounts (13-605-X), 2021. | |
Future directions
Future developments planned for the FWA include the incorporation of additional counterparty information into the from-whom-to-whom framework. For example, preliminary work to develop a holder dimension for debt securities has been completed and includes information on which sectors hold debt securities issued by Canadian borrowers both domestically and abroad. Work on identifying the interlinkages for inter-corporate loans is also progressing and will leverage the experience garnered from the work on unlisted shares.
Additionally, further alignment of the current FWA sector and category classification with international standards is under review. Specific changes that will be the focus over the next year include the re-classification of derivatives to their own instrument as recommended by the SNA 2008. Currently, derivatives are classified as other assets and liabilities, but work is underway to understand and better classify what is contained in this instrument. An extension of this, is the review of how government net and gross debt are defined in the FWA so as to more closely align with guidelines on National Accounts and Government Finance Statistics. A key element of this exercise is to understand what is included as part of the other assets and liabilities of the government sector given that these instruments represent a sizeable portion of the overall balance sheet.
Also planned for future work is a review of the classification of funds within the FWA. Many private equity funds and hedge funds are currently not explicitly identified in the accounts so efforts will be focused on identifying these funds more systematically and including them in the FWA within their proper sub-sector.
Lastly, exploratory research is underway on two principal fronts; 1) the treatment of crypto assets and other alternative asset classes such as non-fungible tokens in the FWA, which will likely conclude with a technical paper containing a proposed treatment and preliminary estimates, and; 2) the review and development of additional context related to sustainable finance within the FWA to better understand the financing and investments related to the anticipated transition to a greener economy.
- Date modified: