
Latest Developments in the Canadian Economic Accounts
Canada’s services exports through the lens of digital trade

Archived Content
Information identified as archived is provided for reference, research or recordkeeping purposes. It is not subject to the Government of Canada Web Standards and has not been altered or updated since it was archived. Please "contact us" to request a format other than those available.
Correction notice
On December 15, 2020, a correction was made to Table 1 in the French version of the text for the maximum share of digitally delivered accounting services. We regret any inconvenience this may have caused.
I. Introduction
As part of Statistics Canada’s strategy to measure how digitalization is enabling, transforming and disrupting international trade in services, enterprises in CanadaNote were asked for the first time for reference year 2018 to provide the share of their exports of 15 distinct commercial services that had been delivered remotely, of which digital delivery is the primary mechanism.Note
Digital delivery is one of four primary modes of supplying services to another country, alongside in-person delivery, either through the customer or the supplier traveling to their counterpart, or by establishing a commercial presence in the other country. This paper serves as a contribution on Canada’s measurement of trade in services by mode of supply.
Provided to services exporters through a supplementary module within Statistics Canada’s International Transactions in Commercial Services Survey, this new data source for digital trade in services is the result of extensive collaboration between Statistics Canada and Canada’s export community, its US counterparts in economic statistics, such as the Bureau of Economic Analysis (BEA), and regional and international organizations—notably the OECD, WTO and Eurostat.Note
This article discusses a primary metric derived from this new survey module—the digital intensity of Canada’s 2018 international trade in commercial services exports.Note In doing so, Statistics Canada continues to make progress along the continuum of measuring digital trade services, the mode of supplying services across borders defined in the Handbook on Measuring Digital Trade, which differentiates between digital ordering, digital infrastructure (or intermediation platforms) and digital delivery. This article focuses solely on digital delivery of Canada’s services exports.
Moving along the continuum of measuring digital services
Access to external markets and trade facilitation of services delivery is paramount in maintaining the integration and innovation of the Canadian economy vis-à-vis the increasingly digital and global market. This requires ongoing innovation in measurement of digital trade in international services, which has been a chief preoccupation both at Statistics Canada and statistical agencies worldwide.
In order to address the digital trade data gap in a sustainable way that could be built upon and refined year after year, measurement of digital trade in international services (and more broadly, modes of supply) is viewed as a continuum, moving from estimation based on assumptions to direct measurement through surveying enterprises and compiling administrative data.
A primary objective of progressing along this continuum is to refine the splits between cross-border digital delivery and other modes of supply relating to in-person delivery. The path followed to-date is described below, beginning with first step of estimating Information and Communication Technology services, proceeding to the simplified allocation method, and then highlighting the advancement to services exporters providing input on their use of digital delivery as a mode of supplying their product.
Mode of Supply (MoS): The four modes of supplying services to another country
Mode 1: Cross-border supply
Cross-border supply takes place when a service is produced in one country but consumed in another one, also referred to as remote delivery. Digital delivery of services is a subset of mode 1, or put another way, remote delivery provides an upper bound estimate of digitally delivered services exports, as digital delivery tends to be the primary mechanism for remote delivery of services. Similar to traditional trade, when a good is delivered across a border, both the supplier and the consumer remain in their respective countries. For example, a law firm may deliver legal advice through the Internet to a client overseas, or an individual from one country may purchase and download a computer game from a software firm residing in another country.
Mode 2: Consumption abroad
Consumption abroad takes place when services are consumed in the country where they are produced. The consumer or his/her property are abroad when the service is supplied. For example, a tourist may visit a museum while abroad or the property of a consumer, such as a ship, may be sent abroad to be repaired.
Mode 3: Commercial presence
Commercial presence refers to when a service supplier establishes a presence abroad in order to provide services. For example, a financial institution may open a branch in another country in order to provide financial services there. Transactions in services under mode 3 are not included in Canada’s international trade in services estimates. The information on mode 3 is rather available through the Activities of Multinational Enterprises (MNEs) Abroad program. Sales of foreign-owned firms in the domestic economy (payments) and sales of domestic-owned firms in foreign economies (receipts) are used as estimates for mode 3.
Mode 4: Presence of natural persons
Presence of natural persons refers to when an individual is present abroad in order to provide a commercial service. The service is produced in the country where it is consumed. For example, an engineering consultant may travel abroad to oversee aspects of a building project or an employee of a software firm may be sent abroad to deliver information technology services.
First estimates – trade in information and communication technology (ICT) services
A first step in measuring the continuum of imports and exports of services by their modes of supply consisted of the development of data on trade in Information and Communication Technology (ICT) services. ICT services capture the value of services categories that enable or fulfill the transmission of digital information. Computer services, for example, are classified as ICT services as they serve as part of the technological infrastructure to transmit, process, store, or share digital information. Information services and telecommunications services round out ICT services. ICT services’ share of total services had increased slightly to 10.5% in 2019, compared to a previous exercise conducted for 2017, during which roughly 9.5% of services exports were deemed to be ICT services.Note
Canada’s proportion of exports of a wider definition, referred to as services facilitated or enabled by digitalization (either through ordering or delivery of the service), yielded estimates of 54% for 2019, down slightly from the 2017 estimate.Note An accounting service is not digital in nature, like the provision of cloud services, for example; however, an accounting service could be provided remotely to the client through digital delivery and is an example of a service that could be enabled by digitalization. The value of this wider set of services therefore includes all of the value of ICT services as well as other possible digital services categories, whose value was included in part or in its entirety based on a conceptual exercise. Service category transaction values were divided during this exercise into services that cannot conceptually be ordered or provided digitally, such as construction, and those that can more easily be conceptualized as ordered or delivered through digital means.

Data table for Chart 1
| ICT services | Other potentially ICT-enabled services | Not potentially ICT-enabled services | |
|---|---|---|---|
| billions of dollars | |||
| Exports | 14.576 | 59.909 | 64.849 |
| Imports | 11.077 | 63.802 | 85.966 |
| Balance | 3.499 | -3.893 | -21.117 |
| Source: Statistics Canada, Table 12-10-0141-01, 2020. | |||
Use of the simplified allocation method to estimate Canada’s trade in services by mode of supply
A next step undertaken to measure trade in services by mode of supply produced an estimate of services exports (and imports) supplied through remote delivery to other countries, of which digital delivery is the primary mechanism. This estimate was produced in conjunction with estimates of the modes by which services are delivered in-person (whether by the client crossing the border to collect the service from the supplier, or the supplier crossing the border to deliver the service to the client). This set of estimates was based on the MSITS 2010 simplified allocation method, an internationally agreed upon set of assumptions on the propensity of each service category to be remotely delivered, referred to as mode 1, or to be delivered in-person, which refers to mode 2 and mode 4.Note
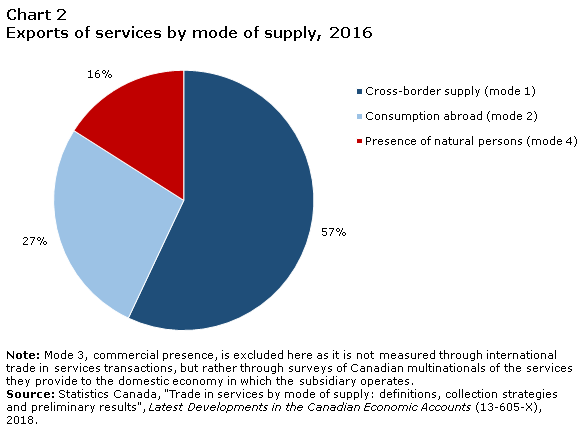
Using this method, it was estimated that in 2016, 57% of Canadian exports of services were delivered remotely to other countries, of which digital delivery is the primary mechanism, and roughly the same share of imports were digitally delivered from other countries to Canada. Services delivered in-person by the service provider crossing the border to serve the customer, referred to as mode 4 or presence of natural persons, were estimated to account for 16% of exports in Canada in 2016. The composition of this value was made up primarily by commercial services and transportation services. Services exported from Canada by the customer (outside of Canada) crossing the border to receive the product from the service provider, referred to as mode 2 or consumption abroad were estimated to account for 27% of total exports in 2016, roughly equivalent to Canada’s exports of travel services.
The assumption built into this simplified allocation exercise was that the vast majority of travel services and transport services were delivered in-person, either through consumption abroad or presence of natural persons, and that three-quarters of commercial services’ exports were digitally delivered. This allocation for commercial services exports was built up from assumptions made at the more detailed service category level, with for example, information services and telecommunication services assumed to be 100% digitally delivered, respectively, and 75% of advertising services and 50% of computer services attributed to digital delivery.
Data table for Chart 2
| Exports of services | |
|---|---|
| percent | |
| Cross-border supply (mode 1) | 57 |
| Consumption abroad (mode 2) | 27 |
| Presence of natural persons (mode 4) | 16 |
|
Note: Mode 3, commercial presence, is excluded here as it is not measured through international trade in services transactions, but rather through surveys of Canadian multinationals of the services they provide to the domestic economy in which the subsidiary operates. Source: Statistics Canada, "Trade in services by mode of supply: definitions, collection strategies and preliminary results", Latest Developments in the Canadian Economic Accounts (13-605-X), 2018. |
|

Data table for Chart 3
| Imports of services | |
|---|---|
| percent | |
| Cross-border supply (mode 1) | 58 |
| Consumption abroad (mode 2) | 31 |
| Presence of natural persons (mode 4) | 11 |
|
Note: Mode 3, commercial presence, is excluded here as it is not measured through international trade in services transactions, but rather through surveys of Canadian multinationals of the services they provide to the domestic economy in which the subsidiary operates. Source: Statistics Canada, "Trade in services by mode of supply: definitions, collection strategies and preliminary results", Latest Developments in the Canadian Economic Accounts (13-605-X), 2018. |
|
Digitally delivered exports of commercial services by service category, as reported by exporters
Progression along the continuum required capturing how Canada’s services exporters’ provided to customers their actual mix of commercial services through cross-border digital delivery and other modes of supply relating to in-person delivery. Accomplished through the addition of one question posed to exporters surveyed on an annual basis, the objective of this new survey module was to refine the above assumptions relating to the simplified allocation through direct response from the exporters themselves, starting with exporters of 15 service categories.Note As a result of integrating exporters’ survey responses on the share of their exports that are digitally delivered for 15 published service categories within commercial services within a new survey module, measurement moves to being a dynamic and direct measurement of digital trade in services. The modes of supplying services to other countries relating to travel, transport and government services remained out-of-scope.
While the simplified allocation served as a useful starting point, it is a static set of ratios that is based on a mix of enterprises that may not be immediately applicable to Canada. Left unverified by direct measurement, the simplified allocation would result in the modes of supply reflecting the growth of certain service categories, more than understanding of how delivery of exports of services is evolving. Through direct measurement, the evolution of digitalization for high-level services exports and services categories can be observed and moreover, characteristics such as the industry of exporter, their size class, their multinational enterprise status, and trading partner can be in-scope—important angles when representing exporters’ experience and performance in the global economy as well as while undertaking negotiations of trade agreements and other trade facilitation exercises.
Moreover, prior to the onset of the global COVID-19 pandemic, certain assumptions were more likely to hold. In the very different economic reality in 2020, it becomes vital to understand how exporters delivered their services to their main markets in 2018 and 2019 and how that adapted in the more constrained international travel of 2020, which had a considerable impact on mode 2 and 4.
In the simplified allocation exercise, updated with the most recent data for 2018 exports but focused solely on commercial servicesNote , it was estimated that 74% of value was provided through digital cross-border delivery, a slightly lower weight than calculated in the 2016 exercise; 3% was supplied to customers travelling to the exporting enterprise in another country to consume or collect the service (mode 2), and 23% were supplied through the exporters delivering the service directly to the customer in the other country (mode 4).Note The ratios of the simplified allocation remained the same as in the 2016 exercise, including for computer services for which 50% were assumed to be delivered digitally and the other 50% in-person.
For computer services, while the simplified allocation estimated digital delivery to be 50%, a much higher range was indicated through the survey module. Computer services exporters’ reported that they tended to digitally deliver up to 93% of computer services exports. For these particular exporters, or if the step is taken to assume these direct responses could be applied to like enterprises through grossing up, this implies a much greater resilience in the face of constraints on in-person delivery than the simplified allocation, a highly pertinent question as industrial policy, competition policy, and consumer disposable income research is developed.
The next two sections – Sections II and III – will provide details on how digital delivery was directly measured through the integration of the module into the Annual Survey of International Transactions in Commercial Services, followed by preliminary results from responding exporters. Section IV will provide a comparison of the preliminary results of the new 2018 survey module to the earlier simplified allocation exercise, and Section V will conclude the analysis.
II. Surveying digital intensity of services exporters in Canada
In order to continue moving along the continuum from estimation via the simplified allocation to direct measurement of enterprise activity in Canada, one survey question regarding services exports that were remotely delivered, of which the primary mechanism is digital delivery, was added to the existing Annual Survey of International transactions in Commercial Services. This extension to the international trade in commercial services data collection ensured direct input by enterprises on their digital intensity while leveraging an existing framework in order to strategically manage the response burden.
Enterprises in Canada that were sampled as part of the annual survey sample of International Transactions in Commercial Services were asked for the first time for reference year 2018 to provide the share of their exports of 15 distinct commercial services that had been digitally delivered. This was noteworthy as prior to the reference year 2018 questionnaire that asked enterprises directly to estimate the share of their exports that were digitally delivered, there had been no granularity regarding ‘how’ a service was delivered within the survey.
Figure 1. Exports, commercial services remotely delivered internationally, RY 2018 Statistics Canada survey

Description for Figure 1
Revenues – Percentage of commercial services delivered remotely to foreign parties, 2018
2. For each category of services reported previously in question 1, report the percentage of total revenues of commercial services delivered remotely to all foreign parties.
Services delivered remotely are services supplied across the border. The supplier does not travel to the country of the foreign party to provide the services, nor does the foreign party come to Canada to consume the services.
Select the appropriate percentage range for each service category.
If this information is not available from your records, please provide estimates to the best of your knowledge.
Include services delivered remotely via internet, email, telephone, text or other means.
Exclude:
- services delivered to a foreign party while the provider is abroad in the country of the foreign party
- services delivered to a foreign party temporarily located in Canada
Percentage ranges:
- 0% to 10%
- 11% to 24%
- 25% to 49%
- 50% to 74%
- 75% to 89%
- 90% to 100%
Service categories:
- Administrative, business and management consulting and public relations services (C3000008 )
- Accounting services (C3000009)
- Advertising and related services (C3000010)
- Legal services (C3000011)
- Computer services (C3000014)
- Research and development (C3000017)
- Architectural and engineering services (C3000018)
- Education, training, staff development (C3000019)
- Environmental services (C3000020)
- Health services (C3000021)
- Other scientific and technical services (C3000023)
- Performing arts (C3000029)
- Other audio-visual services, films and videos (C3000030)
- Other audio-visual services, other (C3000031)
- All other services not elsewhere specified (C3000032)
Sources: Statistics Canada questionnaire, BP21S International Transactions in Commercial Services, RY 2018
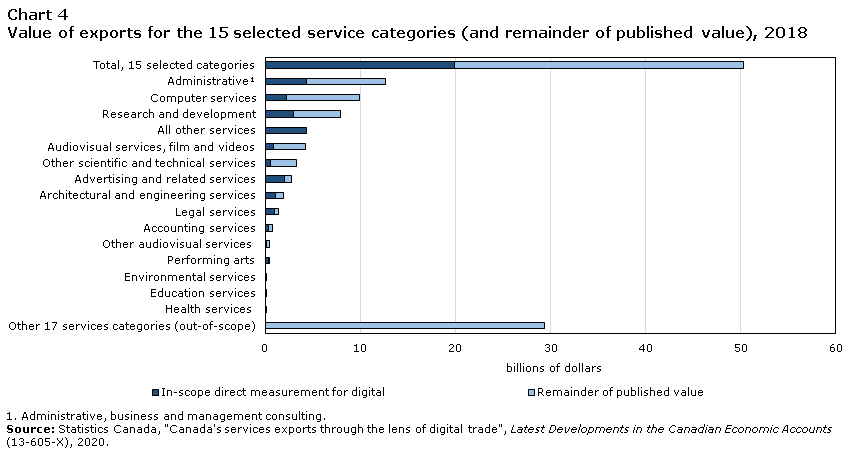
Roughly 4000 enterprises, of which slightly over 75% of exporters responded on 32 service categories, were asked to specify the share of 15 of those services categories that were delivered digitally to foreign parties. Of those respondents indicating exports of at least one of the 15 selected service categories, the response rate surpassed 80%. This yielded a universe of roughly 830 enterprises reporting that they exported services digitally, covering $20 billion worth of services exports of these 15 categories which are in scope for this analysis.
For these 15 commercial services categories, total published exports in 2018 equaled $50.3 billion. This additional $30 billion of export value is added through the grossing up of results from survey respondents to represent enterprises that were not surveyedNote as well as by augmenting the microdata collected from the survey with the integration of complementary administrative data.
Data table for Chart 4
| In-scope direct measurement for digital | Remainder of published value | |
|---|---|---|
| billions of dollars | ||
| Total, 15 selected categories | 19.93 | 30.39 |
| AdministrativeData table Note 1 | 4.32 | 8.32 |
| Computer services | 2.23 | 7.69 |
| Research and development | 2.93 | 4.95 |
| All other services | 4.32 | 0.00 |
| Audiovisual services, film and videos | 0.82 | 3.36 |
| Other scientific and technical services | 0.48 | 2.78 |
| Advertising and related services | 2.04 | 0.74 |
| Architectural and engineering services | 1.06 | 0.86 |
| Legal services | 0.91 | 0.47 |
| Accounting services | 0.35 | 0.43 |
| Other audiovisual services | 0.06 | 0.41 |
| Performing arts | 0.29 | 0.17 |
| Environmental services | 0.04 | 0.09 |
| Education services | 0.04 | 0.09 |
| Health services | 0.03 | 0.00 |
| Other 17 services categories (out-of-scope) | 0.00 | 29.40 |
|
||
The exports of the remaining 17 commercial services categories, including finance and insurance, mining support services, construction services, information services, telecommunications services, patents and trademarks, and non-financial commissions account for $29.4 billion to yield the total $79.7 billion worth of commercial services published in 2018.
Introducing digital intensity as a metric
The primary metric resulting from the additional survey module is an enterprise-based digital intensity indicator for selected categories of trade in commercial services for reference year 2018. Digital intensity refers to the share of an enterprise’s overall services exports that are delivered digitally. In terms of value, it is derived by applying the maximum of the selected share of each particular service category for each enterprise to the value reported by that enterprise for that service. So if an enterprise indicates they export $10 million worth of administrative services and reports a range of 75 to 89% for remote delivery, the interpretation is that the digital intensity is up to 89%, or up to $8.9 million of their administrative services exports being classified as digitally delivered.
Digital intensity as a characteristic of a services exporter
Digital trade in services statistics, starting with digital intensity as an indicator, drill down beyond industry of the exporter and service category of the export to secure insights on ‘how’ that service was delivered cross-border. By classifying whether a firm is more or less digitally-oriented, this work provides insights on digitalization as a characteristic of the enterprise and can therefore serve as an extension to Canada’s Trade by exporter and importer characteristics: Services statistics in years to come.
Intra-industry comparisons offer a sense of the range of digitalization present in respective industries, while digital intensity of services by industry of enterpriseNote , export destination, and whether the enterprise is part of a Canadian multinational, foreign multinational, or an enterprise that operates solely in Canada, explore the differences in digitalization across these dimensions.
The respondents to the International Transactions in Commercial Services survey serve as the sample of enterprises, many of which represent up to 10 other enterprises in the same industry and size class. Prior to being integrated into official Trade by Enterprise Characteristics statistics, digital delivery will need to be assessed as a characteristic for which a sampled enterprise can be representative of the whole population. As a step in assessing this complex issue, this paper explores only the direct measurement of digital intensity of surveyed enterprises. Following additional highlights by industry, multinational status, and trading partner, further analysis will occur comparing the shares compiled through direct measurement and those estimated in the previous simplified allocation exercise. By acknowledging the relationships between digital delivery of a service and other characteristics of these enterprises, a first step is taken in establishing an estimation strategy.
III. Preliminary Results
Surveyed services exporters report 82% overall digital delivery in 2018
Of the $20 billion worth of services exported that are in scope for this analysis, the surveyed enterprises in Canada reported that a maximum of 82% of these exports, or $16.4 billion worth, were provided to customers through remote delivery, primarily digital.
In terms of describing which other modes of supply these services are provided through, a minimum of 18% of these 15 service categories are delivered cross-border in-person, either through the service provider moving across borders to the customer to deliver the service, or the customer crossing a border to consume the service.
Administrative services, R&D, computer, advertising top list of services categories exported digitally
Upon examining the 15 pertinent services categories separately, sorted by maximum reported value of exports digitally delivered, Canada’s top services export categories are 1) administrative, business and management consulting, 2) other services,Note 3) research and development, 4) computer services, and 5) advertising and related services. Of these, enterprises exporting computer services reported the highest share of services delivered digitally. Overall, while lower in value, certain audiovisual services were reported as almost entirely (99%) digitally delivered.

Data table for Chart 5
| Share of exports | |
|---|---|
| percent | |
| Total, services exports | 82 |
| AdministrativeData table Note 1 | 83 |
| Other services not elsewhere indicated | 79 |
| Research and development | 89 |
| Computer services | 93 |
| Advertising and related services | 91 |
| Architectural and engineering services | 89 |
| Legal services | 80 |
| Other scientific and technical services | 76 |
| Performing arts | 85 |
| Accounting services | 59 |
| Audiovisual, films and videos | 24 |
| Other audiovisual, other | 99 |
| Environmental services | 96 |
| Education, training, staff development | 49 |
| Health services | 52 |
|
|
Large enterprises post highest digital intensity overall
Large enterprises overall posted a higher digital intensity at 86% compared to Small and medium-sized enterprises (SMEs), which reported an upper bound of 81% of exports that were digitally delivered in the selected service categories. Large enterprises reported higher shares in administrative services and computer services, in particular. The difference in digital intensity between SMEs, enterprises with fewer than 500 employees, and large enterprises, those with 500 or more employees, was somewhat subtle in reference to the individual services categories, not exceeding a margin of 8 percentage points, with the exception of advertising.Note SMEs’ propensity to digitally deliver advertising services was much higher than large enterprises, with a maximum reported share of 98% and 67%, showing that surveyed SMEs delivered their advertising products almost exclusively by digital means.

Data table for Chart 6
| Total, services exports | Administrative services | Research and development | Advertising | Computer | |
|---|---|---|---|---|---|
| percent | |||||
| Total, services exports | 82 | 83 | 89 | 91 | 93 |
| Large enterprises (500 or more employees) | 86 | 86 | 92 | 67 | 96 |
| Small and medium enterprises (less than 500 employees) | 81 | 79 | 83 | 98 | 90 |
| Source: Statistics Canada, "Canada's services exports through the lens of digital trade", Latest Developments in the Canadian Economic Accounts (13-605-X), 2020. | |||||
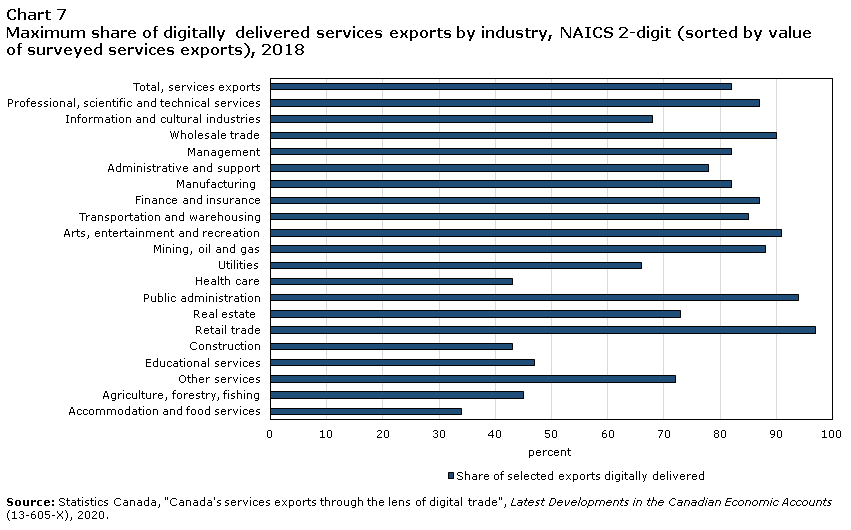
Many industries, including retail and manufacturing, show high propensity for digital delivery of services
Exporters in the professional, scientific and technical services industry report the highest value of exports (across several of the service categories noted above), and as well, show a high maximum digital intensity (86%) in the delivery of their services exports.
In comparison, enterprises in the information and cultural industries reported a maximum digital delivery of 68% of their services exports, highlighting a much higher propensity to deliver services in-person. While wholesale trade, manufacturing, and transportation and warehousing industries may have goods as their product focus, services exports can for example, facilitate these goods (e.g. legal contracts or payroll services), be embedded in these goods (e.g. software and service subscriptions through smart device), or accompany these goods (e.g. quality control for safety/leak-prevention of equipment and machinery or running diagnostics remotely).Note Services exporters in these industries reported a maximum digital delivery of 90%, 82% and 85%, respectively.
Data table for Chart 7
| NAICS | Share of selected exports digitally delivered |
|---|---|
| percent | |
| Total, services exports | 82 |
| Professional, scientific and technical services | 87 |
| Information and cultural industries | 68 |
| Wholesale trade | 90 |
| Management | 82 |
| Administrative and support | 78 |
| Manufacturing | 82 |
| Finance and insurance | 87 |
| Transportation and warehousing | 85 |
| Arts, entertainment and recreation | 91 |
| Mining, oil and gas | 88 |
| Utilities | 66 |
| Health care | 43 |
| Public administration | 94 |
| Real estate | 73 |
| Retail trade | 97 |
| Construction | 43 |
| Educational services | 47 |
| Other services | 72 |
| Agriculture, forestry, fishing | 45 |
| Accommodation and food services | 34 |
| Source: Statistics Canada, "Canada's services exports through the lens of digital trade", Latest Developments in the Canadian Economic Accounts (13-605-X), 2020. | |
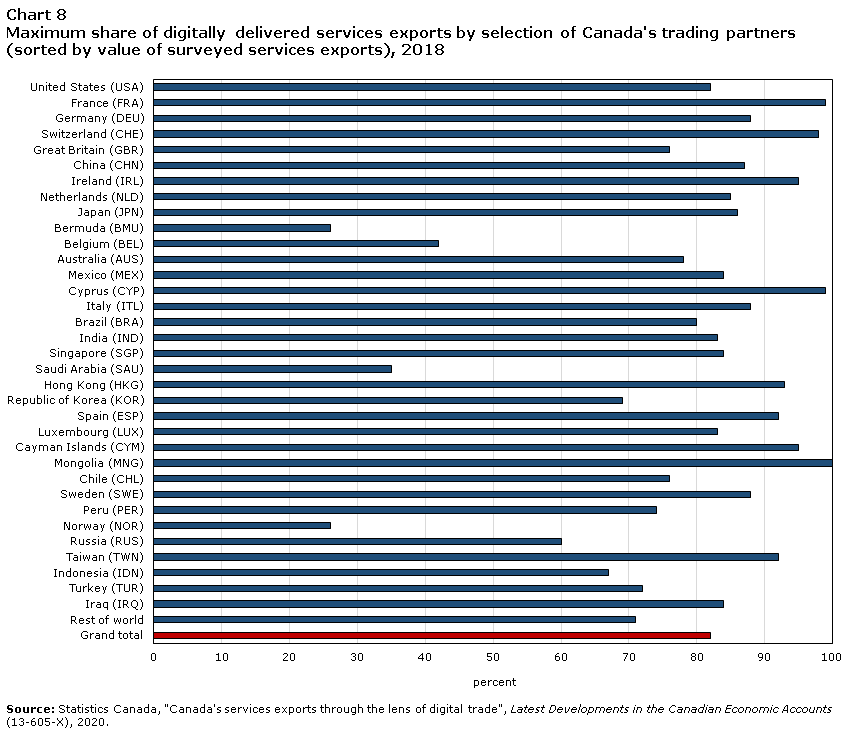
Digitally delivering services to the United States and other main trading partners
Digitally-delivered services exports’, like goods exports and services exports overall, flowed primarily to the United States, with more than 8 of every 10 exporters surveyed reporting exports to this main trading partner. More than half of the enterprises exported only to 1 trading partner, with that 1 trading partner most often being the United States. On average, exporters delivered services to 6 countries, with the top in-scope revenue generating exportersNote delivering on average, to 18 countries. Roughly 20 enterprises exported services to more than 50 countries.
Overall, up to $11.2 billion of the maximum $16.4 billion of digitally delivered services exports were generated from demand in the United States, with an additional $4 billion generated through demand from Canada’s main services trading partners, led by Germany, France, Switzerland, Great Britain, and China.
Of Canada’s in-scope exports to the United States, a maximum share of 82% of these services were digitally delivered. Exports to France, primarily computer services and architectural and engineering services from enterprises in the manufacturing and professional, scientific and technical services industry, were deemed almost exclusively digitally delivered.
In comparison, Canada’s commercial services exports to Germany and even more so to the United Kingdom, were concentrated in miscellaneous services, which may tend to gravitate more toward customization, or services relating to a good. These qualities ensure that the service itself is more challenging to classify and these categories tend toward a slightly lower propensity for digitally delivering services exports.
Data table for Chart 8
| Trading partner | Share |
|---|---|
| percent | |
| United States (USA) | 82 |
| France (FRA) | 99 |
| Germany (DEU) | 88 |
| Switzerland (CHE) | 98 |
| Great Britain (GBR) | 76 |
| China (CHN) | 87 |
| Ireland (IRL) | 95 |
| Netherlands (NLD) | 85 |
| Japan (JPN) | 86 |
| Bermuda (BMU) | 26 |
| Belgium (BEL) | 42 |
| Australia (AUS) | 78 |
| Mexico (MEX) | 84 |
| Cyprus (CYP) | 99 |
| Italy (ITL) | 88 |
| Brazil (BRA) | 80 |
| India (IND) | 83 |
| Singapore (SGP) | 84 |
| Saudi Arabia (SAU) | 35 |
| Hong Kong (HKG) | 93 |
| Republic of Korea (KOR) | 69 |
| Spain (ESP) | 92 |
| Luxembourg (LUX) | 83 |
| Cayman Islands (CYM) | 95 |
| Mongolia (MNG) | 100 |
| Chile (CHL) | 76 |
| Sweden (SWE) | 88 |
| Peru (PER) | 74 |
| Norway (NOR) | 26 |
| Russia (RUS) | 60 |
| Taiwan (TWN) | 92 |
| Indonesia (IDN) | 67 |
| Turkey (TUR) | 72 |
| Iraq (IRQ) | 84 |
| Rest of world | 71 |
| Grand total | 82 |
| Source: Statistics Canada, "Canada's services exports through the lens of digital trade", Latest Developments in the Canadian Economic Accounts (13-605-X), 2020. | |
Digital intensity of multinationals’ services exports
Canadian multinational enterprises (MNEs), across all industries, reported a higher propensity to digitally deliver their services at 88%, compared to Foreign MNEs operating in Canada at 83% and domestic operations at 68%.
Foreign MNEs’ services exports accounted for the 60% of the $20 billion value generated in the selected service categories in-scope for this analysis, while Canadian MNEs accounted for a further 25% and operations that are solely in Canada, and therefore not multinational in nature, generated the remaining 15% of value.
Foreign-owned MNEs operating in Canada’s exports’ were primarily destined for the US. Surveyed Canadian MNEs also sold most of their products to the US market.
Digitally-delivered services from exporters in the Professional, Scientific and Technical Services Industry were concentrated in computer, R&D, advertising and administrative services
In 2018, exporters in the Professional, Science and Technical Services industry (NAICS 54) delivered a total of $18 billion worth of services, roughly 18% of all commercial services exports. With half of this value directly surveyed for being digitally delivered (or conversely, in-person delivery), exporters reported a maximum of $7.8 billion as digitally delivered, yielding the 86% maximum digital intensity.
Within this industry, foreign multinational enterprises (MNEs) operating in Canada accounted for both the largest absolute value of exports (60%) relative to Canadian MNEs (24%) and other enterprises (16%), and the higher digital intensity, reporting a maximum of 88% of their services exports digitally delivered.
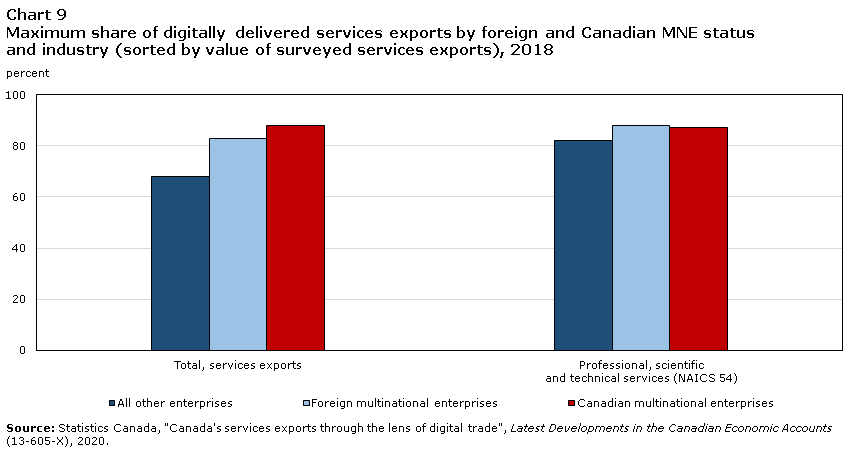
Data table for Chart 9
| All other enterprises | Foreign multinational enterprises | Canadian multinational enterprises | |
|---|---|---|---|
| percent | |||
| Total, services exports | 68 | 83 | 88 |
| Professional, scientific and technical services (NAICS 54) |
82 | 88 | 87 |
| Source: Statistics Canada, "Canada's services exports through the lens of digital trade", Latest Developments in the Canadian Economic Accounts (13-605-X), 2020. | |||
Canadian MNEs reported a higher maximum digital intensity in most other industries, notably information (NAICS 51), management of companies (NAICS 55), and administrative and support, waste management and remediation (NAICS 56). Other enterprises reported their services exports were digitally delivered at a much lower intensity than multinationals, except for the Professional, Science and Technical Services industry.
Enterprises in the Professional, Scientific and Technical Services industry exported a diversity of services to the United States and the rest of the world, in particular, computer services, R&D services, advertising and administrative services. In terms of trading partners, these enterprises’ top markets were United States, Germany, United Kingdom, Japan and Switzerland. Roughly 85% of digitally delivered exports from this industry flow to the United States, with more than half of this value delivered from US MNEs operating in Canada.
IV. Comparison with simplified assumption exercise
While the simplified allocation method applied to services exports during previous exercises to estimate digital delivery of Canada’s services exports were reasonable and an essential step, there is significant value in direct measurement. Computer services, for example, are upwards of 93% digitally delivered, as opposed to the initial estimate of 50% implicit in the simplified allocation. Commercial education services exports were reported a maximum share of 40% digitally delivery, compared to the 75% assumed to be offered digitally in the earlier exercise.Note
Architectural and engineering, legal, accounting, performing arts, and environmental sciences were also reported to be predominantly digitally delivered. Environmental services were previously assumed to be primarily delivered in-person, presumably onsite. However, technological feasibility and increased burden on the customer requiring or desiring assessment to provide soil and water samples, aerial footage, detailed maps, to provide several examples perhaps have rendered these assumptions moot, thereby underlining the importance of direct measurement.
There are also examples of the simplified allocation overestimating the propensity to deliver services digitally. While it was assumed that approximately three-quarters of accounting exports were delivered digitally in previous estimates, direct measurement indicates a lower share, a maximum percentage of 59% of value, highlighting the accountant visiting the client or vice versa is frequently the case, likely given the complexity and high value of international accounting transactions among many MNEs. The finding that the probability of accounting services were digitally delivered was overestimated in the simplified assumption was echoed in the analysis of the Bureau of Economic Analysis in the United States, which found roughly 51% of accounting exports to be digitally delivered, as was the underestimation of computer services exports being digitally delivered.Note
Similarly, audiovisual services relating to films and videos, which are a burgeoning export for Canada’s film and television production industry, was overestimated, with only 24% of these exports being delivered digitally.
| Simplified allocation (2018) | Survey-based (Statistics Canada) | Survey-based (BEA, United States) | |
|---|---|---|---|
| percent | |||
| Service category | |||
| Administrative, business and management consulting | 75 | 83 | 77 |
| Accounting services | 75 | 59 | 51 |
| Advertising and related services | 75 | 91 | 78 |
| Legal services | 75 | 80 | 80 |
| Computer services | 75 | 93 | 80 |
| Research and development | 75 | 89 | 59 |
| Architectural and engineering services | 75 | 89 | 61 |
| Education, training, staff development | 75 | 40 | 37 |
|
|||
V. Conclusion
While ICT services facilitated by digitalization and the simplified allocation method have focused on assigning service categories that are safely considered ‘digitally-oriented’ or assigning shares of a service category as digitally delivered or not, direct reporting surpasses those efforts by providing actuals for a matrix of which enterprises. By doing so, insights on which services exporters in which industries deliver how much of their cross-border business of a particular service category digitally.
Assumption-based indicators are important in taking steps toward a measurement framework for new economic phenomena; however, direct measurement provides the benchmark by which those assumptions must be confronted.
A snapshot of the composition of services’ modes of supply exported to each of Canada’s main trading partner is vital in order to observe how this composition changes and as industries increasingly modify their mix of services delivery. It becomes likely, given the challenges of labour mobility and cross-border travel of any kind during the COVID-19 pandemic, that a bias develops toward digital delivery if this adaptation is possible, which may in 2020 mean that the digital intensity shifts considerably. This snapshot is provided from direct measurement of exporters for their revenues in 2018 and will be provided in comparison with RY2019 (and RY2020 and so on) as the time series forms in order to offer insights on these compositional changes.
In addition, as services exporters discover new markets and strengthen relationships with main trading partners, the propensity of exporters to digitally deliver their services by a variety of exporter characteristics can be informative, serving as a yardstick as each industry evolves.
International collaboration on measurement of digital trade in services
The progress on measuring Digital trade in services, as well as the wider scope of measuring trade in services by their modes of supply noted above, has continued at an accelerated pace in many countries, much of it refining these early ideas of simple but effective additions to existing surveys, often coupled with administrative data and the use of mirror statistics. The United States Bureau of Economic Analysis (BEA) presented a mocked-up survey questionnaire to the Eurostat Task Force that they were testing, reporting on feedback from enterprises and seeking refinement based on other countries’ explorations as well as from the WTO and OECD. These updates were also shared with Statistics Canada who benefited greatly from the BEA documentation and collaborative approach. Statistics Canada successfully integrated an additional module into the existing e-questionnaire on trade in services as of the 2018 reference year, one survey cycle after the BEA implementation.
The United Kingdom adopted a questionnaire that is similar to BEA’s and Statistics Canada’s and has recently released statistics based on its survey. Spain has also collected data on Mode of Supply; their survey asks for the predominant mode. Outside of Europe, New Zealand has collected data on how commercial services are supplied overseas across Modes 1, 2, and 4, and the Reserve Bank of India has collected data on computer software and information technology enabled services broken down by mode of supply. Other countries within and outside of Europe have published Mode of Supply data including France, Finland, Columbia, and Brazil (whether exploratory or official statistics) while Costa Rica, India, and Thailand have worked with the United Nations Conference on Trade and Development (UNCTAD) to implement pilot studies of Information and Communications Technology (ICT)-enabled trade.
Some challenges of definition and measurement of digital trade in services
Given Canada’s high level of integration in the global economy and proximity (geographic and otherwise) to the United States, the flow of international services between Canada and the rest of the world is highly dynamic, involving transactions both arms-length and between offices in multiple countries of the same multinational.
This dynamism alongside the reduced visibility and tangibility of services in many cases means that defining digital trade in services and differentiating between domestic and international trade in services can be complex.
For the purposes of augmenting current practices with practical advancement, this article relies on two key principles which will form the foundation of the work on international digital trade in services. One, as articulated in the recent draft of the Handbook on Measuring Digital Trade, measurement will aim to differentiate between digital ordering and digital delivery, as well as digital intermediation platforms. For the purposes of this paper, measurement focused solely on digital delivery of services exports, as data sources for ordering are not readily available.
Two, only services can be digitally delivered. Goods cannot be digitally delivered. If at a point, a good (for example, a physical video game cartridge) is substituted with the same content delivered digitally (to continue the example, a video game downloaded), it will be deemed a service. Therefore, given the disruption of digitalization, the same product may exist in both the good and service universes, one being captured through customs and other administrative documentation, and the other through enterprise surveys. It will be the responsibility of statistical framework architects, in both statistical institutes and the international organizations that collaborate to create international standards and classifications, to continue to revisit whether a product is a good, a service, or the conditions on whether it is one or the other, and to orchestrate a classification and measurement system that can facilitate this evolution.
References
Statistics Canada, “Trade in services by mode of supply: definitions, collection strategies and preliminary results”, Latest Developments in the Canadian Economic Account (13-605-X), 2018.
OECD, WTO and IMF, “Handbook on Measuring Digital Trade”, version 1, 2020.
Mann, Michael A., “Measuring Trade in Services by Mode of Supply”, August 2019, Bureau of Economic Analysis.
Manual on Statistics of International Trade in Services (MSITS) 2010, UN Statistics.
Stephen Tapp, “The Growing Importance of Services in Canadian Trade”, in Redesigning Canadian Trade Policies for New Global Realities, edited by Stephen Tapp, Ari Van Assche and Robert Wolfe, August 2016.
- Date modified: