
Latest Developments in the Canadian Economic Accounts
The value of data in Canada: Experimental estimates
Introduction
In an earlier paperNote the recent advancements in the collection, digitization, storage and exploitation of information throughout the world were discussed. The use of information is widespread and can be found in workplaces, homes, governments, communication and transportation systems and elsewhere. Yet the phenomenon does not show up prominently in economic data. An expansion of the concepts and methods of national accounting was proposed in the form of an information hierarchy in which certain ‘observations’ of everyday life are digitized and become ‘data’. These ‘data’ are then structured and organized into ‘databases’ for practical use. Researchers and businesses then access these ‘databases’ and use ‘data science’ to build and test hypotheses and yield valuable new findings about the real world.
This paper extends, and to a certain extent tests, the statistical framework outlined in the previous paper and presents a preliminary set of statistical estimates of the amounts invested in Canadian data, databases and data science in recent years. The estimates are calculated from employment and wage information collected by the quinquennial Census of Population and the monthly Labour Force Survey, combined with a number of important, but as yet largely untested, assumptions. The results indicate rapid growth in investment in data, databases and data science and a significant accumulation of these kinds of capital over time.
Valuing data, databases and data science
As noted in the previous paper, data, databases and data science can be produced and either used by firms on ‘own-account’ or sold on the market. Data, databases and data science sold on the market are in theory valued at market price (the value of the transaction). Ideally, Statistics Canada would survey Canadian firms and obtain information related to their market sales of data, databases and data science. At this time, Statistics Canada has very little information on the market sales of data, databases and data science. Data, databases, and data science that are used on ‘own-account’ are valued at the cost of producing the product including an estimated return on capital. Since Statistics Canada does not have information on the market sales of data, databases and data science, the production of all data, databases and data science, whether for market sale or for own-account use, have been valued at the cost of producing the product.
Data
Data, as defined in the paper referred to earlier, are produced and therefore included and valued within the system of national accounts (SNA) production boundary. In some cases, data are bought and sold in market transactions. In these situations the value is simply the market price. In other perhaps more common cases, data are produced and used within a business, a government or a non-profit institution. In these instances, since an arm’s-length market-determined value is unavailable, the associated value must be estimated.
So if a business purchases data from another business, the value is the transaction price. For example, if Statistics Canada purchases financial information from Bloomberg Canada, the data will be valued at the price negotiated between the two parties.
Traditionally, the method used to value own-account products (created and used in-house) has been to add up the costs to produce them, ‘marked up’ by a normal return to capital. As noted, often the cost of digitizing observations on own-account (at the margin) is close to zero since it may not require labour input. For example, this is becoming more and more the case with the ‘Internet of Things’ where sensors automatically digitize observations and store them in a databaseNote .
Examples of the types of activities involved in producing data range from the labour costs associated with capturing information from paper in a machine readable form to the costs associated with operating a drone to acquire digital images for a geographic location. Further, advances in artificial intelligence and machine learning make it possible for complex natural language algorithms to be constructed which take digital unstructured information (such as a photo) and turn it into coded and highly structured information from which databases can be built and knowledge can be acquired.
For example, Statistics Canada is responsible for reporting trucking statistics to Canadians. These statistics include information related to the origin and destination of goods transported. Given the hundreds of thousands of shipments that occur each day, asking trucking firms to summarize all this information on a survey imposes an onerous burden. In order to alleviate this burden the agency has negotiated the acquisition of electronic bills of lading from a number of trucking firms. These bills of lading include a substantial amount of detail related to the product, the origin and the destination. These bills of lading are all digitally captured by the trucking firms and the data are transferred to Statistics Canada. The challenge for Statistics Canada is to take the unstructured descriptions found on each bill of lading and classify the descriptions in a standard product classification coding system used by the agency when reporting trucking statistics. In order to do this work the agency has employed a number of data scientists who develop complex algorithms to ensure the data are properly classified. The work of these data scientists would be part of the imputed ‘market value’ of the data acquired by Statistics Canada from these electronic bills of lading to aid in the development of an enhanced set of trucking statistics.
In this paper the value of data is estimated with reference to the labour costs incurred in their production plus associated non-direct labour and other costs, such as the costs of the associated human resource management and financial control, electricity, building maintenance and telecommunications services.
Occupational groups are selected from among those in the National Occupational Classification (NOC) that are generally associated with converting observations into digital format (the process of digitization). The occupational groups involved in this activity are shown in Table 1.
Employees working in these NOC categories are unlikely to spend all of their work time producing data. They may also be involved in several other kinds of activity. Information on the share of their work time applied to data production is presently unavailable, so subjective assumptions were made. In view of the uncertainty associated with these assumptions, two alternatives were considered. They are labelled ‘lower’ and ‘upper’ and can be seen in Table 1. Additional work is required in the future to collect factual information about both the specific occupational groups that engage in data production activities and the shares of their labour inputs associated with the activity.
As mentioned, two data sources are used for this study. The first, the quinquennial Census of Population, provides good quality employment and earnings statistics by occupation. This key information is used for each of the census years 2006, 2011 and 2016 and the information pertains to the years immediately prior to the censuses. The other data source is the monthly Labour Force Survey, which is more frequent and timely than the census, but less accurate because of its relatively small sample size. Data from this survey were used for the years other than 2005, 2010 and 2015.
It is assumed that non-direct salary and other costs represent 50% of the salary costs.Note Another markup of 3% is added to this margin for capital services. This is similar to the model used elsewhere in Canada’s national accounts to measure the value of own-account software and research and development investment costs.
| 'Data' share of production activities | Investment in 'data' | ||||
|---|---|---|---|---|---|
| 2005 to 2018 | 2005 | 2010 | 2015 | 2018 | |
| percent | millions of dollars | ||||
| Total of all occupational groups | |||||
| lower range value | Note ...: not applicable | 6,777 | 7,559 | 8,916 | 9,418 |
| upper range value | Note ...: not applicable | 9,742 | 10,840 | 13,448 | 14,216 |
| Financial and investment analysts | |||||
| lower range value | 10 | 475 | 456 | 1,124 | 992 |
| upper range value | 20 | 949 | 913 | 2,249 | 1,983 |
| Customer and information services supervisors | |||||
| lower range value | 30 | 578 | 342 | 307 | 307 |
| upper range value | 50 | 964 | 569 | 511 | 512 |
| Data entry clerks | |||||
| lower range value | 100 | 2,041 | 2,114 | 1,924 | 1,942 |
| upper range value | 100 | 2,041 | 2,114 | 1,924 | 1,942 |
| Other customer and information services representatives | |||||
| lower range value | 30 | 2,534 | 2,901 | 3,517 | 3,576 |
| upper range value | 50 | 4,223 | 4,835 | 5,862 | 5,959 |
| Survey interviewers and statistical clerks | |||||
| lower range value | 90 | 409 | 541 | 419 | 215 |
| upper range value | 100 | 454 | 602 | 466 | 239 |
| Mathematicians, statisticians and actuaries | |||||
| lower range value | 20 | 165 | 325 | 398 | 930 |
| upper range value | 30 | 248 | 488 | 597 | 1,395 |
| Economists and economic policy researchers and analysts | |||||
| lower range value | 20 | 238 | 374 | 555 | 790 |
| upper range value | 30 | 357 | 562 | 832 | 1,184 |
| Social policy researchers, consultants and program officers | |||||
| lower range value | 20 | 338 | 505 | 672 | 667 |
| upper range value | 30 | 507 | 757 | 1,008 | 1,000 |
| percent | |||||
| Annual growth rate | |||||
| lower range value | Note ...: not applicable | Note ...: not applicable | 2.2 | 3.4 | 1.8 |
| upper range value | Note ...: not applicable | Note ...: not applicable | 2.2 | 4.4 | 1.9 |
|
... not applicable Source: Statistics Canada, special tabulation. |
|||||
Table 1 indicates that, in 2018, there was between $9 billion and $14 billion of gross fixed capital formation outlays for data. This is a relatively small amount in relation to total Canadian gross fixed capital formation of $498 billion in that year. The annual rates of growth in this investment category are also modest (see Table 1).
As noted earlier, given the assumptions made and the fact that most observations are digitized through automated processes, it should not be surprising that even though zettabytes of information are being produced each year, this value is relatively small.
While the value of investment may be small, data are growing rapidly in economic and social importance. Adding this kind of investment to the financial statements of the economic owners of data gives the product class greater prominence. Having the associated capital assets recorded on the balance sheet is a start at recognizing what many believe to be an important missing component of wealth.
Additionally, the value of data reflects the input costs and not the potential future stream of revenue that could be captured from the data. This means that the $9 billion to $14 billion noted above is in itself a lower bound estimate since it does not take into account all future potential uses of the data. Additional research and the development of appropriate methods are required before credible estimates of the future stream of revenue from data can be determined.
Databases
Recommended methods to value databases are outlined in the System of National Accounts 2008 manual (2008 SNA). It notes that the value of a database will generally have to be estimated by a sum-of-costs approach (para.10.113). The costs include:
- cost of preparing data in the appropriate format for the database;
- time spent by staff in developing the database;
- capital services of the assets used in developing the database;
- costs of items used as intermediate consumption.
Databases purchased on the market should be valued at purchasers’ prices, while those developed in-house should be valued at their estimated basic price or at their costs of production (including a return to capital for market producers) if it is not possible to estimate the basic price. (para. A3.60)
In most cases, the challenge for national accountants is not a conceptual one but rather a ‘lack of information’ problem. The lines between software, databases and services (such as client support services) are often blurred. As a result, in many cases statistical agencies assume that database investments are captured in the estimates of gross fixed capital formation in software. Statistics Canada does this as well, although there is evidence that databases are not fully captured under the current methodology.
For the purposes of this paper, Statistics Canada has developed a methodology to estimate the value of own-account databases separately from software.
Statistics Canada’s existing methodology to estimate own-account software (including databases) investment involves identifying a number of occupational groups related to the development of software and databases and making assumptions about the amount of time these groups of employees spend developing software and databases for own final use within the enterprise. In addition to the labour input cost, Statistics Canada also includes non-labour costs associated with the development of the software such as electricity, building rental and other types of overhead.
Currently Statistics Canada combines the activities of the following occupational groups in its calculation of own-account software investment:
- 2171 Information systems analysts and consultants
- 2172 Database analysts and data administrators
- 2173 Software engineers and designers
- 2174 Computer programmers and interactive media developers
- 2175 Web designers and developers
The first step in separating investment in own-account software (including databases) from own-account databases is to distinguish which of the above occupational groups are related to own-account software and which are related to own-account databases. For the purposes of this study it is assumed that NOC 2172 relates to databases and the others relate to software development.
In addition to including NOC 2172 in database production, a review was conducted of other occupational groups to assess if some of their activities relate to the development of databases. It was decided that, for the purposes of estimating investment in databases, a portion of the labour input of the following occupational groups would also be included:
- 0213 Computer and information systems managers
- 2283 Information systems testing technicians
In calculating own-account development of software and database investment, assumptions must again be made regarding the proportion of an employee’s activity that should be capitalized. On average, individuals developing software do not devote 100% of their time to developing in-house software. A portion of their time may be dedicated to developing off-the-shelf software that is sold to other firms or consumers, for example.
As in the case of the estimates for investment in data, the estimates for investment in databases also require assumptions about shares of employee time, by occupational category, that are devoted to the activity. Lower and upper values for these assumptions are shown in Table 2 along with estimates of the value of own-account production of databases.
| 'Databases' share of production activities | Investment in 'databases' | ||||
|---|---|---|---|---|---|
| 2005 to 2018 | 2005 | 2010 | 2015 | 2018 | |
| percent | millions of dollars | ||||
| Total of all occupational groups | |||||
| lower range value | Note ...: not applicable | 3,087 | 4,143 | 5,945 | 8,046 |
| upper range value | Note ...: not applicable | 4,564 | 6,104 | 8,599 | 11,625 |
| Computer and information systems managers | |||||
| lower range value | 30 | 1,880 | 2,527 | 3,345 | 4,555 |
| upper range value | 50 | 3,133 | 4,211 | 5,574 | 7,591 |
| Database analysts and data administrators | |||||
| lower range value | 90 | 1,045 | 1,444 | 2,357 | 3,212 |
| upper range value | 100 | 1,162 | 1,604 | 2,619 | 3,569 |
| Information systems testing technicians | |||||
| lower range value | 30 | 161 | 173 | 244 | 279 |
| upper range value | 50 | 269 | 289 | 406 | 466 |
| percent | |||||
| Annual growth rate | |||||
| lower range value | Note ...: not applicable | Note ...: not applicable | 6.1 | 7.5 | 10.6 |
| upper range value | Note ...: not applicable | Note ...: not applicable | 6.0 | 7.1 | 10.6 |
|
... not applicable Source: Statistics Canada, special tabulation. |
|||||
The total value of own-account investment in databases in 2018 is estimated to be between $8 billion and $12 billion. Of this value, about $1 billion represents a reallocation from software to databases.
The estimated rates of growth in database investment (see Table 2) have been very high and rising in recent years. They were 6% per annum between 2005 and 2010, 7% per annum from 2010 to 2015 and 10.5% per annum between 2015 and 2018.
Currently, Statistics Canada does not collect information on market purchases of databases. In principle, one such database might be sold multiple times, but information about sales by this industry is unavailable. Accordingly, for the purposes of this study only own-account database production is included in the calculations of database assets.
Data science
Similar to databases, the 2008 SNA manual provides national accountants with a standard method to estimate the value of investment in research and development. When research and development results are sold on the market, the market price is used for valuation. When research and development is undertaken for own final use, a sum-of-costs approach is used. In the case of Canada, while data analytics are included in research and development in principle and the conceptual framework and methods for measuring them exist, the increasing range of businesses engaged in data analytics means there is a potential statistical under-estimation. The problem is that the current collection instruments are geared to gather information from a relatively small set of businesses that are known to be research-intensive.
Canada’s estimates of research and development activities are derived from two main sources of information. The Research and Development in Canadian Industry (RDCI) survey is used to measure the research and development activities of firms in the non-financial and financial corporate sectors. It is a cross-economy survey of approximately 8,000 firms. A number of federal and provincial government surveys are used to measure research and development activities in the government sector.
While the RDCI sample and survey strategy are appropriate for traditional forms of research and development such as pharmaceutical research and development or software engineering, they are not as well designed from either an instrument or sampling perspective to capture the growing research using big data—what has been referred to as data science. For example, retailers and banks are using insights gleaned from their massive stores of personal data to help drive sales. These kinds of insights fit the 2008 SNA manual definition of research and development. The problem, at least in the case of Canada, is that current statistical methods and tools do not fully capture this research and development investment activity.
In order to develop an order-of-magnitude estimate of the value of data science investment taking place in Canada, the same approach described above for data and databases is adopted. It is assumed that data science activity occurs in the occupational groups noted in Table 3. A share of production activities is also assumed for each of these groups and as with data and databases an assumed markup for non-direct labour and other costs is applied to the direct labour costs.
| 'Data science' share of production activities | Investment in 'data science' | ||||
|---|---|---|---|---|---|
| 2005 to 2018 | 2005 | 2010 | 2015 | 2018 | |
| percent | millions of dollars | ||||
| Total of all occupational groups | |||||
| lower range value | Note ...: not applicable | 4,829 | 6,085 | 11,168 | 11,991 |
| upper range value | Note ...: not applicable | 5,689 | 7,181 | 13,145 | 14,184 |
| Financial and investment analysts | |||||
| lower range value | 60 | 2,848 | 2,738 | 6,746 | 5,950 |
| upper range value | 70 | 3,323 | 3,194 | 7,870 | 6,942 |
| Statistical officers and related research support occupations | |||||
| lower range value | 90 | 129 | 336 | 360 | 76 |
| upper range value | 100 | 144 | 373 | 400 | 84 |
| Mathematicians, statisticians and actuaries | |||||
| lower range value | 50 | 413 | 813 | 995 | 2,324 |
| upper range value | 60 | 495 | 976 | 1,194 | 2,789 |
| Economists and economic policy researchers and analysts | |||||
| lower range value | 50 | 595 | 936 | 1,387 | 1,974 |
| upper range value | 60 | 714 | 1,123 | 1,664 | 2,369 |
| Social policy researchers, consultants and program officers | |||||
| lower range value | 50 | 844 | 1,262 | 1,681 | 1,667 |
| upper range value | 60 | 1,013 | 1,514 | 2,017 | 2,000 |
| percent | |||||
| Annual growth rate | |||||
| lower range value | Note ...: not applicable | Note ...: not applicable | 4.7 | 12.9 | 2.4 |
| upper range value | Note ...: not applicable | Note ...: not applicable | 4.8 | 12.9 | 2.6 |
|
... not applicable Source: Statistics Canada, special tabulation. |
|||||
‘Data science’ activities are estimated to imply gross fixed capital formation of between $12 billion and $14 billion in 2018. Annual rates of growth in this category of investment have also been substantial: almost 5% between 2005 and 2010, almost 13% between 2010 and 2015 and about 2.5% between 2015 and 2018.
Total investment in data-related assets
Total gross fixed capital formation in each component of the information chain for 2018 is presented in Table 4. Total investment is between $29 billion and $40 billion at current prices. The growth between 2005 and 2018 is 100%, or 5.5% on an average annual basis. These amounts cannot be added to existing estimates of gross domestic product though, since they overlap to a degree with the published estimates of total gross fixed capital formation. Further work is required to calculate the overlap and refine the estimates.
| 2005 | 2010 | 2015 | 2018 | |
|---|---|---|---|---|
| millions of dollars | ||||
| Total of all data-related categories | ||||
| lower range value | 14,693 | 17,788 | 26,029 | 29,455 |
| upper range value | 19,995 | 24,125 | 35,192 | 40,025 |
| 'Data' | ||||
| lower range value | 6,777 | 7,559 | 8,916 | 9,418 |
| upper range value | 9,742 | 10,840 | 13,448 | 14,216 |
| 'Databases' | ||||
| lower range value | 3,087 | 4,143 | 5,945 | 8,046 |
| upper range value | 4,564 | 6,104 | 8,599 | 11,625 |
| 'Data science' | ||||
| lower range value | 4,829 | 6,085 | 11,168 | 11,991 |
| upper range value | 5,689 | 7,181 | 13,145 | 14,184 |
| percent | ||||
| Annual growth rate | ||||
| lower range value | Note ...: not applicable | 3.9 | 7.9 | 4.2 |
| upper range value | Note ...: not applicable | 3.8 | 7.8 | 4.4 |
|
... not applicable Source: Statistics Canada, special tabulation. |
||||
The stock of data-related assets
This paper proposes that a significant amount of ‘information-related’ activity creates stores of value, from which firms draw in subsequent periods to produce goods and services. Given that own-account data, database and data science investments are being made by businesses, governments and non-profit institutions each day, a stock of these assets is also being accumulated. This stock needs to be included on the balance sheet of the sector that owns it, at its market value.
There are three methods that can be used to measure the stock of data, databases and data science. One method would be to treat the asset much like a natural resource and discount the future stream of income that can be generated from the information chain. The problem with this approach is that the potential benefits (and therefore income stream) are never known with any degree of certainty. Since data can have so many uses and the same data can have multiple uses the potential revenue stream is limitless. In the case of a natural resource the stock of the resource, the uses, the pattern of use, the price and the amount of time until the known stock is depleted are broadly understood. In the case of data, how long they will be used is unknown, as is the price (since it depends on the use) and the potential uses. While it is true some of this information is captured in the market capitalization of large data firms or firms with large data holdings, this is open to wide fluctuations and would be difficult to use to develop an estimate of the volume of the stock of data, databases and data science. Therefore, for the purposes of this paper this approach is not adopted since more research is required in order to develop credible estimates.
A second method is to identify the value of data, databases and data science as it is recorded on the financial statements of firms. In theory, this value should reflect the market value of the asset and embody, as much as possible, the volume of data reflected at the current potential selling price. Unfortunately, very few firms record data, databases or data science directly on their balance sheets. Given the intangible nature of the asset, it is either not recorded or combined with other types of intangible assets such as goodwill.
As a third approach, the 2008 SNA manual recommends the use of the perpetual inventory method (PIM) when developing estimates of a stock of assets. PIM accumulates investment flows over time, at constant prices; assumes a discard function and a depreciation profile; and incorporates current price levels to derive a market value estimate of the stock value of an asset.
Valuing the stock of data, databases and data science assets poses a number of interesting challenges. The first relates to the depreciation profile. These assets do not physically depreciate, so a naturally observable profile cannot be drawn upon. In some cases firms store massive amounts of information indefinitely, although the perceived utility of these assets may decline. At the same time, in other cases the value of information is fleeting and should not be capitalized if it is not used for a period extending beyond one year (the knowledge that it would rain yesterday was most useful before and during yesterday).
For pragmatic reasons it is assumed data have a useful life of 25 years, databases have the same useful life as software which is 5 years, and data-driven research and development results have a useful life of 6 years, the same assumption that is made for other forms of research and development.
The reason for the assumption of a 25-year useful life for data is based on how long it is expected that a firm will store data or a least draw upon stored data to gain insight. Since much data that are currently used are behavioural, it can be assumed such data will only retain their value for a ‘generation’. A generation is often defined as the period it takes for children to be born, grow, become adults and start to have children of their own. Of course there are many other types of data as well. The 25-year assumption should be regarded as quite tentative and more research is required on this matter.
For all three data-related asset types a net capital stock with a geometric depreciation profile was estimated.
The second challenge associated with measuring the stock of data is in establishing a ‘current market price’. In the previous sections an approach to data valuation is outlined, but that approach only applies to the initial value of data. The market value of data can change substantially from one period to another.
Suppose, building on the fourth illustrative case in the first paper, the firm SearchBook has spent years accumulating data but has simply stored the data and has not undertaken any related research and development activities. Suppose another company has constructed a software application that will automatically generate shopping lists for consumers but requires historical information on purchase patterns. The ‘app’ developer, intending to sell the app for a $5 per month subscription fee, agrees to purchase the data from SearchBook for $200 million, even though the data were only valued at $5 million on the balance sheet of SearchBook. Since a new use for the data is discovered, their value increases substantially, even though no new data were produced. This revaluation effect needs to be reflected in the market value of the asset on the balance sheet and in the other changes in assets account.
In general, when using PIM to value stocks, information regarding the price of the product (data, databases and data science results in this case) is required. These prices may do an adequate job for purposes of deflating a market value for data in cases where new uses of data are not yet discovered. The problem is that ‘new uses’ for data-related products are discovered often, are specific to each particular product and can fundamentally alter the value. As such, the sum-of-costs approach to valuation must be accompanied by adjustments to take into account situations where there are large revaluations related to data. More work is required by statisticians to obtain directly observable, albeit imperfect, market value estimates in certain cases. Ex post revaluations of this kind are not accounted for in the estimates presented in this paper.
Since it is believed that most of the data, databases and data science as outlined in this paper are internally produced and used by businesses, governments and non-profit organizations, the price of these assets will be a function of the input costs related to direct labour compensation and non-direct labour compensation and non-labour costs such as utilities, employee support services and capital services. For the purposes of this paper only the direct labour input costs were considered when estimating the price of data, databases and data science.
| 2005 | 2010 | 2015 | 2018 | |
|---|---|---|---|---|
| 2005=100 | ||||
| Total, price indexes for data-related categories | 100.0 | 109.5 | 119.1 | 126.3 |
| 'Data' | 100.0 | 112.6 | 122.0 | 130.7 |
| 'Databases' | 100.0 | 103.6 | 113.3 | 121.7 |
| 'Data science' | 100.0 | 108.4 | 116.9 | 121.2 |
| millions of dollars | ||||
| Total, net capital stock for data-related categories | ||||
| lower range value | 74,058 | 100,512 | 131,950 | 157,067 |
| upper range value | 97,855 | 136,055 | 181,098 | 217,659 |
| 'Data' | ||||
| lower range value | 53,549 | 74,181 | 92,133 | 104,824 |
| upper range value | 71,571 | 102,231 | 130,569 | 150,993 |
| 'Databases' | ||||
| lower range value | 6,926 | 9,302 | 13,015 | 18,692 |
| upper range value | 10,290 | 13,740 | 18,954 | 27,050 |
| 'Data science' | ||||
| lower range value | 13,582 | 17,029 | 26,801 | 33,551 |
| upper range value | 15,993 | 20,084 | 31,576 | 39,616 |
| percent | ||||
| Annual growth rate for total net capital stock | ||||
| lower range value | Note ...: not applicable | 6.3 | 5.6 | 6.0 |
| upper range value | Note ...: not applicable | 6.8 | 5.9 | 6.3 |
|
... not applicable Source: Statistics Canada, special tabulation. |
||||
Table 5 shows the price indexes of data, databases and data science, based on the input cost of each and an assumed 3% capital service charge. It also shows the estimated net capital stocks at the end of the four years 2005, 2010, 2015 and 2018, at current prices, and the average annual rates of growth of those capital stock estimates.
Although results are reported for only four recent years in Table 5, the method was applied annually from 1990 forward, using employment and compensation statistics by NOC category from the Labour Force Survey. The investment estimates for this lengthier period are shown in Chart 1. Price indexes are calculated by assuming investment prices change in proportion to labour compensation rates for each NOC, adjusted down by 1% per year for assumed productivity growth. As mentioned, a geometric depreciation profile is assumed with service lives of 25 years for ‘data’, 5 years for ‘databases’ and 6 years for ‘data science’. Discards are assumed to be zero.
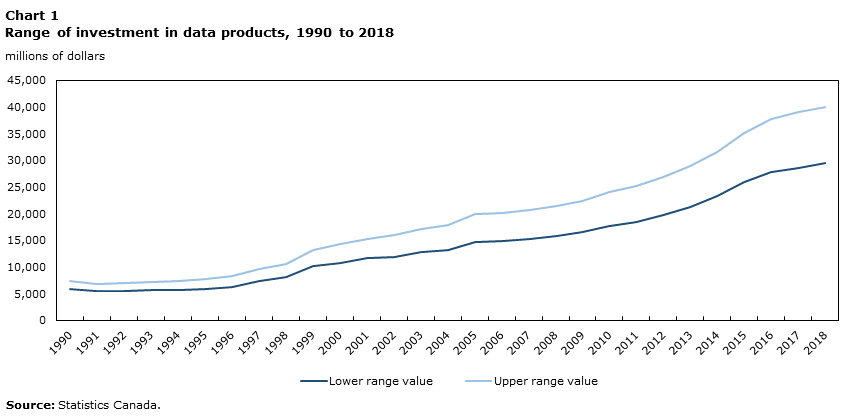
Data table for Chart 1
| Lower range value | Upper range value | |
|---|---|---|
| millions of dollars, nominal |
||
| 1990 | 5,977 | 7,333 |
| 1991 | 5,578 | 6,884 |
| 1992 | 5,559 | 6,984 |
| 1993 | 5,777 | 7,265 |
| 1994 | 5,751 | 7,393 |
| 1995 | 5,956 | 7,786 |
| 1996 | 6,322 | 8,233 |
| 1997 | 7,354 | 9,695 |
| 1998 | 8,072 | 10,550 |
| 1999 | 10,135 | 13,232 |
| 2000 | 10,838 | 14,320 |
| 2001 | 11,635 | 15,317 |
| 2002 | 11,964 | 15,998 |
| 2003 | 12,884 | 17,209 |
| 2004 | 13,255 | 17,924 |
| 2005 | 14,693 | 19,995 |
| 2006 | 14,825 | 20,176 |
| 2007 | 15,202 | 20,687 |
| 2008 | 15,749 | 21,426 |
| 2009 | 16,486 | 22,417 |
| 2010 | 17,788 | 24,125 |
| 2011 | 18,526 | 25,160 |
| 2012 | 19,733 | 26,799 |
| 2013 | 21,292 | 28,896 |
| 2014 | 23,281 | 31,555 |
| 2015 | 26,029 | 35,192 |
| 2016 | 27,802 | 37,667 |
| 2017 | 28,578 | 39,096 |
| 2018 | 29,455 | 40,025 |
| Source: Statistics Canada. | ||
The results indicate a net capital stock of between $157 billion and $217 billion as of the end of 2018. ‘Data’ account for between $105 billion and $151 billion, ‘databases’ between $19 billion and $27 billion and ‘data science’ research between $34 billion and $40 billion (see Chart 2). These are substantial numbers, though they are small in relation to total non-residential construction, machinery and equipment and intellectual property products capital which together is $2,589 billion. The net stock for intellectual property products alone is $228 billion.

Data table for Chart 2
| Lower range value | Upper range value | |
|---|---|---|
| millions of dollars | ||
| Data | 104,824 | 150,993 |
| Databases | 18,692 | 27,050 |
| Data science | 33,551 | 39,616 |
| Source: Statistics Canada. | ||
Finally, Table 6 shows the estimated 2018 investment and net capital stock statistics broken out by institutional sector. The non-financial corporations sector accounts for around half of all the investment and stock, while financial corporations account for slightly under a third of the investment and a quarter of the stock. The government sector accounts for about a fifth of the investment and the stock, while the non-profit institutions serving households sector accounts for about 1.5%.
| Total | Non-financial corporations | Financial corporations | Government | Non-profit institutions serving households | |||||
|---|---|---|---|---|---|---|---|---|---|
| millions of dollars | millions of dollars | percent of total | millions of dollars | percent of total | millions of dollars | percent of total | millions of dollars | percent of total | |
| Investment | |||||||||
| lower range value | 29,455 | 13,676 | 46.4 | 9,327 | 31.7 | 6,027 | 20.5 | 425 | 1.4 |
| upper range value | 40,025 | 19,403 | 48.5 | 12,224 | 30.5 | 7,842 | 19.6 | 556 | 1.4 |
| Capital stock | |||||||||
| lower range value | 157,067 | 80,875 | 51.5 | 38,835 | 24.7 | 34,834 | 22.2 | 2,524 | 1.6 |
| upper range value | 217,659 | 114,562 | 52.6 | 54,097 | 24.9 | 45,646 | 21.0 | 3,354 | 1.5 |
| Source: Statistics Canada, special tabulation. | |||||||||
Conclusions
Data science and its antecedents, data and databases, are becoming more and more central in the modern world. So much of what we do nowadays is digitally chronicled as data, loaded into databases and exploited analytically for a wide variety of purposes. During the day our purchases, travel, reading, listening and media viewing activities, physical activities, likes and dislikes and so much more are stored for use toward various ends. Even our physical states while sleeping are increasingly being recorded.Note
This state of affairs has come upon us quite rapidly when viewed against the wide sweep of history. While desktop computers appeared in stores in the 1970s, it was only in the mid-1990s that the Internet began to become widely available. In 2002 the BlackBerry smartphone was first marketed by Research in Motion, a company founded in Waterloo, Ontario. It made mobile telephone, email, web browsing and other services readily accessible on a pocket-size wireless device. Five years later the first iPhone was announced by Steve Jobs, Chief Executive Officer of Apple Incorporated. It provided functionality similar to the Blackberry device, but with a touch screen user interface that rapidly became very popular. The next few years saw dramatic improvements in the iPhone technology along with the appearance of numerous competing Android devices and big upgrades to the supporting telecommunication networks. These technological developments and others, and their wholehearted adoption by Canadians, have facilitated the collection of vast amounts of data.
These changes have been swift and the statistical system has some catching up to do. Indeed, all the national statistical organizations around the world are presently facing this challenge. This paper and the one that preceded it, released in The Daily on June 24, 2019, are intended as a first step in that direction. They entail a number of assumptions that need to be tested, so the numerical estimates are tentative and presented as ranges rather than point valuations. Nevertheless the estimates indicate significant and growing investment expenditures and capital stocks in data, databases and data science. More work is both warranted and necessary.
- Date modified: