
Latest Developments in the Canadian Economic Accounts
Measuring investment in data, databases and data science: Conceptual framework

Archived Content
Information identified as archived is provided for reference, research or recordkeeping purposes. It is not subject to the Government of Canada Web Standards and has not been altered or updated since it was archived. Please "contact us" to request a format other than those available.
Introduction
All over the world the use of data has increased exponentially largely due to the ease with which information is captured, converted to digital format, stored and analyzed for the extraction of knowledge. In the 1930s and 1940s, the first computers were rudimentary, slow, expensive and cumbersome with little memory or storage capacity. Today, after many decades of innovation, they are fast, cheap and miniaturized with enormous memory and storage capabilities and capable of executing complex algorithms. These developments have both enabled and encouraged a rapid growth in the collection, digital storage and usage of a wide variety of types of data.
Yet despite these indisputable trends, data still only have a small explicit role to play and little visibility in the modern national accounting framework.Note This is because data usage, to a large extent (though certainly not always), is unpriced in the modern economy while the economic indicators released by statistical agencies are mostly about market-determined values. Some data are produced by businesses and governments for their own use but not sold in the marketplace, for example by internal corporate accounting departments. Other data are supplied by households to businesses and governments as payment-in-kind in exchange for other services, as for example in the case of Facebook, Google and many other online services. In these and other situations data flows are a crucial part of the economic landscape, but they are not readily apparent in the economic indicators.
This paper aims to address this situation by expanding current national accounting concepts and statistical methods for measuring data in order to shed light on these highly consequential changes in society that are related to the rising usage of data.Note This paper begins with examples of some of the new ways data are being used by businesses and households in order to contextualize the discussion. It then addresses the questions: What are ‘data’? Where do data come from? Are they are produced and if so, how? These questions are elaborated using the concept of an information chain which is central to the paper. Next, a possible classification system/typology for data is put forward. Then, the paper discusses the topic of ownership. The paper concludes by discussing possible methods that can be used to assign an economic value to the various elements in the information chain.
The role of data in a modern economy
To begin a discussion around measuring the economic value of data it is helpful to explore several examples that illustrate the different economic uses of data. These examples will be used and referenced throughout the rest of the paper to further motivate the discussion and elaborate the arguments.
Case 1: The case of a small business
Consider the case of a small business. It might be a restaurant, a hardware store, a hair salon or a flower shop. The owner, Martha Jones, is also the manager and she keeps financial and human resource records using standard off-the-shelf small business software.
Every business day, sales and expenses are recorded in the business database. Where possible, information about the clients is also stored: names, addresses, phone numbers, email addresses. Relevant information about suppliers and employees is collected and stored. The database is encrypted and backed up off-site automatically at regular intervals.
Information about the business is also recorded by service providers such as the banks and credit card companies, the landlord and the utility companies. These service providers send monthly digital itemized bills to the business where they are stored in the database for future reference.
While all of this information was always available, the technology to efficiently capture this information and store it in digital form did not exist in the past. Since it could not be efficiently captured the business was never able to exploit this information very effectively to improve its business practices.
Now the business uses all this information to compile a variety of monthly, annual and historical reports to manage billings, orders, payments and marketing in a semi-automated fashion. Periodically the manager studies these reports in an effort to gain knowledge and find opportunities to increase sales, reduce costs and generally improve efficiency. Ms. Jones completes her annual income, sales and property tax submissions using software that draws on her business data.
The data are clearly vital to the operation of the business. Yet when the manager compiles her annual balance sheet she lists among her assets a motor vehicle, computer and other equipment, furniture, inventories and financial assets but does not include the data. When asked about the data, she says that unlike the other items on her balance sheet, she has no idea what the associated value is.
If the business was sold, Ms. Jones believes it would command a price substantially higher than the total asset value on her balance sheet net of liabilities. The difference would be, in part, attributable to the implicit value of the data to a new owner.
The data are updated continuously and supply a regular flow of information services to the business. When asked about the expense of producing and maintaining her data service flows, she again is unable to specify the cost. These costs are not measured directly. Rather they are implicit in the costs of the labour, capital and purchased inputs involved in producing the data service flows.
Case 2: The case of an insurance company
Consider the case of the ABC insurance company. It has thousands of clients, each of which has purchased one or more insurance policies of various kinds. In a given year those clients pay insurance premiums and some file claims. When claims are made the company must determine the appropriate amount to pay. When it comes time to renew a client’s policies, the company can adjust premiums upward or downward. New clients can be acquired and some existing clients may depart, depending on pricing, marketing and other factors. Clients may also request modifications to their policies from time to time, increasing or decreasing coverage. If clients pay their premiums annually in advance, as is common, the company invests the funds and earns a financial return.
A good insurance company must constantly monitor and aim to optimize its client base, its product offering, its pricing and its expenses. Some classes of clients tend to generate above-average profits, while others can be a drag on profits. Some insurance products sell well and generate good returns while others are of more marginal value to the corporation. Every business day, sales, claims and expenses are recorded in the business database. The company uses all of this information in an on-going effort to maximize profits within a rapidly changing and highly competitive insurance market.
The kind of optimization efforts just described have gone on for as long as the insurance business has existed. However, in the pre-digital age these efforts were handicapped by the high costs and lengthy time lags involved in doing so. Information was stored in paper files and in the brains of seasoned employees. Decisions about product design, pricing, marketing, claims processing standards and the like were based, to a large extent, on personal experience, judgement and intuition. The market environment within which the business operated was fairly stable from one year to the next.
Today though, ABC is using modern artificial intelligence (AI) systems to assist with this optimization process.Note Major improvements in competitiveness and profitability have been the result.
The company buys professional services from an AI specialist firm that supplies modelling software and provides training and guidance on how to use it. ABC’s digital databases have been reorganized and are being updated more rapidly and with more detailed information than in the past. The AI models, combined with this information, are used to recommend pricing adjustments, to test the likely profitability of new insurance products, to identify areas where more or less marketing effort would be profitable, to assess recent claims history associated with different products and clients, and so on. ABC’s insurance agents and claims adjusters have access to the models and their supporting database on their desktops and use them in making rapid business decisions on a daily basis.
ABC has been accumulating data about its business for many years and those data have been digitized. The lengthy digital history is vital for the construction of the AI models, since it embodies periods of boom and bust and reflects the impact of many policy changes by the company over time, some that have succeeded and others that have failed. The AI models exploit these lessons learned and do not forget them. Moreover, going forward as the economic environment evolves and better AI models are developed, the database grows and is reused repeatedly in the ongoing effort to optimize operations. ABC’s employees have a valuable tool at their fingertips to help guide their decision making. The company is less dependent than it once was on the knowledge and experience of its long-term employees. In addition, the database serves as a kind of ‘moat’ that makes it more difficult for new entrants to the insurance industry, having no such database, to succeed.
The company’s database is clearly a valuable asset, although it is not recorded as such on the balance sheet. Indeed, its value is quite hard to determine.
Case 3: The case of an agricultural equipment manufacturing company
XYZ Inc. produces and sells a wide range of agricultural equipment such as tractors, cutters, shredders, harvesters, tillers, seeders and sprayers. Its business also includes other types of equipment used in construction, forestry and grounds care.
The company has been in business for a long time and has accumulated much knowledge and experience that is of great value in serving its clients. Its pace of knowledge accumulation has accelerated greatly in recent years in step with the technological revolution, and it is exploiting that ever-growing knowledge base to improve its products and services.
Its equipment now includes integrated sensors that both add a steady stream of new data to the company’s database and are used to provide feedback and analytical advice to its clients. The feedback helps the clients optimize their activities by monitoring the use of their equipment in real time, economizing on fuel, anticipating equipment servicing requirements and aiding in planning the use of their assets to maximize productivity. With data from thousands of customers, XYZ is in a strong position to analyze what farming approaches work best and make their findings available to their customers. In effect, the company is becoming as much an information service provider as a goods provider.
XYZ’s database and the daily flow of new data are increasingly central to its operations. Yet they are largely invisible in its financial statements, which conform to generally accepted accounting principles in their structure and content. As in the case of the ABC insurance company, the vital nature of its data assets seems clear, but it has no practical measures of their value beyond those based on cost.
Case 4: The case of a large internet-based service provider
SearchBook Inc. runs a large internet-based business. It offers a variety of ‘free’ online services to individuals including a search engine, a web browser, word processing and spreadsheet software, mapping, email, multi-language translation, photograph storage, a video library, a social networking application and a number of other services. This is enormously beneficial to millions of its users.
The services are ‘free’ in the sense that no monetary payments are required in order to use them. However, in another sense they are not ‘free’ at all but rather require payments ‘in kind’. As users of the online services take advantage of them, their unique Internet Protocol (IP) addresses are observed and their every action is recorded in an enormous database: what terms they enter in the search engine, which internet sites they visit on what date and for how long, the addresses and contents of their email messages and so on. By allowing the company to record all this information the users are, in effect, paying for the services ‘in kind’.
As time goes by, SearchBook builds up an extremely detailed picture of each individual user of its services. It learns what demographic group the user belongs to, his/her likes and dislikes, where he/she lives and travels, what kind of products he/she buys, what his/her political leanings may be and so on. The more the user utilizes the services, the more he/she reveals about him/herself and the more up-to-date the profile is.
SearchBook’s revenues come mainly from advertising. Business customers pay for mouse clicks on advertisements that are displayed on the computer screens through which its services are delivered. Unlike more traditional forms of advertisement, in print media or on radio and television for example, SearchBook’s advertisements are carefully targeted to each individual user of its products, based on the vast store of information in its database. Also, unlike in traditional media, its customers receive feedback on how successful each advertising campaign turns out to be, based on mouse click data, and the fee they pay is adjusted accordingly.
The company has major investments in buildings and computer equipment, particularly in cloud storage. It spends substantially on research and development to create new products and improve existing ones. But its primary asset, without a doubt, is its huge database, although the value appears nowhere explicitly in its balance sheet. Its stock market capitalization reflects this, being much greater than the book value of its physical and net financial assets.
Fundamentally then, SearchBook is in the business of gathering ‘big data’, organizing those data in a digital database, developing analytical methods and software applications to exploit those data and selling highly personalized advertising services to its ultimate clients. The company is very profitable.
Case 5: The case of a sports analytics company
Sports Studies Inc. (SSI) offers big-data-based analytical services to professional teams in several sports: basketball, baseball, football, hockey and golf primarily. These competitive sports are multi-billion-dollar enterprises where seemingly small differences in effectiveness on the playing field can mean large differences in salaries (for players) and revenues (for teams). Exploiting the high-frequency and very detailed data that are now collected routinely in each of these sports, SSI provides a variety of analytical services aimed at helping players and coaches optimize their individual and team performances.
For individual athletes, the company tracks several dimensions of effectiveness on a game-by-game basis, those dimensions varying from one sport to another. Players employ digital instruments on the playing field to record a variety of parameters. For example, sensors can be attached to a golf club to measure the angle of attack and the club speed. In some cases diet, sleep, heart rate and other personal data are also recorded for analysis. Digital video replays are organized in a database by player and can be used to review game activities in order to study strengths and weaknesses in player performance. SSI also offers an immersive virtual reality environment for athletes wherein they can practice certain maneuvers without having to go out on the playing field.
The company also helps coaches evaluate and adjust team strategies. For example, a baseball coach can use an SSI simulator to assess and optimize the player batting order against an opponent’s starting pitcher. Its software is also used by team managers to assess potential players when filling the team roster.
SSI is a relatively small, but rapidly growing company in a competitive industry. Its success depends on the databases that its analytical methods are focused on, some of them available for a fee from other companies that specialize in collecting and organizing data and others built and maintained by SSI itself as a service to its clients. The databases are growing rapidly in size and sophistication and their maintenance is crucial as the sporting environment—the players, their opponents, the playing fields, the rulebooks—keeps changing. To succeed in this business SSI must always be an innovator.
Data are the main input to SSI’s production process. Their associated cost is measured in terms of fees paid to use data collected by other businesses and salaries paid plus sensor costs to collect data directly. The associated databases contain historical as well as more current data, thereby allowing the company to compare athletic performance across players and over time. SSI’s analytical services depend entirely upon the data.
An ‘information value chain’
‘Data’ is a common word, but what does it mean exactly? What should it be defined as for economic analysis purposes?
The online Merriam-Webster dictionary defines data as: (1) “factual information (such as measurements or statistics) used as a basis for reasoning, discussion, or calculation”, (2) “information in digital form that can be transmitted or processed”, (3) “information output by a sensing device or organ that includes both useful and irrelevant or redundant information and must be processed to be meaningful”.Note
The online Oxford dictionary defines data as: (1) “facts and statistics collected together for reference or analysis”, (2) “the quantities, characters, or symbols on which operations are performed by a computer, which may be stored and transmitted in the form of electric signals and recorded on magnetic, optical, or mechanical recording media”, (3) “things known or assumed as facts, making the basis of reasoning or calculation”.
The word ‘data’ has evolved to an extent where it is synonymous with information that either is or can be stored, transmitted and processed in digital form. As the Oxford definition makes explicit, the term refers equally to “quantities, characters, or symbols”. As the Merriam-Webster definition stipulates, the word can refer equally to relevant and irrelevant information, which doubtless reflects the fact that relevance is subjective and depends on the context. The definitions also use the word ‘facts’, implying accuracy or truth, but there seems no need to confine the word ‘data’ to such information. False propaganda are data just as much as truthful news.
For the purposes of this study the ‘data’ will be defined as: “observations that have been converted into a digital form that can be stored, transmitted or processed and from which knowledge can be drawn”. The choice of the word observation is very purposeful in this context as will be seen later. This definition does not imply that everything digitized is therefore data. For example, a song that has been converted into digital format (or even recorded in digital format) is still a song – it will not be redefined as data just because there is a digital representation of the song. The definition proposed in this paper is limiting the definition of data to those observations (such as the weather, or the number of ‘likes’ on my latest post, or the number of goals my favorite hockey player scored in her last game) that someone or something has converted into a digital form and can therefore be stored, retrieved, manipulated and investigated at a point in time.
Having narrowed the definition of data this must now be put into a broader context. One way to think about data, as defined above, is that it is part of a larger information chain. This information value chain can be envisioned as having four unique and separable states. At the base of the chain is simply observations. Observations can be anything—from the temperature, to the fact that someone bikes to work or eats lunch at a specific time. Individuals, objects and the environment emit observations continuously. Observations are often fleeting and intangible. Observations do not necessarily need to be perceived by humans. In other words, objects and the environment can ‘emit observations’ even if there is no human observing them. While many observations are irrelevant and will never be recorded, they can be seen to represent the sum total of all activity—human or otherwise.
Often, for various reasons, someone may choose to record observations. In the past, prior to the advent of digital technologies, these observations were often recorded in books and ledgers. This was mainly to keep an historical record of activities either because some regulation required it or the observations would be needed at a later point in time to execute a task. In today’s digital world, pencil and paper have been replaced by the keyboard, sensors and electronic storage devices.Note As previously noted, this second layer in the value chain, where observations are converted into digital form, will be referred to as ‘data’.
Data are the digital representation of observations or activities. In order for data to come to be, someone has to decide that something needs to be recorded and has to set up the capture system so the observations can be both taken and stored. This recording, implies that something is being done by someone. In layman’s terms, when something is done for economic reasons, or an economic purpose, the System of National Accounts recommends recording this as production. In other words, there is a strong argument, in this case, that data are produced.
Additional value can be added to this chain by organizing and structuring the captured bytes of data. The 2008 SNA defines the product ‘databases’. It says (para. 10.112): “Databases consist of files of data organized in such a way as to permit resource-effective access and use of the data. Databases may be developed exclusively for own use or for sale as an entity or for sale by means of a license to access the information contained. The standard conditions apply for when an own-use database, a purchased database or the license to access a database constitutes an asset.”
It is important to distinguish between data and databases. They are not the same. Data as previously described are observations that have been converted into a digital form that are stored. They can be thought of as raw material. They are the bytes of information that have not yet been structured and are not easily interpretable. A database is an organized store of data that can be readily retrieved and manipulated. Databases or structured data can then be considered the third tier in the information chain. The boundary between data and databases can be blurry. The main distinguishing feature between the two is that there generally is a normalization process that occurs between data and databases. This can be as simple as assigning a data point a specific code set such as the code 1, 2 or 3 signifying gender. Data or digitized observations can be seen as singular and separate, a database brings these observations together in a structured way. For example, a small business may record the IP addresses that visit their website. Each visit is a data point. The small business may decide to load all of these observations or data points into a database for retrieval or further analysis. The task (or production) of bringing the data together into a single database is separate from the task (or production) of digitizing the observation of someone visiting the website.
Often the conversion of an observation into data and the loading of the data into a database can be instantaneous. In fact, this may happen in most of the cases. Regardless of the interconnectedness of these processes, for the purposes of this paper as they are considered separate activities.
The fourth tier, and most likely the most valuable one, is when individuals are able to glean insights or new knowledge from the observations that were digitized and became data and then were organized in a database to facilitate retrieval and analysis. Google has recently coined the term ‘know what your data know’, which may best explain this process. It is true that each data point or datum embodies some knowledge. This fourth tier goes beyond measuring the knowledge contained in each datum. It involves the collective knowledge that can only be gleaned when a volume of data is looked at as a whole. This new knowledge includes patterns and relationships that are not evident when looking at each datum in isolation. The definition for this activity is embedded in the 2008 SNA definition of ‘research and development’ where it states (para. 10.103) that research and development are “undertaken on a systematic basis in order to increase the stock of knowledge, including knowledge of man, culture and society, and use this stock of knowledge to devise new applications”. This part of the information chain does not signify a deviation from the 2008 SNA standard. For the purposes of this paper this activity is referred to as ‘data science’.
This activity of data science is different and separable from the databases that support it, the raw data and the underlying observations contained in each datum. This information value chain is illustrated in Figure 1.
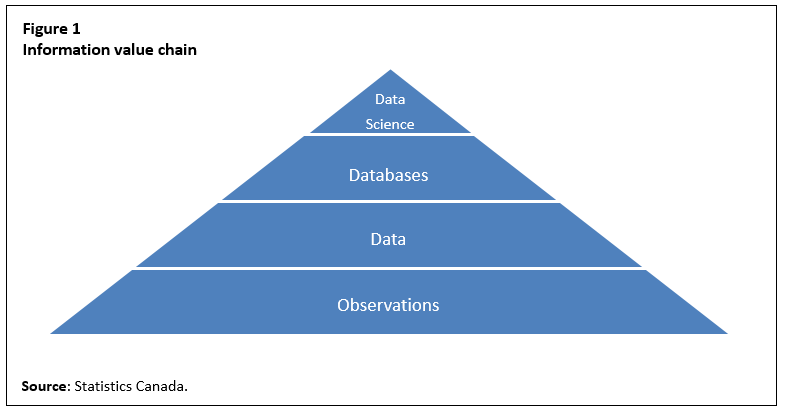
Description for Figure 1
The figure is of a pyramid with four layers. The bottom layer is labelled “Observations”. The second layer is labelled “Data”. The third layer is labelled “Databases”. The top layer at the peak of the pyramid is labelled “Data science”. All of the layers are coloured blue.
It should also be noted that there is a circular flow to the information value chain and it may be characterized alternatively as an ‘information cycle’. In many ways, observations become data, data are stored in databases, new knowledge is drawn out of the databases through systematic investigation and this new knowledge becomes observations.
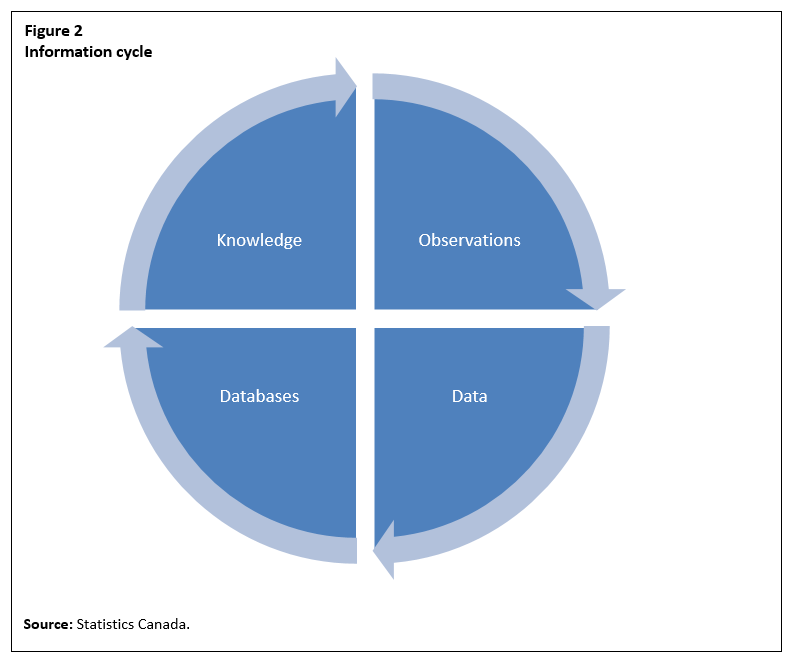
Description for Figure 2
The figure is of a blue pie-shaped disk with four quadrants. The top right-hand quadrant is labelled “Observations”. The bottom right-hand quadrant is labelled “Data”. The bottom left-hand quadrant is labelled “Databases”. The top left-hand quadrant is labelled “Knowledge”. There are arrows around the perimeter of the disk pointing from observations to data to databases to knowledge and then back to observations.
The idea of an information value chain can be illustrated with an example. Consider the sports analytics case from earlier (Case 5). Each year, there are over 1000 hockey games taking place. During these games a massive amount of activity takes place: players shoot, check, change shifts, take penalties and so on. Millions of observations are generated. These observations (regardless of whether or not they are regarded by humans) represent the first tier in the information chain. In the past, National Hockey League (NHL) scouts have attended hockey games in order to scout out the competition and try to develop strategies that would allow them to obtain an advantage in upcoming games. They watched and made assessments based on their observations. Assume an NHL hockey team decides to invest in sensors that record the movement of their players during games and practices. The team records and digitizes these observations measuring the time on the ice, the speed of the player, the velocity of the shots, the number of hits, the efficiency of their path to the puck and so on.
The recording of these observations represents data—the second tier in the information value chain. The hockey team then inputs the data into a database that includes data from previous games as well as data from other players. This normalization of the data into a database represents the third tier in the information chain. The team then employs a number of data scientists to analyze the results in order to determine the best match-ups: player for player, line for line, situation for situation. This analysis or insight obtained through the examination of the data represents the acquisition of new knowledge by the team. This knowledge is now an asset the team management can use to influence the outcome of the upcoming games. The coaches use this knowledge repeatedly in order to win as many hockey games as possible. By winning more games the team will generate more ticket sales, increasing overall team revenue. This ‘information value chain’ is an important part of the hockey club’s production process in delivering entertainment services to its fans and is an asset as much as the physical rink in which the games are played.
While the conceptual framework for recording and valuing databases, and research and development, already exists in macroeconomic frameworks, the sources, methods and scope used by statistical agencies may be limited. The conceptual framework for recording and valuing the digitization of vast amounts of observations is less developed and it could be argued that this falls outside of the 2008 SNA production and asset boundaries. Having developed the concept of an information value chain, the nature of each element of the chain and how they ‘come to be’ will now be discussed.
Nature of observations, data, databases and data science
An essential question about observations, data, databases and data science—or the information value chain—is: what part of the chain is ‘produced’ and what part is ‘non-produced’? The answer to this question determines what gets included in gross domestic product (GDP)and what is excluded.
The 2008 SNA already answers this question for databases and data science. Databases are recognized as assets and are produced. Given that it is difficult to distinguish databases from database management software, the value of a database is often grouped with its supporting software.
Similarly, the 2008 SNA defines ‘research and development’ (which includes the definition of data science) as “the value of expenditures on creative work undertaken on a systematic basis in order to increase the stock of knowledge, including knowledge of man, culture and society, and use of this stock of knowledge to devise new applications.” (para. 10.103).
Research and development, including data science, are recognized as produced assets within the Canadian System of National Accounts (CSNA) under the asset category ‘intellectual property products’ (IPP). While the CSNA conceptually includes these assets, the data system used to measure data science activities needs to be re-examined. For example, in Canada, estimates of investment in research and development are obtained from the Annual Survey of Research and Development in Canadian Industry (RDCI). This is an economy-wide survey stratified by those firms most likely to engage in research and development activities. This survey was developed a number of years ago and is biased towards the selection of firms engaged in more traditional forms of research and development activities (e.g. pharmaceutical) with under-representation of the growing number of firms across a diverse set of industries undertaking data science activities.
While the 2008 SNA clearly argues that research and development and databases are produced assets it says little about the other parts of the information value chain. As a result, countries do not record observations nor data as defined in this paper. The 2008 SNA argues that since there is no production process leading to their existence, observations and data fall outside the economic production boundary. Increases in observations or data will therefore have no impact on measures of economic activity such as gross domestic product or national wealth. Given the different ways observations and data are being used, it is important to re-examine this guidance. Are observations and/or data, in fact, produced and should they enter the production boundary?
Some observations can be thought of as a natural resource. Much like fresh air exists, or trees exist or minerals exist, observations in their purest form simply exist. They are a consequence of the actions of humans and the environment. In some cases, one could argue some observations are produced, such as someone observing someone else riding their bike—it takes a lot of work to produce that observation. In some sense observations are everything we do. We go to work, we have dinner with our family, we exercise, the wind blows, it is cold, it is sunny—all of these are observations. We use these observations each day to manage our activities and make decisions. We exchange observations every day: whenever you ask someone how they are doing and they respond, you are the recipient of an observation they are providing to you. While most observations are related to ‘doing’, most are not being done for economic purposes.
Given these examples and assumptions, it is difficult to argue that observations are produced assets. For the purposes of this paper, observations will therefore be treated as non-produced. This is not to say that observations do not have value. Observations can have significant, often life-saving value. This is only stating they are not produced and therefore fall outside the economic accounting production boundary.
What about data? As previously defined, ‘data’ are “observations that have been converted into a digital form that can be stored, transmitted or processed and from which knowledge can be drawn”. In the preceding paragraphs it is argued that observations are non-produced. Does this extend to data? Are data different from the observations they embody? Are data produced? There are a few attributes of data that provide a clue as to the answers to these questions.
First, there is a process that needs to take place to convert observations into bytes of data. Sometimes this process can be costless or have low marginal cost, such as when data are generated using a sensor. Often, these processes do not require a ‘labour input’, such as in the case of a sensor reading the quality of air. Regardless of the cost, there is some sort of transformation that occurs by which an observation changes states from non-digital to digital.
Businesses and households spend significant resources protecting data. This is a strong indication that data are owned or at least someone is acting as a custodian of the data. The fact that data appear to be owned is another signal that, by extension, they are produced.
Finally, more and more businesses are selling data as either a primary or secondary output. Data are a product and in order for data to be sold they must first be produced. An analogy could be drawn with air. Most of the air life on earth breathes is not produced and has no market value. But scuba divers need air and there are companies that compress the air into tanks and sell it to them. So even though most air is not produced, some air is produced. The same applies to observations. Observations are not produced but when they are digitized and sold something has been produced. The cost of producing the data may be very low or zero at the margin but there appears to be a market for data—independent of the software used to store and retrieve the data.
Given the presence of these ‘clues’, for the purposes of this paper it is considered that data are produced. They do not simply ‘appear’. There must be an action that brings the data into existence.
Given the previous arguments, Figure 1 can be updated by delineating the portion of the information value chain that is produced (and therefore should be valued) and that portion that is non-produced. See Figure 3.
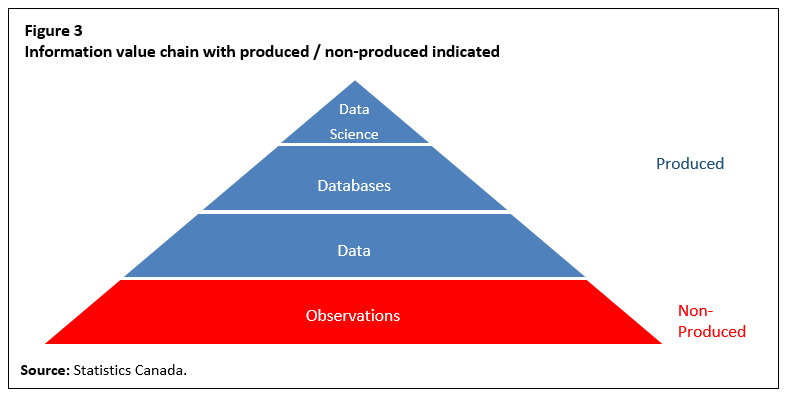
Description for Figure 3
The figure is of a pyramid with four layers. The bottom layer is labelled “Observations” and is coloured red. The second layer is labelled “Data” and is coloured blue. The third layer is labelled “Databases” and is coloured blue. The top layer at the peak of the pyramid is labelled “Data science” and is coloured blue. Beside the pyramid it is stated that red signifies non-produced while blue signifies produced.
A typology for data
Having defined an information value chain and what is produced and not-produced the question of how each element in the chain should be classified can now be addressed. This typology is required for two purposes. First, it is possible that different elements in the information value chain have different values. By separating the value chain into non-overlapping components it may help refine the value of each element in the chain. Second, by separating or disentangling information in this way the analytical usefulness of the resulting estimates could be improved, enabling users to identify areas of growth or value creation.
Transactions
The 2008 SNA distinguishes among different types of transactions and between stocks and flows. One of the questions this paper needs to address surrounds the nature of data. Are they a store of value? Can they be fully consumed during an accounting period or are they used repeatedly and continuously in the process of production?Note
The 2008 SNA already addresses these questions for databases and data science as defined in this paper. The 2008 SNA recognizes these as assets since they are used repeatedly or continuously in the production of goods and services.
Before ‘data’ is defined it is important to consider that data have a number of unique characteristics that are not found in other produced goods and services. For example, data can be copied (at zero or near zero cost) and the same data can exist simultaneously in multiple locations. Data can accumulate and do not physically decay or deplete naturally like other produced assets such as machines, buildings or natural resources, although their economic value can depreciate if their utility decreases over time.
Data can come into being as a primary product in which the main goal of the process is to collect and digitize observations, which can subsequently be transferred from one entity to another.
Data can also be a secondary product. For example, a grocery retailer installs electronic readers by the cash registers, records the price, quantity, time, date and other observations for all product purchases and sells the resulting data to an analytics firm. This grocery retailer is producing data as a secondary product.
Data can also be a by-product, coming into existence as a result of some production without being intended as a primary or secondary product per se. An example is when, as was previously mentioned, a tractor collects soil condition information and feeds that information into an ‘app’ that advises a farmer about which crop to plant or what type of fertilizer is required.
The key question that needs to be addressed is whether or not data represent a store of value that is used continuously for more than one year in the process of producing goods and services, whether it is an intermediate input, fully consumed in the production process in the current period or whether it is consumed by households, governments and non-profits as final consumption.
While it is conceivable that data, as defined in this paper, could be either a final consumption good or an intermediate consumption good, it is probably small in scale compared to the use of data as an asset. If data were used as an intermediate input and produced on an own-account basis, the 2008 SNA would recommend against recording this—since the firm would first need to record the production of the data and then their use—resulting in no impact on GDP. In the case of household consumption, households are consuming more and more digitized products, but as noted earlier these products do not represent data as defined here. Digital music is music, and digital movies are movies and not data. Therefore, it is unlikely that households will consume data as a final consumption product.
The 2008 SNA defines a service as something that changes the conditions of the consuming units, or facilitates the exchange of products or financial assets. Goods are physical, produced objects for which a demand exists, over which ownership rights can be established and whose ownership can be transferred from one institutional unit to another by engaging in market transactions. Neither of these definitions apply fully to data. Data are not physical or tangible—they are intangible—but ownership rights can exist and be transferred from one unit to another. Similarly, data do not necessarily change the condition of the consuming unit. They may change the decision made by a consuming unit, which in turn may change their condition, but the impact of the data is of a secondary order rather than a first order. For the purposes of this exercise it is assumed that data are more like goods than services and they will be classified as such.
Therefore, in this paper data will be treated as an asset and will be assumed to be used on a continuous basis in the process of production.
Classification
The second aspect the typology of information needs to address is whether or how the information value chain should be partitioned such that users can properly interpret the information. The structure of the chain already provides one type of ‘evolutionary’ typology: observations to research and development (knowledge). While this logical chain is an important part of the typology it is not sufficient.
There are a great many kinds of information. To measure and analyze them implies the need for a logical structure that arranges different kinds of information into a number of mutually exclusive and exhaustive classes and sub-classes. In this, information is just like other key concepts in statistics such as occupations, crimes, diseases, industries and products.
Many approaches can be taken. One approach could be to group information according to what it is about or represents (e.g. weather data, sports data, economic data). The alternatives could be to classify the information based on the applications or services it provides (weather forecasting, sports news broadcasts, informing the public about the economy), but the difficulty with that approach is that one set of information can provide services of several different kinds.
When developing a classification system for information it is also important to consider whether firms and households would be able to report the information according to the proposed groupings. Most businesses tend to group data by ‘subject’. For example, a firm would separate its accounting records, such as sales information, from its personnel records. This is not to say that firms would not be able to link this information together (for example, sales by employee) but the primary purpose of the sales information is to measure sales and the primary purpose of the personnel information is to measure and track employee characteristics and activities. Likewise, an investment firm would mainly hold economic data and a professional sports team would mainly hold sports data.
The Organisation for Economic Co-operation and Development (OECD) among others is working on the important question of how best to classify data and the issue will not be further pursued here.Note
Ownership and transfer of ownership
The rapid changes in the role of information in recent years have raised questions about information ownership and control. In some situations, information is rented, leased or licensed to a customer, under the terms of an explicit user agreement. In other situations, companies or governments may collect information from other institutional units, often with an implicit or, increasingly, with an explicit agreement between the information collector and the information provider, the latter receiving some form of services in return. Google and Facebook are examples.
There are potentially at least three players involved in the ownership and/or custodianship of information. One of these is the original information provider as, for example, in the case of the person who willingly allows Google or Facebook to record and store information about them in exchange for gaining access to their services. Another is the receiver of the information, Google or Facebook in the example, who effectively owns the information since it is controlled by and stored on the servers of that receiver. It is difficult to argue that the original provider still owns the information after it is provided, but they retain a legitimate interest in how the receiver of the information makes use of it and protects its confidentiality. The third player is responsible government that determine the laws governing the use of information and retain some rights themselves (varying from country to country) to gain access to the information for statistical, crime-fighting or other purposes.
The 2008 SNA distinguishes between two types of owners of assets: legal owners and economic owners. Legal owners have the right to the asset in law. They determine who can use it and the terms under which it can be used. Economic owners are those institutional units that do not necessarily have the legal right to retain the asset indefinitely, but are responsible for using it and bear the risk associated with its use. For the purposes of this framework it is assumed that the economic owner of information is the institutional unit controlling the information and exploiting it for economic purposes. This may or may not coincide with the legal owner of the information, depending on the legal framework of the relevant jurisdiction. For example, in the case of providing information to a social media website, an individual may ‘like’ something and they are the legal owner of that information. The social media website is the economic owner since it has access to the information, can use it and bears the risk associated with that use. The individual is the legal owner insofar as they retain the right to delete it.
As with other kinds of intellectual property, information can be duplicated, sold and easily transferred from one location to another. The fact that data can be easily transferred from one location or economic territory to another poses a significant challenge for the measurement framework.
Consider the case of data, databases, or data science acting as an asset in the production process, similar to how a machine may be used to produce goods and services. Like all factors in the production process, the factor ‘earns’ an income from its use. Suppose that in year one, all the data, databases, and data science used by a firm in the production of goods and services are co-located with the ‘labour inputs’ and other physical assets such as buildings and machines. In this case all the returns to the production process would remain in the country where the data, labour and physical capital are located. Assume that in year two the firm decides to store its information in another country. In this case, because the asset (information) is located in another country the national accountant would flow the ‘information’ share of the value added to the country where the data are located. Given the ease with which data can be transferred from one location to another, this may lead to results where large amounts of value added are allocated to economic territories where very little economic activity is taking place. In order to avoid this, for the purposes of this proposed framework, the asset will be located where it is used, even if it resides on a server in another economic territory.
This approach is quite different from the current treatment of IPP in the 2008 SNA. This approach states that a firm cannot move its information from one economic territory to another but that the ‘information’ must remain in the economic territory where it was produced. If a firm sells the rights to its information to another firm in another economic territory, then in this case the asset would change economic territories.
The rationale for this approach is tied to the valuation method. As will be shown in the next section, the value of gross fixed capital formation of data is tied, to a large extent, to the value of labour and capital used to produce the data. The idea is that the information should not be separated from the factors of production that brought it into existence. In this way data can be seen to be very similar to natural resources. Natural forces bring an economic territory’s natural resources into existence. Once they are in existence, the natural resources cannot be removed from the economic territory. Rights can be sold, but the asset itself remains with the economic territory where it was formed.
Another option is to locate the information in the economic territory where it was first produced. Sensitivity tests should be done to study the implications of this approach. These sensitivity tests are outside the scope of this paper.
Valuing information
Having defined a general framework for measuring information, the development of methods to determine its economic value must be considered. As noted earlier, observations are non-produced and fall outside of both the production boundary and asset boundary. This means that for the purposes of this measurement framework a value of observations (i.e. the day-to-day events, occurrences and activities that could be digitized if someone found it beneficial to do so) is not assessed. Attention can therefore turn to valuing data—the second link in the information value chain.
Various ‘back of the envelope’ estimates of the volume of data have been calculated. The International Data Corporation estimatesNote there are about 35 zettabytesNote today in the ‘global datasphere’ and the number is expected to grow to 160 by 2026. About 20% of this amount is believed to reside in core enterprise and cloud data centres, a further 15% in enterprise computers and appliances that are not core data centres and the remaining 65% in other devices including personal computers, phones, cameras, sensors and the like.
If zettabytes of information exist and this information is growing, then it stands to reason people or equipment must be managing all these data. Not only will people be managing these data, but there will be people drawing insight from this information. If not, why store them in the first place? The fact that people are engaged in data-related activities points to a potential method to value the data.
The standard valuation technique used when an asset is not sold on the market is to employ a sum of costs approach, where the value of the asset is represented by the sum of the costs of the inputs used to create the asset plus an appropriate rate of return. For example, if a firm builds a warehouse for its own use, the cost of the materials and labour used to construct the warehouse along with an estimated rate of return on their capital would be used to value the asset.
For the purposes of this paper, this approach is favoured to value data. Other approaches could be used such as the costs associated with storing, protecting and maintaining the data as a proxy for their value when they are not sold on the market. These costs could be calculated as the discounted expected future stream of data maintenance costs associated with the data. There are a number of advantages to this approach. First, it should be possible for firms to provide estimates of their costs to store and protect information. Second, if data are no longer useful or needed, firms will delete the data to avoid the costs of storage and management. Finally, certain data could be more expensive than other data since firms make choices about the level of security, back-up procedures and access for different groups of data.
If the intention is to value the acquisition of data or the transformation of observations (which could originate in digital or non-digital form) to data (interpretable bytes of information) then including on going storage costs could overestimate the value because these storage costs are not adding to the value of the data. In fact, if data are seen as an asset then the storage costs could be seen as the maintenance costs associated with the data (much like the 2008 SNA would view the maintenance costs on a conveyor belt asset in an assembly line).
While new ‘data accumulator’ firms are emerging and selling data they accumulate on the market, this paper favours the same valuation method for all data—that being a sum of costs approach with a capital services mark-up as a proxy for market value. In the future, when a better understanding of the marketplace of data develops new valuation techniques will be explored for valuing data.
The valuation of databases and research and development is relatively straightforward since methods for this are outlined in the 2008 SNA manual. With respect to the valuation of databases the manual recommends:
The creation of a database will generally have to be estimated by a sum-of-costs approach. The cost of the database management system (DBMS) used should not be included in the costs but be treated as a computer software asset unless it is used under an operating lease. The cost of preparing data in the appropriate format is included in the cost of the database but not the cost of acquiring or producing the data. Other costs will include staff time estimated on the basis of the amount of time spent in developing the database, an estimate of the capital services of the assets used in developing the database and costs of items used as intermediate consumption. (para. 10.113)
Databases for sale should be valued at their market price, which includes the value of the information content. If the value of a software component is available separately, it should be recorded as the sale of software. (para. 10.114)
With respect to the valuation of research and development the 2008 SNA recommends:
The value of research and development (R&D) should be determined in terms of the economic benefits it is expected to provide in the future. This includes the provision of public services in the case of R&D acquired by government. In principle, R&D that does not provide an economic benefit to its owner does not constitute a fixed asset and should be treated as intermediate consumption. Unless the market value of the R&D is observed directly, it may, by convention, be valued at the sum of costs, including the cost of unsuccessful R&D (para. 10.103).
For the purposes of this study the recommendations of the 2008 SNA are accepted.
Conclusions
Data, databases and data science are having a profound impact on the world economy and society more generally. There is no doubt about this. Moreover, it seems likely this impact will grow even larger in the years ahead. Yet while the growing importance of the information chain is evident, the existing framework for economic measurement does not reveal much about it.
This paper is an effort to build upon the established economic statistics framework in a way that makes the roles of and temporal changes in data, databases and data science more evident. It elaborates on the character of these three product types and tries to situate them within the modern SNA structure.
A subsequent paper will offer a range of tentative numerical estimates of the size of recent investments in these products and in the associated accumulation of capital assets in Canada. These estimates are calculated using employment and labour income data for selected occupational classes, derived from the Census of Population and the Labour Force Survey.
All of this and more is vital work for Statistics Canada given the importance of the information revolution that is already well under way.
- Date modified: