|
|
| |
Information identified as archived is provided for reference, research or recordkeeping purposes. It is not subject to the Government of Canada Web Standards and has not been altered or updated since it was archived. Please "contact us" to request a format other than those available.
 |
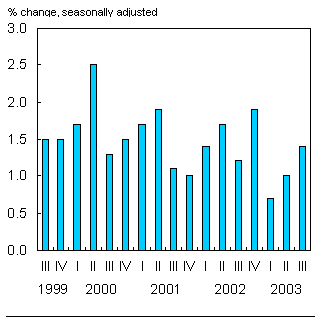
13-214-XIE HighlightsNational net worth reached $3.9 trillion by the end of the third quarter or $123,200 per capita, up from $121,600 in the previous quarter. Advance in national net worth reflects reduced net foreign debt and increased expendituresNational net worth grew 1.4% (seasonally-adjusted) in the third quarter, at a faster pace than in the previous quarter. A decline in net foreign debt (-3.6%) was a major factor, as what we owe to non-residents fell and what they owe us rose. This decline reflected substantial non-resident sales of federal government bonds, and followed two quarters of significant currency appreciation-driven increases in net foreign debt. National net worth
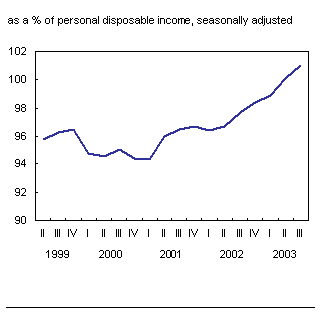
Strengthened final domestic demand also contributed to the advance in national net worth, led by a pick up in personal expenditure on durable goods and continued investment in housing in the quarter, as the economy expanded. Non-financial assets, or national wealth, rose 1.3% (seasonally adjusted). Household net worth advances, despite debt load increaseHousehold net worth also advanced at a faster clip in the third quarter, as the increase in assets exceeded that of liabilities. Households account for the lion’s share of net worth in the economy through their significant ownership ($2.0 trillion) of non-financial assets – principally, residential real estate – and substantial financial investment holdings ($2.5 trillion). However, that share declined marginally in the quarter, as both corporate and government net worth improved. Non-financial assets and financial assets rose 2.0% and 0.8%, respectively in the third quarter. Increased expenditure on housing, as well as gains in the value of housing, accounted for the growth in non-financial assets. The increase in the stock of consumer durable goods was moderated by sharp declines in the prices of new motor vehicles. Small gains were recorded for insurance, pension funds and mutual fund assets in the quarter. Stimulated by household spending and a continued boom in the housing market, the demand for funds in the third quarter pushed household consumer credit plus mortgage debt up. As a result, the ratio of household debt to personal disposable income moved up to a new high of 101.0% (seasonally adjusted). However, interest rates eased in the quarter moderating the burden of carrying a higher debt load. Household debt burden rises further
Corporations’ equity advance reflects the vigour in undistributed earnings in the third quarterThe finances of corporations continued to improve in the third quarter, as profits advanced. With capital spending up, but inventories drawn down in the quarter, non-financial assets grew 0.6%. However, undistributed earnings outpaced non-financial capital acquisition, generating a further increase in net lending in the corporate sector. Notably, corporations have been generating a surplus and supplying funds to the economy for over 12 consecutive quarters. This has allowed firms to substantially restructure their balance sheets over that period. For non-financial private corporations, strong earnings combined with higher share issues contributed to strengthened balance sheets. Leverage decreased again in the quarter, as credit market debt edged down (-0.2) while equity expanded sharply (2.6%). The debt-to-equity ratio continued its long-term downward trend, reaching levels not seen since the 1970’s. Even though long-term debt declined in the quarter, the ratio of short-term debt to long-term debt continued to fall. Liquidity of these corporations has improved steadily since the second quarter of 2000, as current assets continued to outpace current liabilities. Corporate leverage continues to plummet
Governments’ financial position strengthensNet worth of governments, while remaining negative, edged up in the third quarter. Non-financial assets of the government sector rose while net debt fell. However, the decline in net debt was in the federal government sector, reflecting the expanding surplus in the quarter. Government sector credit market debt advanced 0.4% in total, and 0.2% for the federal government sector. Notably, the proportion of federal government bonds held by non-residents dropped to 18.7% from 23.4% in the previous quarter. Both government sector credit market debt and net debt declined relative to GDP, with this drop more pronounced at the federal level. National balance sheet accounts1
|
||||||||||||||||||||||||||||||||||||||||||||||||||||||||||||||||||||||||||||||||||||||||||||||||||||||||||||||||||||||||||||||||||||||||||||||||||||||||||||||||||||||||||||||||||||||||||
|
|
|