Canada at a Glance 2018
Labour
Archived Content
Information identified as archived is provided for reference, research or recordkeeping purposes. It is not subject to the Government of Canada Web Standards and has not been altered or updated since it was archived. Please "contact us" to request a format other than those available.
| 2007 | 2012 | 2017 | |
|---|---|---|---|
| thousands | |||
| Labour force | 17,847 | 18,810 | 19,663 |
| Males | 9,442 | 9,886 | 10,336 |
| Females | 8,405 | 8,924 | 9,327 |
| Employed | 16,769 | 17,438 | 18,416 |
| Males | 8,839 | 9,123 | 9,636 |
| Females | 7,930 | 8,315 | 8,781 |
| Unemployed | 1,077 | 1,372 | 1,247 |
| Males | 602 | 763 | 701 |
| Females | 475 | 609 | 546 |
| % | |||
| Unemployment rate | 6.0 | 7.3 | 6.3 |
| Males | 6.4 | 7.7 | 6.8 |
| Females | 5.6 | 6.8 | 5.8 |
| Participation rate | 67.4 | 66.5 | 65.8 |
| Males | 72.5 | 71.0 | 70.2 |
| Females | 62.5 | 62.1 | 61.5 |
| Employment rate | 63.4 | 61.7 | 61.6 |
| Males | 67.9 | 65.5 | 65.4 |
| Females | 59.0 | 57.9 | 57.9 |
| Source: Statistics Canada, CANSIM table 282-0002. | |||
| 2007 | 2012 | 2017 | |
|---|---|---|---|
| current dollars | |||
| Total employees, all industries | 750.75 | 863.12 | 955.81 |
| Goods-producing industries | 881.72 | 1,024.18 | 1,130.73 |
| Agriculture | 502.45 | 623.60 | 703.69 |
| Forestry, fishing, mining, quarrying, oil and gas | 1,186.56 | 1,463.03 | 1,669.51 |
| Utilities | 1,163.70 | 1,324.62 | 1,549.09 |
| Construction | 885.38 | 1,043.44 | 1,164.89 |
| Manufacturing | 838.74 | 933.14 | 1,009.11 |
| Services-producing industries | 711.63 | 818.74 | 910.76 |
| Wholesale and retail trade | 547.83 | 621.73 | 716.95 |
| Transportation and warehousing | 820.05 | 921.91 | 1,016.18 |
| Finance, insurance, real estate, rental and leasing | 842.66 | 986.04 | 1,116.78 |
| Professional, scientific and technical services | 1,000.63 | 1,143.49 | 1,251.74 |
| Business, building and other support services | 563.32 | 653.27 | 710.20 |
| Educational services | 861.22 | 1,013.93 | 1,086.92 |
| Health care and social assistance | 723.80 | 829.89 | 922.12 |
| Information, culture and recreation | 724.53 | 786.28 | 834.07 |
| Accommodation and food services | 358.74 | 417.97 | 456.44 |
| Public administration | 1,005.93 | 1,170.31 | 1,307.35 |
| Other services | 625.79 | 728.95 | 796.91 |
|
Note: North American Industry Classification System (NAICS), 2012. Source: Statistics Canada, CANSIM table 282-0072. |
|||
| 2007 | 2012 | 2017 | |
|---|---|---|---|
| thousands | |||
| Total, all industries | 16,769 | 17,438 | 18,416 |
| Goods-producing industries | 3,969 | 3,874 | 3,876 |
| Agriculture | 336 | 306 | 280 |
| Forestry, fishing, mining, quarrying, oil and gas | 342 | 366 | 330 |
| Utilities | 138 | 133 | 133 |
| Construction | 1,127 | 1,323 | 1,409 |
| Manufacturing | 2,026 | 1,747 | 1,725 |
| Services-producing industries | 12,801 | 13,564 | 14,541 |
| Wholesale and retail trade | 2,665 | 2,661 | 2,810 |
| Transportation and warehousing | 821 | 857 | 944 |
| Finance, insurance, real estate, rental and leasing | 1,046 | 1,062 | 1,171 |
| Professional, scientific and technical services | 1,124 | 1,271 | 1,449 |
| Business, building and other support services | 696 | 704 | 757 |
| Educational services | 1,174 | 1,210 | 1,285 |
| Health care and social assistance | 1,839 | 2,141 | 2,383 |
| Information, culture and recreation | 775 | 759 | 789 |
| Accommodation and food services | 1,072 | 1,170 | 1,211 |
| Public administration | 865 | 924 | 961 |
| Other services | 724 | 805 | 781 |
|
Note: North American Industry Classification System (NAICS), 2012. Source: Statistics Canada, CANSIM table 282-0008. |
|||

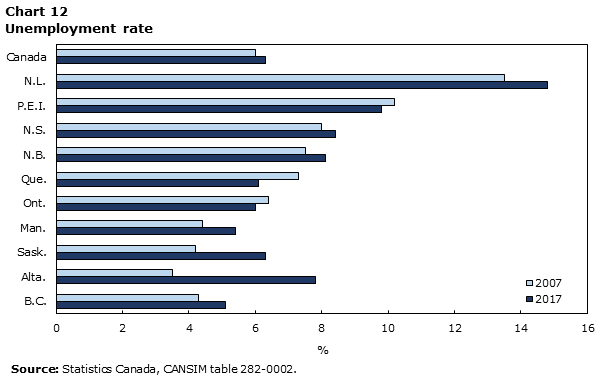
Data Table for Chart 12
| 2007 | 2017 | |
|---|---|---|
| % | ||
| B.C. | 4.3 | 5.1 |
| Alta. | 3.5 | 7.8 |
| Sask. | 4.2 | 6.3 |
| Man. | 4.4 | 5.4 |
| Ont. | 6.4 | 6.0 |
| Que. | 7.3 | 6.1 |
| N.B. | 7.5 | 8.1 |
| N.S. | 8.0 | 8.4 |
| P.E.I. | 10.2 | 9.8 |
| N.L. | 13.5 | 14.8 |
| Canada | 6.0 | 6.3 |
| Source: Statistics Canada, CANSIM table 282-0002. | ||
- Date modified:
