Population
Archived Content
Information identified as archived is provided for reference, research or recordkeeping purposes. It is not subject to the Government of Canada Web Standards and has not been altered or updated since it was archived. Please "contact us" to request a format other than those available.
Tables
- Table 1 Population estimates
- Table 2 Components of demographic growth
- Table 3 Population by mother tongue
- Table 4 Estimates of population, by census metropolitan area
Charts
- Chart 1 Population growth
- Chart 2 Marital status of Canadians, 2014
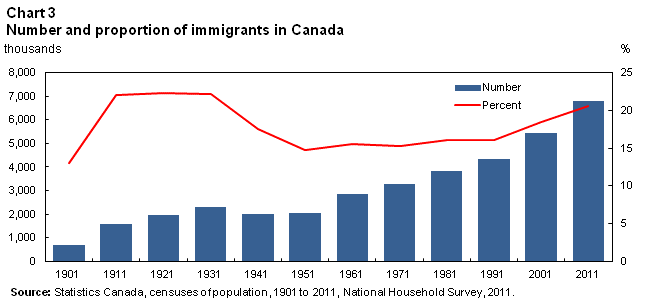
- Chart 3 Number and proportion of immigrants in Canada
- Chart 4 Regional distribution of the population reporting an Aboriginal identity
Tables
| 2004 | 2009 | 2014Note p: preliminary | 2004 to 2014 | |
|---|---|---|---|---|
| number | % change | |||
| Canada | 31,938,004 | 33,628,571 | 35,540,419 | 11.3 |
| Newfoundland and Labrador | 517,402 | 516,729 | 526,977 | 1.9 |
| Prince Edward Island | 137,681 | 139,909 | 146,283 | 6.2 |
| Nova Scotia | 939,612 | 938,194 | 942,668 | 0.3 |
| New Brunswick | 749,408 | 749,954 | 753,914 | 0.6 |
| Quebec | 7,535,278 | 7,843,475 | 8,214,672 | 9.0 |
| Ontario | 12,390,068 | 12,997,687 | 13,678,740 | 10.4 |
| Manitoba | 1,173,223 | 1,208,589 | 1,282,043 | 9.3 |
| Saskatchewan | 997,312 | 1,034,782 | 1,125,410 | 12.8 |
| Alberta | 3,238,387 | 3,679,092 | 4,121,692 | 27.3 |
| British Columbia | 4,155,017 | 4,410,679 | 4,631,302 | 11.5 |
| Yukon | 31,454 | 33,732 | 36,510 | 16.1 |
| Northwest Territories | 43,305 | 43,149 | 43,623 | 0.7 |
| Nunavut | 29,857 | 32,600 | 36,585 | 22.5 |
|
p preliminary Note: Population estimates as of July 1. Source: Statistics Canada, CANSIM table 051-0005. |
||||
| 1993/1994 | 2003/2004 | 2013/2014Note p: preliminary | |
|---|---|---|---|
| number | |||
| Births | 386,159 | 337,762 | 385,937 |
| Deaths | 206,464 | 228,829 | 256,721 |
| Immigrants | 235,360 | 239,083 | 267,716 |
| Emigrants | 49,456 | 55,951 | 61,928 |
| Returning emigrants | 16,358 | 30,501 | 36,811 |
| Net temporary emigrants | 19,746 | 27,654 | 18,413 |
| Net non-permanent residents | -22,196 | 10,302 | 32,738 |
|
p preliminary Note: All figures are for the one-year period ending June 30. Source: Statistics Canada, CANSIM table 051-0004. |
|||
| 2006 | 2011 | 2006 to 2011 | |
|---|---|---|---|
| number | % change | ||
| Total populationNote 1 | 31,241,030 | 33,121,175 | 6.0 |
| English | 17,882,775 | 18,858,980 | 5.5 |
| French | 6,817,655 | 7,054,975 | 3.5 |
| Chinese languagesNote 2 | 1,012,065 | 1,072,550 | 6.0 |
| Panjabi (Punjabi) | 367,505 | 430,705 | 17.2 |
| Spanish | 345,350 | 410,670 | 18.9 |
| Italian | 455,040 | 409,195 | -10.1 |
| German | 450,575 | 407,485 | -9.6 |
| Tagalog (Pilipino, Filipino) | 235,620 | 327,870 | 39.2 |
| Other languages | 3,674,445 | 4,148,745 | 12.9 |
Source: Statistics Canada, 2006 and 2011 censuses of population. |
|||
| 2003 | 2013Note p: preliminary | 2003 to 2013 | |
|---|---|---|---|
| number | % change | ||
| Total population | 31,641,630 | 35,158,304 | 11.1 |
| St. John's | 179,403 | 208,372 | 16.1 |
| Halifax | 378,005 | 408,702 | 8.1 |
| Moncton | 125,396 | 144,941 | 15.6 |
| Saint John | 125,817 | 127,883 | 1.6 |
| Saguenay | 159,864 | 160,229 | 0.2 |
| Québec | 712,571 | 791,934 | 11.1 |
| Sherbrooke | 187,810 | 210,031 | 11.8 |
| Trois-Rivières | 143,500 | 155,011 | 8.0 |
| Montréal | 3,600,252 | 3,981,802 | 10.6 |
| Ottawa–Gatineau | 1,140,080 | 1,305,210 | 14.5 |
| Kingston | 156,551 | 167,151 | 6.8 |
| Peterborough | 117,925 | 123,105 | 4.4 |
| Oshawa | 322,777 | 379,995 | 17.7 |
| Toronto | 5,084,427 | 5,959,505 | 17.2 |
| Hamilton | 703,998 | 758,073 | 7.7 |
| St. Catharines–Niagara | 397,351 | 404,971 | 1.9 |
| Kitchener–Cambridge–Waterloo | 446,842 | 504,258 | 12.8 |
| Brantford | 131,100 | 141,296 | 7.8 |
| Guelph | 133,154 | 150,305 | 12.9 |
| London | 462,738 | 498,623 | 7.8 |
| Windsor | 330,232 | 333,082 | 0.9 |
| Barrie | 167,951 | 197,821 | 17.8 |
| Greater Sudbury | 161,706 | 165,534 | 2.4 |
| Thunder Bay | 127,462 | 125,093 | -1.9 |
| Winnipeg | 704,341 | 771,221 | 9.5 |
| Regina | 198,062 | 232,090 | 17.2 |
| Saskatoon | 234,445 | 292,597 | 24.8 |
| Calgary | 1,029,552 | 1,364,827 | 32.6 |
| Edmonton | 1,000,866 | 1,289,564 | 28.8 |
| Kelowna | 158,370 | 186,345 | 17.7 |
| Abbotsford–Mission | 157,057 | 177,508 | 13.0 |
| Vancouver | 2,115,570 | 2,443,277 | 15.5 |
| Victoria | 330,844 | 357,327 | 8.0 |
|
p preliminary Note: Population estimates as of July 1. Source: Statistics Canada, CANSIM tables 051-0001 and 051-0056. |
|||
Charts


- Date modified:
