
Travel, Transport

Archived Content
Information identified as archived is provided for reference, research or recordkeeping purposes. It is not subject to the Government of Canada Web Standards and has not been altered or updated since it was archived. Please "contact us" to request a format other than those available.
Tables
- Table 33 Travellers to Canada, by country of origin, 2010
- Table 34 Travel by Canadians to foreign countries, 2010
Charts
- Chart 20 Gross domestic product (GDP), selected transportation industries
View tables
| Country of origin1 | Overnight trips | ||
|---|---|---|---|
| Trips | Nights | Spending in Canada | |
| thousands | C$ millions | ||
| United States | 11,749 | 47,247 | 6,254 |
| United Kingdom | 661 | 8,909 | 811 |
| France | 408 | 6,657 | 527 |
| Germany | 316 | 5,515 | 476 |
| Japan | 215 | 3,046 | 330 |
| Australia | 202 | 3,024 | 353 |
| Mainland China | 193 | 5,401 | 315 |
| South Korea | 157 | 4,232 | 257 |
| India | 150 | 3,250 | 145 |
| Mexico | 116 | 2,584 | 157 |
| 1. May include more than one country. | |||
| Source: Statistics Canada, Tourism and the Centre for Education Statistics. | |||
| Overnight visits | |||
|---|---|---|---|
| Visits | Nights | Spending in country | |
| thousands | C$ millions | ||
| United States | 19,964 | 160,943 | 14,730 |
| Mexico | 1,354 | 14,551 | 1,427 |
| Cuba | 1,010 | 8,410 | 748 |
| United Kingdom | 880 | 10,683 | 1,011 |
| Dominican Republic | 753 | 6,392 | 664 |
| France | 740 | 8,880 | 914 |
| Italy | 376 | 3,830 | 483 |
| Germany | 329 | 3,330 | 276 |
| Mainland China | 300 | 6,150 | 506 |
| Netherlands | 225 | 1,695 | 168 |
| Source: Statistics Canada, Tourism and the Centre for Education Statistics. | |||
View charts
Chart 20 Gross domestic product (GDP), selected transportation industries
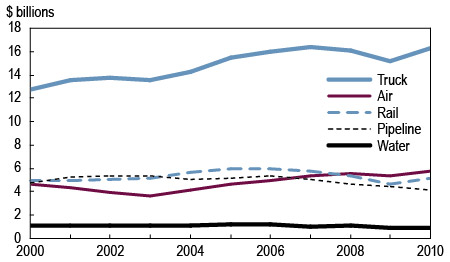
Source: Statistics Canada, CANSIM table 379-0027.
- Date modified: