Labour
Archived Content
Information identified as archived is provided for reference, research or recordkeeping purposes. It is not subject to the Government of Canada Web Standards and has not been altered or updated since it was archived. Please "contact us" to request a format other than those available.
Tables
- Table 18 Labour force characteristics, by sex
-
Table 19 Average weekly wage rate, by industry
-
Table 20 Employment, by industry
Charts
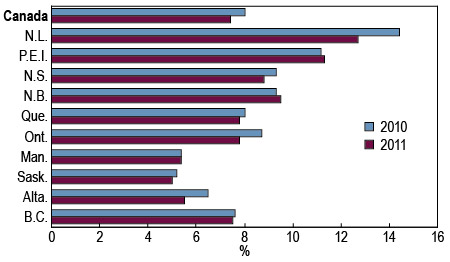
- Chart 11 Unemployment rate
View tables
| 1991 | 2001 | 2011 | |
|---|---|---|---|
| thousands | |||
| Labour force | 14,336 | 16,105 | 18,699 |
| Males | 7,925 | 8,689 | 9,859 |
| Females | 6,412 | 7,416 | 8,841 |
| Employed | 12,857 | 14,941 | 17,306 |
| Males | 7,067 | 8,035 | 9,085 |
| Females | 5,791 | 6,906 | 8,221 |
| Unemployed | 1,479 | 1,164 | 1,393 |
| Males | 858 | 654 | 774 |
| Females | 621 | 510 | 619 |
| % | |||
| Unemployment rate | 10.3 | 7.2 | 7.4 |
| Males | 10.8 | 7.5 | 7.8 |
| Females | 9.7 | 6.9 | 7.0 |
| Participation rate | 66.6 | 65.9 | 66.8 |
| Males | 75.0 | 72.3 | 71.5 |
| Females | 58.4 | 59.7 | 62.3 |
| Employment rate | 59.7 | 61.1 | 61.8 |
| Males | 66.9 | 66.8 | 65.9 |
| Females | 52.8 | 55.6 | 57.9 |
| Source: Statistics Canada, CANSIM table 282-0002. | |||
| 2001 | 2006 | 2011 | |
|---|---|---|---|
| $ current | |||
| Total employees, all industries | 635.50 | 727.59 | 840.07 |
| Goods | 738.77 | 852.32 | 985.77 |
| Agriculture | 422.64 | 495.84 | 571.29 |
| Forestry, fishing, mining, quarrying, oil and gas | 928.05 | 1,121.14 | 1,369.00 |
| Utilities | 961.50 | 1,123.60 | 1,298.12 |
| Construction | 753.74 | 852.63 | 1,005.91 |
| Manufacturing | 718.63 | 823.42 | 909.46 |
| Services | 601.16 | 689.01 | 800.51 |
| Trade | 472.41 | 532.06 | 611.43 |
| Transportation and warehousing | 708.91 | 793.52 | 897.95 |
| Finance, insurance, real estate and leasing | 703.18 | 815.67 | 934.69 |
| Professional, scientific and technical services | 835.49 | 965.57 | 1,094.25 |
| Business, building and other support services | 467.32 | 532.39 | 631.35 |
| Educational services | 734.43 | 848.23 | 982.94 |
| Health care and social assistance | 593.90 | 696.45 | 816.59 |
| Information, culture and recreation | 640.89 | 688.35 | 783.99 |
| Accommodation and food services | 302.36 | 347.11 | 396.70 |
| Public administration | 817.96 | 979.15 | 1,138.99 |
| Other services | 526.02 | 605.98 | 709.43 |
|
Notes: North American Industry Classification System (NAICS), 2007. Data include overtime. |
|||
| Source: Statistics Canada, CANSIM table 282-0072. | |||
| 2001 | 2006 | 2011 | |
|---|---|---|---|
| thousands | |||
| All industries | 14,940.9 | 16,410.2 | 17,306.2 |
| Goods | 3,772.0 | 3,975.9 | 3,804.9 |
| Agriculture | 322.4 | 346.9 | 305.6 |
| Forestry, fishing, mining, quarrying, oil and gas | 277.6 | 334.1 | 337.2 |
| Utilities | 122.9 | 121.3 | 139.8 |
| Construction | 819.5 | 1,066.4 | 1,262.2 |
| Manufacturing | 2,229.7 | 2,107.2 | 1,760.2 |
| Services | 11,168.9 | 12,434.3 | 13,501.3 |
| Trade | 2,368.1 | 2,616.4 | 2,669.9 |
| Transportation and warehousing | 776.8 | 794.8 | 843.4 |
| Finance, insurance, real estate and leasing | 874.8 | 1,032.9 | 1,083.4 |
| Professional, scientific and technical services | 987.7 | 1,082.1 | 1,309.2 |
| Business, building and other support services | 532.8 | 683.3 | 677.0 |
| Educational services | 974.4 | 1,154.7 | 1,219.4 |
| Health care and social assistance | 1,545.3 | 1,779.0 | 2,091.5 |
| Information, culture and recreation | 709.3 | 742.3 | 784.2 |
| Accommodation and food services | 949.2 | 1,013.9 | 1,093.4 |
| Public administration | 786.4 | 834.0 | 971.2 |
| Other services | 664.0 | 701.1 | 758.7 |
| Note: North American Industry Classification System (NAICS), 2007. | |||
| Source: Statistics Canada, CANSIM table 282-0008. | |||
View charts
Chart 11 Unemployment rate

Source: Statistics Canada, CANSIM table 282-0002.
- Date modified:
