
Diversity among board directors and officers

Archived Content
Information identified as archived is provided for reference, research or recordkeeping purposes. It is not subject to the Government of Canada Web Standards and has not been altered or updated since it was archived. Please "contact us" to request a format other than those available.
Description: Diversity among board directors and officers
Diversity among board directors and officers
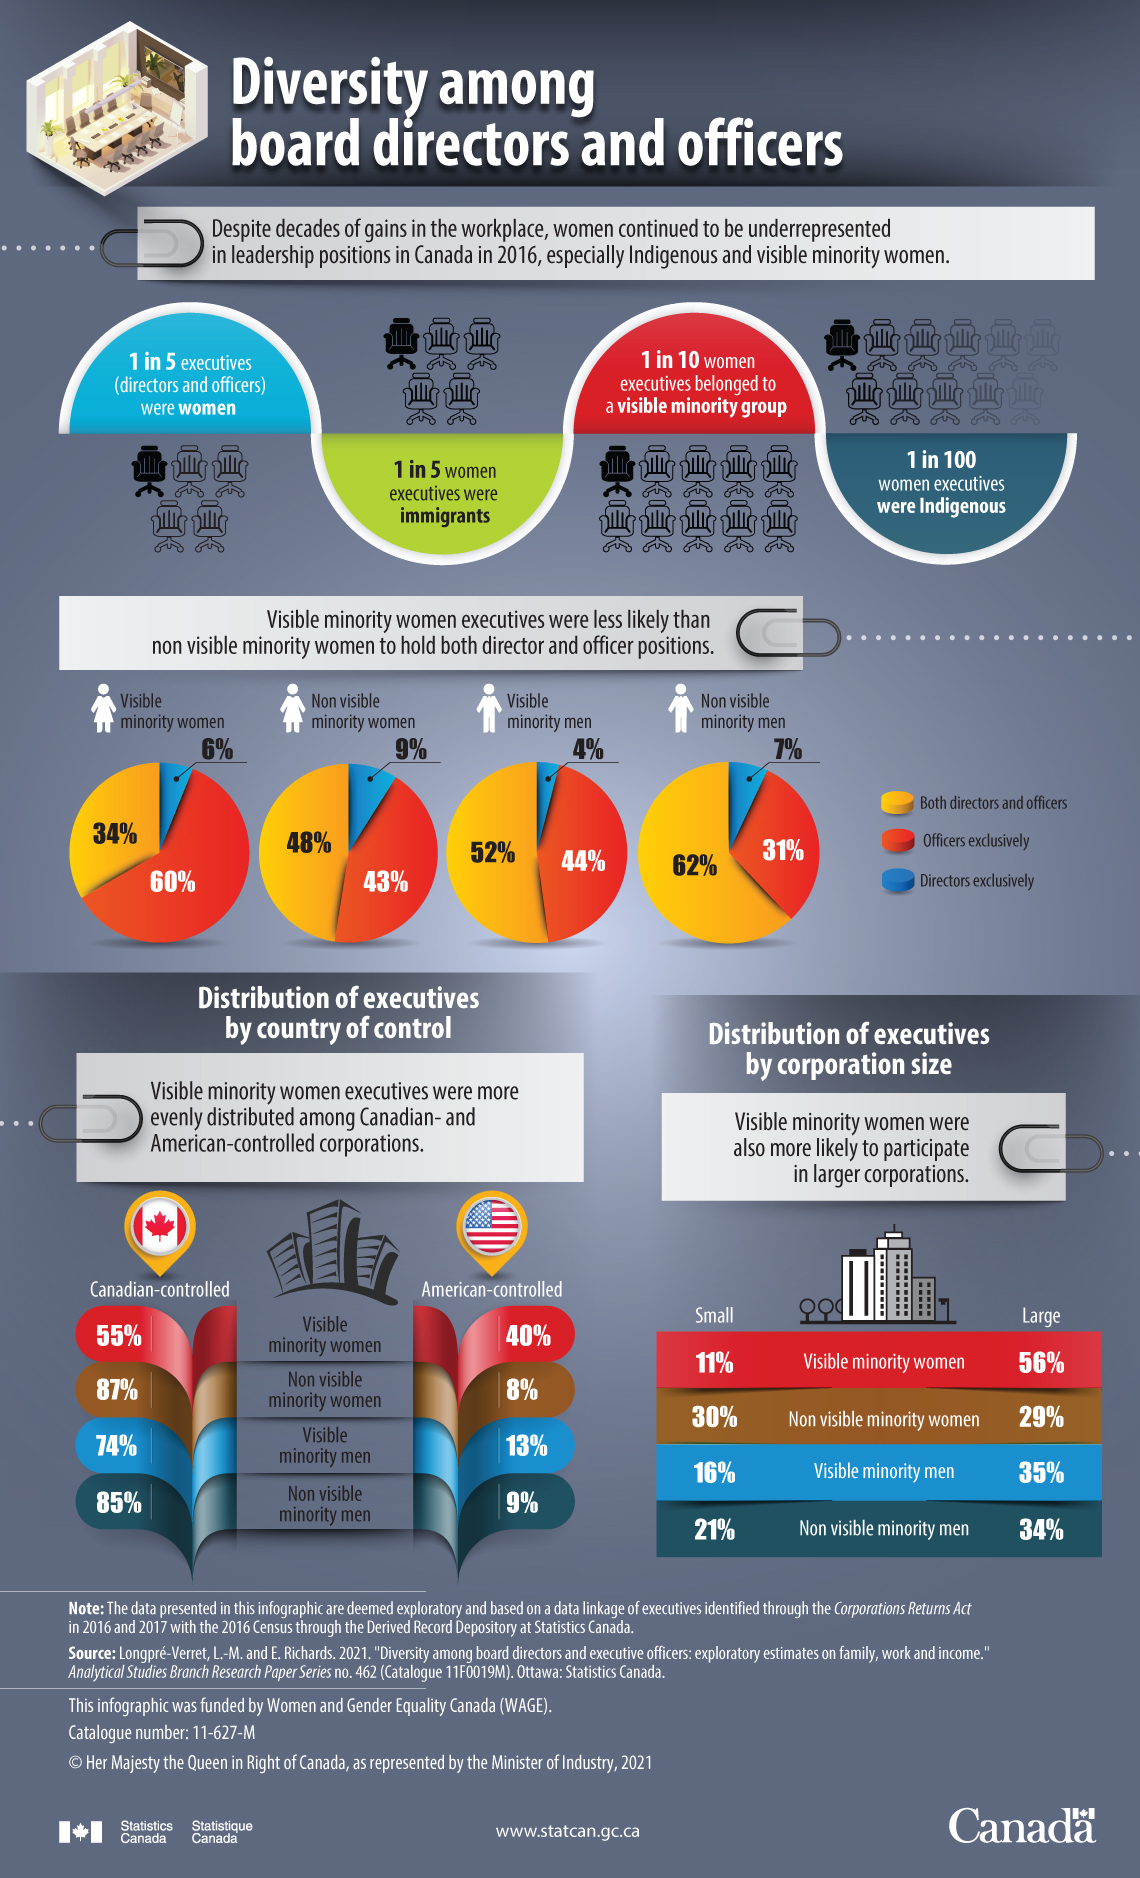
Despite decades of gains in the workplace, women continued to be underrepresented in leadership positions in Canada in 2016, especially Indigenous and visible minority women.
- 1 in 5 executives (directors and officers) were women
- 1 in 5 women executives were immigrants
- 1 in 10 women executives belonged to a visible minority group
- 1 in 100 women executives were Indigenous
| Visible minority women | Non visible minority women | Visible minority men | Non visible minority men | |
|---|---|---|---|---|
| percent | ||||
| Directors exclusively | 6 | 9 | 4 | 7 |
| Officers exclusively | 60 | 43 | 44 | 31 |
| Both directors and officers | 34 | 48 | 52 | 62 |
Distribution of executives by country of control
Visible minority women executives were more evenly distributed among Canadian- and American-controlled corporations.
| Visible minority women | Non visible minority women | Visible minority men | Non visible minority men | |
|---|---|---|---|---|
| percent | ||||
| Canadian-controlled | 55 | 87 | 74 | 85 |
| American-controlled | 40 | 8 | 13 | 9 |
Distribution of executives by corporation size
Visible minority women were also more likely to participate in larger corporations.
| Visible minority women | Non visible minority women | Visible minority men | Non visible minority men | |
|---|---|---|---|---|
| percent | ||||
| Small | 11 | 30 | 16 | 21 |
| Large | 56 | 29 | 35 | 34 |
This infographic was funded by Women and Gender Equality Canada (WAGE).
Note: The data presented in this infographic are deemed exploratory and based on a data linkage of executives identified through the Corporations Returns Act in 2016 and 2017 with the 2016 Census through the Derived Record Depository at Statistics Canada.
Source: Longpré-Verret, L.-M. and E. Richards. 2021. “Diversity among board directors and executive officers: exploratory estimates on family, work and income.” Analytical Studies Branch Research Paper Series no. 462 (Catalogue 11F0019M). Ottawa: Statistics Canada.
- Date modified: