
Analytical Studies Branch Research Paper Series
The Wealth of Unattached Men and Women Aged 50 and Older, 1999 to 2016

Archived Content
Information identified as archived is provided for reference, research or recordkeeping purposes. It is not subject to the Government of Canada Web Standards and has not been altered or updated since it was archived. Please "contact us" to request a format other than those available.
Skip to text
Text begins
Acknowledgements
The author wishes to thank Cilanne Boulet, from the Social Statistics Methods Division of Statistics Canada, and John Nicoletta, from the Centre for Income and Socioeconomic Well-being Statistics of Statistics Canada, for useful discussions on the Survey of Financial Security. This study is funded by the Department for Women and Gender Equality.
Abstract
Using data from the Survey of Financial Security of 1999, 2005, 2012 and 2016, this study assesses how the wealth holdings of unattached men and women aged 50 and older evolved from 1999 to 2016. Overall, the study paints a reasonably positive picture of the economic situation of unattached women relative to that of unattached men, while highlighting the fact that both unattached men and unattached women are, in general, more economically vulnerable to income shocks and unexpected expenditures than couples of a similar age with no children at home.
Keywords: wealth; assets; indebtedness; financial vulnerability.
Executive summary
The evolution of the wealth, assets and debts of various groups of Canadians since the late 1990s has been documented in several studies. Yet little is known about the evolution of the wealth holdings of unattached men and women aged 50 and older, who make up a large part of the population. Using data from the Survey of Financial Security of 1999, 2005, 2012 and 2016, this study fills this information gap.
The wealth concept used in this study captures all assets and debts of unattached men and women. Total assets include financial assets (for example, bank accounts, annuities, inheritances, registered retirement savings plans [RRSPs], registered retirement income funds [RRIFs] and registered pension plan [RPP] assets) and physical assets (for example, cars, a principal residence, collectibles and valuables, and the contents of the home). Total debts include all types of liabilities (for example, mortgage debt, student debt, debt on car loans and debt on credit cards). However, entitlements to future Canada or Quebec Pension Plan or Old Age Security benefits and measures of the discounted flow of future earnings by family members are excluded.
The study uncovers several key patterns:
- From 1999 to 2016, median wealth grew faster among unattached women aged 50 and older than among unattached men aged 50 and older.
- Combined with the fact that the median wealth of unattached women aged 50 and older was slightly higher than that of their male counterparts in 1999, this stronger growth led unattached women aged 50 and older to have substantially higher median wealth than unattached men aged 50 and older in 2016.
- The faster growth in the median wealth of unattached women is observed among unattached seniors (i.e., those aged 65 and older) but not among younger unattached individuals (i.e., those aged 50 to 64).
- Unattached female seniors experienced stronger wealth growth than their male counterparts during the 1999-to-2016 period largely because they increased their housing wealth and RPP assets at a faster pace. The same conclusion applies when all unattached men and women aged 50 and older are considered.
- In 2016, unattached women aged 50 and older were more likely to be homeowners and to have RPP assets than unattached men aged 50 and older. This gender difference is also observed among unattached individuals aged 50 to 64. No sizable gender difference is observed for these two dimensions for unattached seniors.
- Among homeowners, median net equity in the principal residence in 2016 was higher for unattached women aged 50 and older than it was for unattached men aged 50 and older.
- Regardless of age, unattached men and women had similar debt-to-income ratios in 2016. Their propensity to have mortgage payments was also similar.
- Compared with their counterparts aged 65 and older, unattached men and women aged 50 to 64 (a) had higher debt-to-income ratios; (b) were less likely to pay the full amount on their credit card balances each month; (c) were more likely to withdraw money from RRSPs for reasons other than to purchase an annuity or an RRIF, to use the Home Buyers’ Plan, or to use the Lifelong Learning Plan; (d) were more likely to live with low income; and (e) were more likely to have no financial wealth. However, on several of these dimensions, no sizable sex difference is observed.
- In 2016, about 5% of younger unattached men and women lived with low income and had no financial wealth. This group is particularly vulnerable to negative income shocks and unexpected expenditures.
- Regardless of the age and year considered, unattached women had substantially smaller wealth holdings than couples with no children at home and whose major income earner was a woman of a similar age. The same is observed for unattached men, compared with couples with no children at home whose major income earner was a man of a similar age.
- Regardless of the age and sex of the major income earner, the incidence of low income in 2016 was at least five times lower among couples with no children at home whose major income earner was aged 50 or older than among unattached individuals aged 50 and older.
- In 2016, relative to their male counterparts, unattached women aged 50 and older held a greater share of their wealth in the form of a principal residence, but a lower share in the form of other residences and business equity.
Overall, the findings paint a reasonably positive picture of the economic situation of unattached women relative to that of unattached men, while highlighting the fact that both unattached men and unattached women are, in general, more economically vulnerable to income shocks and unexpected expenditures than couples of a similar age.
1 Introduction
The evolution of the wealth, assets and debts of various groups of Canadians since the late 1990s has been documented in several studies (Uppal and Larochelle-Côté 2015a, 2015b; Messacar and Morissette 2015; Uppal 2019a, 2019b; Heisz and Richards 2019; Gellatly and Richards 2019; Morissette 2019a, 2019b). Yet little is known about the evolution of the wealth holdings of unattached men and women aged 50 and older, who make up a large part of the population.
In 2016, there were 3.0 million unattached men and women aged 50 and older in Canada.Note In that year, about 4.8 million economic familiesNote were headed by a person aged 50 or older. Hence, whether their absolute numbers are considered or whether they are compared with the major income earners of economic families, unattached men and women aged 50 and older represent a sizable segment of Canada’s population.
Documenting how the wealth holdings of unattached men and women aged 50 and older have evolved since the late 1990s is important for a variety of reasons. Like most Canadians, unattached individuals have likely experienced an increase in life expectancy over the past few decades. Yet unlike their counterparts who are married or in common-law relationships, unattached individuals cannot rely on a second earner to help them save for retirement. Since the likelihood of subsequently forming couples falls with age (Bumpass et al. 1990), this implies that unattached men and women aged 50 and older are more likely than other Canadians to rely on their own efforts when preparing for retirement. In light of the overall downward pressure on registered pension plan (RPP) coverage, some unattached individuals might be at risk of being ill-prepared for retirement.
The challenges related to saving for retirement might also differ for unattached men and women. If unattached women generally have lower lifetime earnings than unattached men but similar savings rates, their resulting retirement savings will be more limited than those of their male counterparts. In addition, a given amount of retirement savings might subsequently yield lower financial wealth if the lower financial literacy of women—documented by Drolet (2016)—leads them to earn lower rates of return on their financial investments. Since women have a higher life expectancy than men, the resulting difference in financial wealth, if any, might lead to lower economic well-being during retirement years for unattached women. Conversely, if RPP coverage is higher among unattached women than among unattached men—as is the case in the aggregateNote —their RPP assets might be greater than those of their male counterparts.
In sum, even though unattached men and women aged 50 and older make up a sizable segment of the Canadian population, many questions about their wealth holdings remain unanswered.
The goal of this study is to fill this information gap. Using various waves of the Survey of Financial Security (SFS), the study analyzes the evolution of the wealth holdings of unattached men and women aged 50 and older from 1999 to 2016. Wealth is defined as total assets minus total debts. Total assets include financial assets (for example, bank accounts, registered retirement savings plans [RRSPs] and RPP assets) and physical assets (for example, cars, a principal residence and the contents of the home). Total debts include all types of liabilities (for example, mortgage debt, student debt and debt on car loans).
The wealth holdings of unattached men and women aged 50 and older may have evolved differently for a variety of reasons. Contrary to men, women have increased their labour force participation and their long-term earnings over the past four decades (Fortin 2019), thereby improving their ability to save and accumulate wealth. They have also moved towards better paid occupations and have increased their presence in the public sector, where most jobs are covered by RPPs.Note These changes are likely to have increased their pension plan assets, as well as their ability to accumulate other types of savings. In contrast, unionization rates of men have dropped sharply, thereby putting downward pressure on their RPP coverage.Note For these reasons, the wealth holdings and pension plan assets—an important wealth component—of unattached women may have increased at a faster pace than those of unattached men.
This study seeks to answer the following questions:
- From 1999 to 2016, did unattached women aged 50 and older experience faster wealth growth than their male counterparts?
- Did the wealth of unattached men and women aged 50 and older grow at a similar pace, compared with couples with no children at home and whose major income earner was aged 50 or older?
- Which assets account for most of the changes in the wealth holdings of unattached women during the 1999-to-2016 period? Are these assets the same as those that account for most of the changes in the wealth holdings of unattached men?
- How do the rates of homeownership of unattached women compare with those of unattached men?
- How does the proportion of unattached women with RPP assets compare with that of unattached men?
- Which groups of unattached men and women, if any, are relatively vulnerable to financial shocks? Has vulnerability to these shocks increased or fallen over time?
- How do indebtedness ratios and specific behaviours related to financial management (e.g., using payday loans, withdrawing money from RRSPs or paying off credit card balances) compare between unattached men and unattached women?
The study assembles data from the SFS of 1999, 2005, 2012 and 2016 to answer these questions. Since the SFS contains information about age, sex and family type for each of these four years, it allows wealth comparisons for unattached men and women aged 50 and older over the 1999-to-2016 period.Note
However, the SFS has a few limitations. It cannot provide wealth information over the 1999-to-2016 period by diversity factors such as race, Indigenous status, activity limitations or LGBTQ2+ status (lesbian, gay, bisexual, transgender, queer [or sometimes questioning] and two-spirit). The reason is that such information either has been collected in only some of the four aforementioned years or has not been collected to date.Note As a result, the study cannot disaggregate results on the basis of these four diversity factors.Note
The paper is organized as follows. Section 2 presents the data and concepts used in the study. Section 3 documents wealth trends for various groups of unattached individuals from 1999 to 2016. Section 4 examines how rates of homeownership and the incidence of RPP asset holdings have evolved for various groups over the last few years. It also quantifies the degree to which these two types of assets account for the wealth changes observed from 1999 to 2016. Section 5 presents statistics on indebtedness ratios and on different behaviours associated with financial management. These behaviours include whether unattached individuals used payday loans in the last three years, whether they ever withdrew money from RRSPs and whether credit card holders usually pay off credit card balances each month. Section 5 also assesses the percentage of unattached individuals who live with low income and have no financial wealth.Note Section 6 shows the degree to which the wealth composition of unattached women aged 50 and older differed from that of their male counterparts in 2016. Section 7 summarizes the main findings.
2 Data and concepts
This study uses data from the SFS of 1999, 2005, 2012 and 2016. Samples for all surveys represent all economic families and people not in an economic family in Canada, except residents of the territories, households on Indian reserves, full-time members of the Armed Forces and residents of institutions.Note In the case of economic families, data are obtained for all members of a family aged 15 and older (see Appendix 1 for details).Note
The wealth concept used in the SFS captures all assets and debts of an economic family or unattached individual. Total assets include financial assets (for example, bank accounts, annuities, inheritances, RRSPs, registered retirement income funds [RRIFs] and RPP assets) and physical assets (for example, cars, a principal residence, collectibles and valuables, and the contents of the home). Total debts include all types of liabilities (for example, mortgage debt, student debt, debt on car loans and debt on credit cards). However, entitlements to future Canada or Quebec Pension Plan or Old Age Security benefits and measures of the discounted flow of future earnings by family members are excluded.
In addition to wealth information collected at the economic family level or at the unattached individual level, the SFS captures the socioeconomic characteristics of the major income earner. These include, among others, age, sex, education, immigration status and the numbers of years in Canada since landing. All surveys also measure family income after tax during the year preceding data collection (for example, in 1998 for the 1999 SFS). This allows for an assessment of the degree to which individuals (a) are in low-income families, (b) have no financial wealth, or (c) are in low-income families with no financial wealth. Arguably, these families are more economically vulnerable than other families.
The focus of the study is on unattached individuals—people who are not in an economic family—aged 50 and older. This includes individuals who live alone or only with other unrelated individuals. As will be shown below, most unattached people aged 50 and older previously had a spouse or partner. In other words, most of them are widowed, separated or divorced. To provide context, the study sometimes compares statistics on unattached individuals aged 50 and older with those on couples with no children at home and whose major income earner is aged 50 or older.Note
Throughout the study, wealth and income data are converted to 2016 dollars using the Canada-level all-items Consumer Price Index. The terms “wealth” and “net worth” are used interchangeably. Because wealth is a variable that has a relatively high dispersion, average wealth is often not representative of the “typical” wealth of individuals or families in a given group. For this reason, most of the discussion will focus—unless otherwise noted—on median wealth.Note The term “unattached seniors” is used to refer to unattached individuals aged 65 and older, while the term “younger unattached individuals” refers to unattached individuals aged 50 to 64. To avoid repetitiveness, the term “unattached men and women” is often used to refer to unattached men and women aged 50 and older.
3 Wealth trends
3.1 Three million men and women aged 50 and older were unattached in 2016 unattached in 2016
First, the size of various groups of unattached individuals is assessed, and information on some potentially important drivers of wealth accumulation is provided.
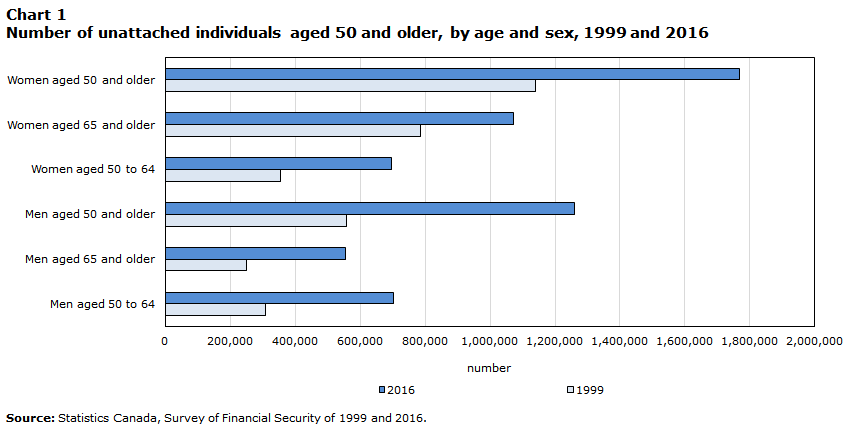
Chart 1 shows that about 1.07 million women aged 65 and older were unattached in 2016, up from roughly 785,000 in 1999. Close to 700,000 women aged 50 to 64 were unattached in 2016, compared with 356,000 in 1999. Therefore, there were about 1.77 million unattached women aged 50 and older in 2016, up from about 1.14 million in 1999. In contrast, there were about 1.26 million unattached men aged 50 and older in 2016, more than twice the 1999 estimate of roughly 560,000. As a result, 3.03 million men and women aged 50 and older were unattached in 2016. This number represents a sizable share of the Canadian population.Note
3.2 Growing labour force participation and educational attainment likely fostered wealth accumulation among unattached women
To understand how the wealth holdings of unattached individuals aged 50 and older evolved from 1999 to 2016, it is important to identify some factors that may have fostered or hindered wealth accumulation during this period.
Data table for Chart 1
| 1999 | 2016 | |
|---|---|---|
| number | ||
| Women aged 50 and older | 1,140,636 | 1,768,945 |
| Women aged 65 and older | 784,588 | 1,071,453 |
| Women aged 50 to 64 | 356,048 | 697,492 |
| Men aged 50 and older | 559,125 | 1,259,317 |
| Men aged 65 and older | 249,966 | 555,839 |
| Men aged 50 to 64 | 309,159 | 703,478 |
| Source: Statistics Canada, Survey of Financial Security of 1999 and 2016. | ||
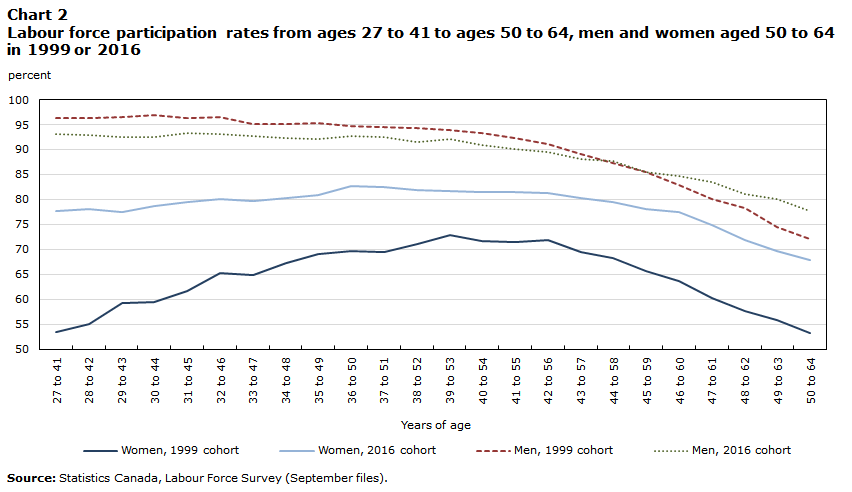
The growing labour force participation of women is one of these factors. Chart 2 shows that women who were aged 50 to 64 in 2016 had, during their lifetime, substantially higher labour force participation rates than women who were aged 50 to 64 in 1999.Note In contrast, no similar increase is observed for men. Under the plausible assumption that the growth in labour force participation observed for women aged 50 to 64 from 1999 to 2016 also applies to women who were unattached in 1999 or 2016, this trend will tend to increase the lifetime earnings of unattached women. Such increases in lifetime earnings will, all else being equal, increase the ability of unattached women to save and accumulate wealth. For this reason, larger wealth holdings can be expected for unattached women who were aged 50 to 64 in 2016 than for their counterparts aged 50 to 64 in 1999.
Data table for Chart 2
| Years of age | Women, 1999 cohort | Women, 2016 cohort | Men, 1999 cohort | Men, 2016 cohort |
|---|---|---|---|---|
| percent | ||||
| 27 to 41 | 53.4 | 77.7 | 96.4 | 93.2 |
| 28 to 42 | 55.0 | 78.0 | 96.4 | 93.0 |
| 29 to 43 | 59.3 | 77.5 | 96.5 | 92.5 |
| 30 to 44 | 59.5 | 78.7 | 97.0 | 92.5 |
| 31 to 45 | 61.6 | 79.5 | 96.3 | 93.3 |
| 32 to 46 | 65.2 | 80.0 | 96.6 | 93.1 |
| 33 to 47 | 64.9 | 79.7 | 95.0 | 92.7 |
| 34 to 48 | 67.2 | 80.2 | 95.1 | 92.3 |
| 35 to 49 | 69.0 | 81.0 | 95.3 | 92.2 |
| 36 to 50 | 69.7 | 82.6 | 94.7 | 92.6 |
| 37 to 51 | 69.4 | 82.5 | 94.5 | 92.5 |
| 38 to 52 | 71.1 | 81.8 | 94.3 | 91.5 |
| 39 to 53 | 72.9 | 81.7 | 93.9 | 92.0 |
| 40 to 54 | 71.7 | 81.5 | 93.4 | 90.9 |
| 41 to 55 | 71.5 | 81.6 | 92.4 | 90.1 |
| 42 to 56 | 71.8 | 81.3 | 91.1 | 89.5 |
| 43 to 57 | 69.4 | 80.3 | 89.1 | 88.2 |
| 44 to 58 | 68.2 | 79.5 | 87.2 | 87.7 |
| 45 to 59 | 65.6 | 78.0 | 85.6 | 85.6 |
| 46 to 60 | 63.6 | 77.4 | 82.8 | 84.7 |
| 47 to 61 | 60.3 | 74.9 | 80.1 | 83.4 |
| 48 to 62 | 57.6 | 71.8 | 78.2 | 81.1 |
| 49 to 63 | 55.8 | 69.6 | 74.5 | 80.1 |
| 50 to 64 | 53.1 | 67.8 | 72.0 | 77.7 |
| Source: Statistics Canada, Labour Force Survey (September files). | ||||
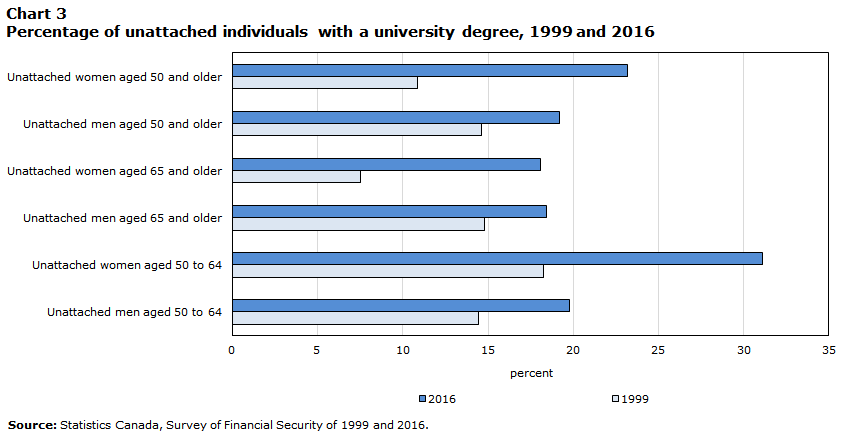
The growing educational attainment of younger unattached women is another reason why their wealth holdings could be expected to grow from 1999 to 2016. As Chart 3 shows, the share of younger unattached women with a university degree increased from 18% in 1999 to 31% in 2016. The corresponding percentages were 15% and 20% for younger unattached men. Since higher education is generally associated with higher lifetime earnings (Frenette 2014), the sharp growth in the educational attainment of younger unattached women is expected to foster wealth accumulation among this group.Note
Data table for Chart 3
| 1999 | 2016 | |
|---|---|---|
| percent | ||
| Unattached women aged 50 and older | 10.8 | 23.2 |
| Unattached men aged 50 and older | 14.6 | 19.2 |
| Unattached women aged 65 and older | 7.5 | 18.0 |
| Unattached men aged 65 and older | 14.8 | 18.4 |
| Unattached women aged 50 to 64 | 18.2 | 31.1 |
| Unattached men aged 50 to 64 | 14.5 | 19.8 |
| Source: Statistics Canada, Survey of Financial Security of 1999 and 2016. | ||
Family history may also play a role. Since the late 1990s, proportionately fewer unattached men and women aged 50 and older had been married or in a common-law relationship earlier in their life. In 2016, 75% of unattached women aged 50 and older had previously had a partner (i.e., were widowed, separated or divorced), down from 88% in 1999 (Chart 4). The corresponding percentages for unattached men aged 50 and older are 59% and 73%. While increases in the labour force participation and educational attainment of a given group are expected to lead to greater wealth holdings for this group, it is unclear whether having had a partner in the past would tend to decrease or increase wealth holdings.Note Nevertheless, it is worth noting that, for every year considered, proportionately fewer unattached men aged 50 and older had had a partner in the past, relative to their female counterparts.Note

Data table for Chart 4
| Unattached men | Unattached women | |
|---|---|---|
| percent | ||
| 1999 | 73.0 | 88.3 |
| 2005 | 69.0 | 85.1 |
| 2012 | 60.8 | 83.0 |
| 2016 | 59.4 | 75.1 |
| Source: Statistics Canada, Survey of Financial Security. | ||
3.3 Unattached women had higher median wealth than unattached men in 2016
Table 1 shows the wealth holdings of unattached men and women from 1999 to 2016. The numbers are presented for unattached men and women aged 50 and older, as well as for those aged 50 to 64 (younger unattached individuals) and those aged 65 and older (unattached seniors).Note
In 2016, unattached women had higher median wealth than unattached men. The median net worth of unattached women aged 50 and older amounted to roughly $266,100, compared with $195,000 for unattached men aged 50 and older.Note The median wealth of younger unattached women was, at $222,100, almost twice as high as the median wealth of younger unattached men ($129,800).Note The median wealth of unattached women aged 65 and older was somewhat higher than that of their male counterparts, but the difference is not statistically significant at conventional levels.
The higher median net worth of unattached women aged 50 and older was the result of the stronger wealth growth they experienced from 1999 to 2016. During that period, the median wealth of unattached women grew by 91%, compared with 48% for their male counterparts (Table 1).Note In 1999, unattached men and women had fairly similar median wealth.
Consistent with the aforementioned expectations regarding the effect of women’s growing labour force participation and educational attainment on wealth accumulation, median wealth grew substantially—by 95%—both for unattached women aged 50 to 64 and for those aged 65 and older.Note In contrast, median wealth grew little among unattached men aged 65 and older.
Even though labour force participation and educational attainment grew more among unattached women aged 50 to 64 than among unattached men aged 50 to 64, median wealth appears to have grown at a slower pace among the former group than among the latter from 1999 to 2016 (Table 1). Specifically, SFS estimates suggest that median wealth grew by 95% among unattached women aged 50 to 64, compared with 132% for unattached men aged 50 to 64. This finding highlights the fact that a myriad of factors other than labour force participation and educational attainment (e.g., inheritances, regional differences in the growth of home prices, and differences in savings rates and in rates of return on savings) may affect wealth accumulation.
Table 1 also shows that regardless of the age group and year considered, unattached women had substantially smaller wealth holdings than couples with no children at home and whose major income earner was a woman of a similar age. The same is observed for unattached men, compared with couples with no children at home whose major income earner was a man of a similar age. For example, the median wealth of couples with no children at home and whose major income earner was a man aged 50 or older amounted to $801,500 in 2016, four times the median wealth of $195,000 observed for unattached men aged 50 and older.
Comparing wealth growth rates across family types indicates that the median wealth of unattached women aged 50 and older grew at a somewhat slower pace (91%) than the median wealth of couples with no children at home and whose major income earner was a woman aged 50 or older (113%). A similar pattern is observed for unattached men aged 50 and older.
To better understand the driving forces underlying these trends, the evolution of two key wealth components—housing wealth and RPP assets—is examined. Housing wealth and RPP assets are potentially key drivers of wealth growth since, as will be shown below, they accounted for more than 60% of the average wealth of unattached men and women aged 50 and older in 2016.
4 Homeownership and registered pension plan assets
From the late 1990s to 2016, real interest rates (including those for mortgages) and rates of return on financial markets fell. While home prices increased during that period, the drop in real interest rates may have induced some unattached individuals to become homeowners. Hence, rates of homeownership might have increased for some groups of unattached individuals since 1999.
4.1 Rates of homeownership were higher among unattached women aged 50 and older than among their male counterparts
Table 3 shows that this was the case for younger unattached individuals. The percentage of homeowners among unattached women aged 50 to 64 grew from 46% in 1999 to 55% in 2016. The corresponding percentages for younger unattached men are 37% and 45%, respectively. As a result, younger unattached women were more likely than younger unattached men to be homeowners in 2016. In contrast, rates of homeownership were fairly similar in 1999 and 2016 for both unattached men and unattached women aged 65 and older. The end result is that rates of homeownership were higher in 2016 among unattached women aged 50 and older than among their male counterparts.Note
The increase in home prices that has taken place since the late 1990s benefited homeowners. Regardless of age and sex, unattached individuals who were homeowners saw the median value of their principal residence increase by between 74% and 110% from 1999 to 2016. As a result, the median value of their housing equity—housing assets minus mortgage debt—grew substantially during that period. It rose faster among unattached female seniors (91%) than among their male counterparts (66%), thereby suggesting that differential growth rates in housing equity may explain partly why the median net worth of unattached female seniors increased faster than that of unattached male seniors.
4.2 Growth rates in the median value of registered pension plan assets were higher among unattached women aged 50 and older than among unattached men aged 50 and older
The drop in real interest rates observed from 1999 to 2016 also led to an increase in the (discounted) value of defined-benefit RPPs, which make up the majority of RPPs.Note As a result, unattached individuals who (a) are retired and hold defined-benefit RPPs, (b) are currently employed in a job that has such an RPP, or (c) are currently in the labour market and previously had a job with such an RPP will experience an increase in the value of their pension plans.
Table 4 confirms that this was the case, especially for unattached women. All groups of unattached women who had RPP assets experienced a significant increase in the median value of these assets. For example, the median value of the RPP assets of unattached women aged 50 and older increased by 63% from 1999 to 2016. The corresponding increase for unattached men aged 50 and older is 33%.
The median value of RPP assets more than doubled among younger unattached women, and it grew by 52% among unattached female seniors. Growth rates were lower among unattached men, especially those aged 55 to 64. Therefore, differential growth rates in the value of RPP assets may also have contributed to increasing the median net worth of unattached female seniors faster than that of their male counterparts.
Differential trends in RPP coverage also appear to have played a role. While the percentage of unattached female seniors with RPP assets grew from 37% in 1999 to 45% in 2016, the percentage of unattached male seniors with RPP assets was roughly 45% in both years.
The incidence of RPP asset holdings increased by 8 percentage points among younger unattached women during this period, while the corresponding increase amounted to 6 percentage points among younger unattached men. By 2016, 47% of younger unattached women had RPP assets, compared with 38% of their male counterparts.
Taken together, the numbers shown in tables 3 and 4 provide suggestive evidence that, from 1999 to 2016, the faster growth in RPP coverage, in housing wealth and in the value of work-related pension plans among unattached female seniors contributed to the faster growth in their median net worth, relative to unattached male seniors. However, because median statistics are not additive, it is difficult to quantify the contribution of these factors. To do so, the analysis now focuses on the changes in average wealth observed during that period. Since average wealth for a given group is the sum of average assets minus the sum of average debts, it is possible to decompose the sources of increases in average wealth over a given period. This in turn allows for the contribution of each wealth component to the growth rate in average wealth observed over a given period to be quantified.
The starting point is that the average wealth of unattached female seniors grew by 81% from 1999 to 2016, twice the rate of 39% observed for unattached male seniors (Table 1).Note What explains this difference of roughly 40 percentage points?
4.3 Faster growth in housing wealth and in registered pension plan assets underlay much of the faster growth in average wealth among unattached women aged 65 and older
The sixth column of Table 6 answers this question. It indicates that faster growth in average housing wealth—including the principal residence and other residences—and in average RPP assets accounts for roughly three-fifths of this difference.Note The corresponding combined contribution of housing wealth and RPP assets rises to about two-thirds of the growth rate difference between male and female seniors when unattached individuals in the top 1% of the wealth distribution are excluded (Table 6). Therefore, Table 6 indicates that most of the faster growth in the average net worth of unattached female seniors, relative to unattached male seniors, can be explained by the faster growth in RPP coverage, in average housing wealth and in the average value of work-related pension plans observed for unattached female seniors. The same conclusion holds when all unattached men and women aged 50 and older are considered (Table 5, third column).
The first and second panels of Table 6 show the importance of testing the robustness of results to alternative sample selection schemes. When all younger unattached individuals are considered, the average wealth of younger unattached men grew 27 percentage points faster than that of their female counterparts. However, when individuals in the top 1% of the wealth distribution are excluded, the growth rate difference drops to 14 percentage points.
In sum, the key message that emerges from this analysis is that unattached female seniors experienced stronger wealth growth than their male counterparts during the 1999-to-2016 period largely because they increased their housing wealth and RPP assets at a faster pace. The same conclusion applies when all unattached men and women aged 50 and older are considered.
5 Indebtedness and vulnerability to financial shocks
Following the 2008/2009 recession, concerns about the vulnerability of some Canadian households to increases in mortgage interest rates went up. In this context, it is worthwhile to assess the evolution of debt-to-income ratios and debt-to-asset ratios over the 1999-to-2016 period.
5.1 Debt-to-income ratios were higher among younger unattached men and women than among their counterparts aged 65 and older
This is done in Table 7. The numbers indicate that, within each age group, unattached men and women had fairly similar debt-to-income ratios in 2016. For example, the group-level debt-to-income ratio of unattached men and women aged 50 to 64 was 1.65.Note As expected, the group-level debt-to-income ratios of unattached seniors were substantially lower. The numbers also show that, regardless of age, the group-level debt-to-income ratios of unattached men and women increased substantially from 1999 to 2016. In contrast, the debt-to-asset ratios increased only slightly, thereby suggesting that most of the growth in the debt-to-income ratios originated from increases in mortgage debt.
5.2 The incidence of mortgage payments was higher among younger unattached men and women than among their counterparts aged 65 and older
Table 8 shows that, in 2016, about one-quarter of younger unattached men and women—those aged 50 to 64—had mortgage payments, up from a range of 14% to 17% in 1999. In contrast, less than 10% of unattached male and female seniors had mortgage payments in 2016, although the incidence of mortgage payments also increased for this group over the 1999-to-2016 period. Among the subset of unattached individuals who had mortgage payments in 2016, the ratio of average annualized mortgage payments to average income after tax amounted to roughly 0.36 for unattached men and women. This indicates that, collectively, these groups used roughly 36 cents for mortgage payments from every dollar of after-tax income they received.Note
5.3 Proportionately fewer younger unattached men and women fully paid their credit card balances each month
Table 9 investigates the use of payday loans and credit cards. In 2016, at most 4% of unattached men and women reported having used payday loans in the past three years. Likewise, very few—at most 7%—unattached men and women reported having no credit cards in 2016 because their request for a credit card had been refused. The third panel of Table 9 shows that, in 2016, proportionately fewer younger unattached men and women (about 58%) tended to pay the full amount on their credit card balances each month, compared with their counterparts aged 65 and older (about 80%). For each of these three dimensions—using payday loans, being refused for a credit card and paying off credit card balances each month—no sizable gender difference is observed within age groups in 2016.
5.4 Younger unattached men and women were more likely to withdraw money from registered retirement savings plans than their counterparts aged 65 and older
Table 10 analyzes RRSP withdrawals. The second panel shows that regardless of the year considered, younger unattached RRSP holders tended to withdraw money from RRSPs for “other” reasons more often than senior unattached RRSP holders. “Other” reasons are reasons other than (a) to purchase an annuity or an RRIF, (b) to use the Home Buyers’ Plan, or (c) to use the Lifelong Learning Plan. For example, 39% of younger unattached women reported in 2016 having withdrawn money from RRSPs for such reasons in the past, compared with 24% of unattached female seniors. Except for 2016, there is little evidence that unattached women tended to withdraw money from RRSPs for such reasons to a lesser extent than unattached men.
5.5 Younger unattached men and women were more likely to live with low income or to have no financial wealth than their counterparts aged 65 and older
Tables 11 to 13 investigate the economic vulnerability of unattached individuals.
Table 11 measures the percentage of unattached individuals living with low income, as measured by Statistics Canada’s after-tax low-income cutoffs. It shows that, regardless of the year considered, proportionately more unattached men and women aged 50 to 64 lived with low income, compared with their counterparts aged 65 and older. For instance, 29% of younger unattached men lived with low income in 2016, more than twice the rate of 13% observed for unattached male seniors. The data also indicate that the incidence of low income among younger unattached men and women was lower in 2016 than in 2012. For both age groups (50 to 64 and 65 and older), no sizable gender difference in the incidence of low income is observed in 2016. However, substantial differences are observed across family types. Regardless of the age and sex of the major income earner, the incidence of low income in 2016 was at least five times lower among couples with no children at home than among unattached individuals.
Table 12 quantifies the relative importance of a group particularly vulnerable to income shocks or unexpected expenditures: unattached individuals who live with low income and who have no financial wealth. It shows that, in 2016, about 5% of younger unattached men and women lived with low income and had no financial wealth, compared with at most 2% of unattached male and female seniors.
Table 13 shows that, in 2016, younger unattached men and women were about twice as likely as unattached male and female seniors to have no financial wealth. For example, 18% of unattached men aged 50 to 64 had no financial wealth in 2016, compared with 7% of their counterparts aged 65 and older.
Taken together, the numbers presented in this section highlight an important age difference in terms of indebtedness and economic vulnerability. Compared with their counterparts aged 65 and older, unattached men and women aged 50 to 64 (a) had higher debt-to-income ratios; (b) were less likely to pay the full amount on their credit card balances each month; (c) were more likely to withdraw money from RRSPs for reasons other than to purchase an annuity or an RRIF, to use the Home Buyers’ Plan, or to use the Lifelong Learning Plan; (d) were more likely to live with low income; and (e) were more likely to have no financial wealth. However, on several of these dimensions, no sizable gender difference is observed.
6 Wealth composition in 2016
The analyses conducted so far have documented changes in wealth holdings from 1999 to 2016. However, the asset and debt composition of various groups of unattached individuals for a given year has not yet been examined. This is done in tables 14 to 16 for 2016, using statistics on average wealth.
Table 14 focuses on unattached individuals aged 50 and older. The second panel shows that, relative to their male counterparts, unattached women held, on average, a greater share of their wealth in the form of a principal residence, but a lower share in the form of other residences and business equity. For example, housing wealth in the form of a principal residence accounted for 35% of the average wealth of unattached women, compared with 27% for unattached men. These patterns are also observed among unattached individuals aged 50 to 64 (Table 15) and unattached individuals aged 65 and older (Table 16).
Table 15 also shows that unattached women aged 50 to 64 held a greater share of their average wealth in the form of RPP assets (34%), relative to unattached men aged 50 to 64 (27%).
When all unattached men and women aged 50 and older are considered, housing wealth and RPP assets accounted for at least 60% of their average wealth (Table 14). When attention is restricted to specific age groups, unattached men and women held between 59% and 70% of their average wealth in the form of housing wealth and RPP assets (tables 15 and 16). For this reason, movements in home prices and in the value of RPPs will often be key drivers of changes in the wealth holdings of unattached men and women.
7 Summary
Using data from the SFS of 1999, 2005, 2012 and 2016, this paper examined the wealth holdings of unattached men and women aged 50 and older over the 1999-to-2016 period. The main findings can be summarized as follows:Note
- From 1999 to 2016, median wealth grew faster among unattached women aged 50 and older than among unattached men aged 50 and older.
- Combined with the fact that the median wealth of unattached women aged 50 and over was slightly higher than that of their male counterparts in 1999, this stronger growth led unattached women aged 50 and older to have substantially higher median wealth than unattached men aged 50 and older in 2016.
- The faster growth in the median wealth of unattached women is observed among unattached seniors (i.e., those aged 65 and older) but not among younger unattached individuals (i.e., those aged 50 to 64).
- Unattached female seniors experienced stronger wealth growth than their male counterparts during the 1999-to-2016 period largely because they increased their housing wealth and RPP assets at a faster pace. The same conclusion applies when all unattached men and women aged 50 and older are considered.
- In 2016, unattached women aged 50 and older were more likely to be homeowners and to have RPP assets than unattached men aged 50 and older. This gender difference is also observed among unattached individuals aged 50 to 64. No sizable gender difference is observed for these two dimensions for unattached seniors.
- Among homeowners, median net equity in the principal residence in 2016 was higher for unattached women aged 50 and older than it was for unattached men aged 50 and older.
- Regardless of age, unattached men and women had similar debt-to-income ratios in 2016. Their propensity to have mortgage payments was also similar.
- Compared with their counterparts aged 65 and older, unattached men and women aged 50 to 64 (a) had higher debt-to-income ratios; (b) were less likely to pay the full amount on their credit card balances each month; (c) were more likely to withdraw money from RRSPs for reasons other than to purchase an annuity or an RRIF, to use the Home Buyers’ Plan, or to use the Lifelong Learning Plan; (d) were more likely to live with low income; and (e) were more likely to have no financial wealth. However, on several of these dimensions, no sizable gender difference is observed.
- In 2016, about 5% of younger unattached men and women lived with low income and had no financial wealth. This group is particularly vulnerable to negative income shocks and unexpected expenditures.
- Regardless of the age and year considered, unattached women had substantially smaller wealth holdings than couples with no children at home and whose major income earner was a woman of a similar age. The same is observed for unattached men, compared with couples with no children at home whose major income earner was a man of a similar age.
- Regardless of the age and sex of the major income earner, the incidence of low income in 2016 was at least five times lower among couples with no children at home whose major income earner was aged 50 or older than among unattached individuals aged 50 and older.
- In 2016, relative to their male counterparts, unattached women aged 50 and older held a greater share of their wealth in the form of a principal residence, but a lower share in the form of other residences and business equity.
Overall, these findings paint a reasonably positive picture of the economic situation of unattached women relative to that of unattached men, while highlighting the fact that both unattached men and unattached women are, in general, more economically vulnerable to income shocks and unexpected expenditures than couples of a similar age with no children at home. If women keep increasing their presence in high-paying occupations, their individual lifetime income—and their ability to accumulate wealth—is expected to increase over time. However, increases in life expectancy and general trends towards reduced RPP coverage in the workforce will put pressure on individuals to increase their retirement savings. For all these reasons, monitoring the evolution of the wealth holdings of unattached men and women—as well as the evolution of those of other segments of the population—will be crucial to inform future discussions about preparedness for retirement and economic vulnerability.
8 Appendix
8.1 The Survey of Financial Security Note
The Survey of Financial Security (SFS) is a household survey that has been conducted in 1999, 2005, 2012 and 2016 to measure the wealth, or net worth, of Canadian families. In-person interviews are used to collect information on the value of all major financial and non-financial assets and on money owing on mortgages, vehicles, credit cards, student loans and other debts. The net worth of a family is defined as the value of its assets minus its debts.
The SFS covers the population living in the 10 provinces of Canada. The survey’s coverage excludes people living on reserves and other Indigenous settlements in the provinces; official representatives of foreign countries living in Canada and their families; members of religious and other communal colonies; members of the Canadian Forces living on military bases; people living in residences for seniors; and people living full time in institutions, such as inmates of penal institutions and chronic care patients living in hospitals and nursing homes. Together, these exclusions represent approximately 2% of the population.
Over the years, the SFS sample size has varied according to the budget available. The 1999, 2012 and 2016 iterations of the SFS had sample sizes of about 23,000, 20,000 and 21,000 dwellings, respectively. With these sample sizes, the survey design aimed to produce reliable estimates at the provincial level. In 2005, the sample size was considerably smaller, about 9,000 dwellings. As a result, the 2005 SFS targeted reliable estimates at the regional rather than provincial level.
One of the challenges of conducting a survey on wealth is the skewness of the distribution of wealth. In every iteration of the SFS, high net worth households have been oversampled to ensure adequate coverage of less common types of assets and debts and to improve the efficiency of the sample design. The way of doing this has evolved over time in response to the availability of improved sampling frames.
In 1999 and 2005, an overlapping dual-frame design was used. Part of the sample came from the Labour Force Survey (LFS) area frame, to ensure complete coverage of the population, and part of the sample came from a list of dwellings in high-income postal codes, to ensure adequate oversampling of high net worth families. In 2012, a similar overlapping dual-frame design was used. In this case, the LFS area frame sample was paired with a second sample selected from the T1 Family File (T1FF), a family tax file derived from tax returns. Based on information in the T1FF, the net worth of households was estimated, and the T1FF sample was stratified by predicted net worth. The model used to predict the net worth of households in the T1FF was based on the 2005 iteration of the SFS and took into account information such as age and income. In 2016, the sample design was again based on information from two frames, but without overlap, increasing the efficiency of the design. The LFS area frame was used in rural areas to allow for a clustered design that was needed for doing in-person interviews. In urban and urban-adjacent areas, a list frame based on the Household Survey Frame was used. The urban part of the sample was stratified according to predicted net worth, with the addition of a stratum for households for which income information was not available.
| Major income earner | Sample sizes | Median wealth | Average wealth | |||
|---|---|---|---|---|---|---|
| Men | Women | Men | Women | Men | Women | |
| number | 2016 dollars | |||||
| Unattached individuals aged 50 and older | ||||||
| 1999 | 730 | 1,645 | 131,681 | 139,595 | 293,378 | 272,231 |
| 2005 | 294 | 549 | 173,767 | 196,344 | 328,221 | 369,688 |
| 2012 | 819 | 1,400 | 187,272 | 212,631 | 478,520 | 378,893 |
| 2016 | 956 | 1,432 | 195,000 | 266,093 | 459,912 | 463,204 |
| 1999 to 2016 (percent) | Note ...: not applicable | Note ...: not applicable | 48 | 91 | 57 | 70 |
| Unattached individuals aged 50 to 64 | ||||||
| 1999 | 364 | 499 | 55,907 | 113,979 | 236,564 | 290,452 |
| 2005 | 156 | 204 | 142,015 | 237,779 | 262,048 | 356,772 |
| 2012 | 427 | 533 | 132,621 | 137,062 | 431,495 | 383,892 |
| 2016 | 485 | 527 | 129,825 | 222,108 | 424,776 | 442,497 |
| 1999 to 2016 (percent) | Note ...: not applicable | Note ...: not applicable | 132 | 95 | 80 | 52 |
| Unattached individuals aged 65 and older | ||||||
| 1999 | 366 | 1,146 | 220,914 | 148,579 | 363,645 | 263,962 |
| 2005 | 138 | 345 | 248,950 | 186,000 | 424,555 | 377,590 |
| 2012 | 392 | 867 | 270,009 | 256,934 | 554,138 | 375,356 |
| 2016 | 471 | 905 | 245,049 | 290,000 | 504,382 | 476,684 |
| 1999 to 2016 (percent) | Note ...: not applicable | Note ...: not applicable | 11 | 95 | 39 | 81 |
| Couples with no children and major income earner aged 50 or older | ||||||
| 1999 | 2,970 | 557 | 480,284 | 449,971 | 669,368 | 707,547 |
| 2005 | 1,073 | 265 | 625,368 | 558,241 | 854,194 | 963,399 |
| 2012 | 2,328 | 796 | 795,510 | 647,281 | 1,157,907 | 967,543 |
| 2016 | 2,308 | 811 | 801,537 | 956,811 | 1,251,908 | 1,346,868 |
| 1999 to 2016 (percent) | Note ...: not applicable | Note ...: not applicable | 67 | 113 | 87 | 90 |
| Couples with no children and major income earner aged 50 to 64 | ||||||
| 1999 | 1,637 | 405 | 518,211 | 456,051 | 711,124 | 725,642 |
| 2005 | 613 | 191 | 656,221 | 563,723 | 901,087 | 985,464 |
| 2012 | 987 | 527 | 829,001 | 624,303 | 1,273,109 | 913,466 |
| 2016 | 985 | 460 | 891,000 | 1,083,100 | 1,346,223 | 1,457,746 |
| 1999 to 2016 (percent) | Note ...: not applicable | Note ...: not applicable | 72 | 137 | 89 | 101 |
| Couples with no children and major income earner aged 65 or older | ||||||
| 1999 | 1,333 | 152 | 435,855 | 424,743 | 615,650 | 649,391 |
| 2005 | 460 | 74 | 573,624 | 547,486 | 786,102 | 895,779 |
| 2012 | 1,341 | 269 | 732,207 | 686,840 | 1,061,607 | 1,079,890 |
| 2016 | 1,323 | 351 | 756,719 | 800,774 | 1,180,996 | 1,199,296 |
| 1999 to 2016 (percent) | Note ...: not applicable | Note ...: not applicable | 74 | 89 | 92 | 85 |
|
... not applicable Source: Statistics Canada, Survey of Financial Security, 1999, 2005, 2012 and 2016. |
||||||
| Major income earner | Sample sizes | Median wealth | Average wealth | |||
|---|---|---|---|---|---|---|
| Men | Women | Men | Women | Men | Women | |
| number | 2016 dollars | |||||
| Unattached individuals aged 50 and older with no university degree | ||||||
| 1999 | 607 | 1,470 | 95,367 | 118,172 | 249,366 | 234,346 |
| 2005 | 256 | 461 | 167,572 | 170,042 | 291,365 | 317,024 |
| 2012 | 660 | 1,140 | 106,455 | 165,116 | 358,775 | 317,346 |
| 2016 | 758 | 1,123 | 128,735 | 211,000 | 374,761 | 379,358 |
| 1999 to 2016 (percent) | Note ...: not applicable | Note ...: not applicable | 35 | 79 | 50 | 62 |
| Unattached individuals aged 50 and older with a university degree | ||||||
| 1999 | 123 | 175 | 361,549 | 376,227 | 550,758 | 583,575 |
| 2005 | 38 | 88 | 478,801 | 387,864 | 608,871 | 673,969 |
| 2012 | 159 | 260 | 540,951 | 533,834 | 952,499 | 674,614 |
| 2016 | 198 | 309 | 646,300 | 554,244 | 818,322 | 740,722 |
| 1999 to 2016 (percent) | Note ...: not applicable | Note ...: not applicable | 79 | 47 | 49 | 27 |
| Unattached individuals aged 50 to 64 with no university degree | ||||||
| 1999 | 294 | 413 | 40,082 | 90,560 | 205,914 | 251,979 |
| 2005 | 134 | 160 | 108,976 | 151,200 | 227,773 | 313,206 |
| 2012 | 342 | 394 | 66,764 | 70,431 | 322,545 | 309,315 |
| 2016 | 388 | 381 | 84,000 | 195,500 | 336,191 | 369,088 |
| 1999 to 2016 (percent) | Note ...: not applicable | Note ...: not applicable | 110 | 116 | 63 | 46 |
| Unattached individuals aged 65 and older with no university degree | ||||||
| 1999 | 313 | 1,057 | 211,812 | 137,861 | 303,308 | 227,273 |
| 2005 | 122 | 301 | 231,251 | 175,517 | 381,413 | 319,143 |
| 2012 | 318 | 746 | 233,167 | 211,711 | 416,400 | 322,449 |
| 2016 | 370 | 742 | 195,500 | 222,000 | 422,756 | 384,977 |
| 1999 to 2016 (percent) | Note ...: not applicable | Note ...: not applicable | -8 | 61 | 39 | 69 |
|
... not applicable Source: Statistics Canada, Survey of Financial Security, 1999, 2005, 2012 and 2016. |
||||||
| 1999 | 2005 | 2012 | 2016 | Growth from 1999 to 2016 | |
|---|---|---|---|---|---|
| percent | |||||
| Percentage with a principal residence | |||||
| I. Unattached individuals aged 50 and older | |||||
| Men | 42.3 | 47.5 | 46.2 | 45.9 | Note ...: not applicable |
| Women | 47.3 | 52.7 | 49.9 | 52.3 | Note ...: not applicable |
| II. Unattached individuals aged 50 to 64 | |||||
| Men | 36.9 | 40.2 | 41.4 | 44.5 | Note ...: not applicable |
| Women | 46.0 | 55.5 | 45.4 | 55.3 | Note ...: not applicable |
| III. Unattached individuals aged 65 and older | |||||
| Men | 49.0 | 58.2 | 54.0 | 47.7 | Note ...: not applicable |
| Women | 47.9 | 51.0 | 53.1 | 50.4 | Note ...: not applicable |
| 2016 dollars | percent | ||||
| Median value of principal residence (homeowners) | |||||
| I. Unattached individuals aged 50 and older | |||||
| Men | 138,213 | 168,000 | 256,378 | 250,000 | 81 |
| Women | 138,213 | 186,000 | 263,763 | 280,000 | 103 |
| II. Unattached individuals aged 50 to 64 | |||||
| Men | 121,628 | 150,000 | 263,763 | 255,000 | 110 |
| Women | 138,213 | 186,000 | 263,763 | 269,000 | 95 |
| III. Unattached individuals aged 65 and older | |||||
| Men | 138,213 | 192,000 | 237,387 | 240,000 | 74 |
| Women | 139,364 | 180,000 | 263,763 | 280,000 | 101 |
| Median net equity in principal residence (homeowners) | |||||
| I. Unattached individuals aged 50 and older | |||||
| Men | 110,571 | 120,000 | 211,011 | 200,000 | 81 |
| Women | 134,011 | 156,000 | 232,112 | 235,000 | 75 |
| II. Unattached individuals aged 50 to 64 | |||||
| Men | 103,660 | 120,000 | 192,020 | 185,000 | 78 |
| Women | 113,335 | 134,400 | 189,910 | 197,000 | 74 |
| III. Unattached individuals aged 65 and older | |||||
| Men | 138,213 | 180,000 | 223,144 | 230,000 | 66 |
| Women | 138,213 | 180,000 | 242,662 | 264,000 | 91 |
|
... not applicable Source: Statistics Canada, Assets and Debts Survey, 1984; Survey of Financial Security, 1999, 2005, 2012 and 2016. |
|||||
| 1999 | 2005 | 2012 | 2016 | Growth from 1999 to 2016 | |
|---|---|---|---|---|---|
| percent | |||||
| Percentage with registered pension plan (RPP) assets | |||||
| I. Unattached individuals aged 50 and older | |||||
| Men | 37.1 | 44.6 | 38.1 | 40.7 | Note ...: not applicable |
| Women | 38.0 | 47.1 | 37.6 | 45.7 | Note ...: not applicable |
| II. Unattached individuals aged 50 to 64 | |||||
| Men | 31.3 | 39.4 | 36.1 | 37.6 | Note ...: not applicable |
| Women | 39.2 | 44.1 | 35.8 | 47.0 | Note ...: not applicable |
| III. Unattached individuals aged 65 and older | |||||
| Men | 44.2 | 52.2 | 41.3 | 44.7 | Note ...: not applicable |
| Women | 37.4 | 49.0 | 38.8 | 44.8 | Note ...: not applicable |
| 2016 dollars | percent | ||||
| Median value of RPP assets (individuals with RPP assets) | |||||
| I. Unattached individuals aged 50 and older | |||||
| Men | 140,749 | 180,058 | 220,725 | 186,534 | 33 |
| Women | 97,458 | 137,088 | 159,930 | 159,109 | 63 |
| II. Unattached individuals aged 50 to 64 | |||||
| Men | 149,241 | 222,058 | 202,563 | 178,135 | 19 |
| Women | 98,748 | 207,923 | 208,549 | 226,944 | 130 |
| III. Unattached individuals aged 65 and older | |||||
| Men | 140,749 | 156,238 | 247,248 | 187,000 | 33 |
| Women | 97,191 | 124,915 | 150,839 | 148,210 | 52 |
|
... not applicable Source: Statistics Canada, Survey of Financial Security, 1999, 2005, 2012 and 2016. |
|||||
| Men | Women | Women versus men |
|
|---|---|---|---|
| percent | |||
| I. Unattached individuals aged 50 and older | |||
| Growth rate in average wealth, 1999 to 2016 | 56.8 | 70.2 | 13.4 |
| Contribution to growth rate: | |||
| Housing wealth | |||
| Principal residence | 21.3 | 30.8 | 9.5 |
| Other residences | 7.6 | 5.1 | -2.5 |
| Registered pension plan assets | 14.9 | 20.8 | 5.9 |
| Registered retirement savings plans | 4.5 | 7.5 | 3.0 |
| Business equity | 6.7 | 1.6 | -5.1 |
| Other | 1.7 | 4.4 | 2.6 |
| number | |||
| Sample sizes | |||
| 1999 | 730 | 1,645 | .... |
| 2016 | 956 | 1,432 | Note ...: not applicable |
| percent | |||
| II. Unattached individuals aged 50 and older (top 1% excluded) | |||
| Growth rate in average wealth, 1999 to 2016 | 55.5 | 74.0 | 18.5 |
| Contribution to growth rate: | |||
| Housing wealth | |||
| Principal residence | 22.5 | 32.1 | 9.6 |
| Other residences | 3.2 | 4.9 | 1.7 |
| Registered pension plan assets | 16.3 | 22.7 | 6.3 |
| Registered retirement savings plans | 5.5 | 7.8 | 2.3 |
| Business equity | 3.3 | 1.5 | -1.8 |
| Other | 4.8 | 5.0 | 0.3 |
| number | |||
| Sample sizes | |||
| 1999 | 704 | 1,616 | Note ...: not applicable |
| 2016 | 938 | 1,403 | Note ...: not applicable |
|
... not applicable Source: Statistics Canada, Survey of Financial Security, 1999 and 2016. |
|||
| Unattached individuals | Aged 50 to 64 | Aged 65 and older | ||||
|---|---|---|---|---|---|---|
| Men | Women | Women versus men | Men | Women | Women versus men | |
| percent | ||||||
| I. All unattached individuals | ||||||
| Growth rate in average wealth, 1999 to 2016 | 79.6 | 52.3 | -27.2 | 38.7 | 80.6 | 41.9 |
| Contribution to growth rate: | ||||||
| Housing wealth | ||||||
| Principal residence | 22.0 | 25.9 | 3.9 | 20.9 | 34.6 | 13.7 |
| Other residences | 11.5 | -0.5 | -12.0 | 4.4 | 8.3 | 3.9 |
| Registered pension plan assets | 24.7 | 29.8 | 5.1 | 7.0 | 13.7 | 6.7 |
| Registered retirement savings plans | 8.1 | 4.2 | -4.0 | 1.5 | 7.8 | 6.3 |
| Business equity | 7.6 | 0.5 | -7.1 | 6.1 | 2.2 | -3.8 |
| Other | 5.6 | -7.5 | -13.1 | -1.1 | 14.1 | 15.2 |
| number | ||||||
| Sample sizes | ||||||
| 1999 | 364 | 499 | Note ...: not applicable | 366 | 1,146 | Note ...: not applicable |
| 2016 | 485 | 527 | Note ...: not applicable | 471 | 905 | Note ...: not applicable |
| percent | ||||||
| II. Top 1% excluded | ||||||
| Growth rate in average wealth, 1999 to 2016 | 77.5 | 63.2 | -14.3 | 37.4 | 79.3 | 41.9 |
| Contribution to growth rate: | ||||||
| Housing wealth | ||||||
| Principal residence | 23.7 | 28.1 | 4.4 | 21.7 | 35.3 | 13.6 |
| Other residences | 5.7 | 1.4 | -4.3 | 1.2 | 6.9 | 5.7 |
| Registered pension plan assets | 26.3 | 32.4 | 6.0 | 7.6 | 15.4 | 7.8 |
| Registered retirement savings plans | 8.3 | 5.2 | -3.2 | 2.8 | 7.1 | 4.3 |
| Business equity | 6.2 | 0.8 | -5.4 | 1.6 | 1.8 | 0.1 |
| Other | 7.2 | -4.7 | -12.0 | 2.4 | 12.8 | 10.4 |
| number | ||||||
| Sample sizes | ||||||
| 1999 | 354 | 489 | Note ...: not applicable | 351 | 1,127 | Note ...: not applicable |
| 2016 | 478 | 517 | Note ...: not applicable | 461 | 885 | Note ...: not applicable |
|
... not applicable Source: Statistics Canada, Survey of Financial Security, 1999 and 2016. |
||||||
| 1999 | 2005 | 2012 | 2016 | |
|---|---|---|---|---|
| number | ||||
| Group-level debt-to-income ratios | ||||
| Unattached individuals aged 50 and older | ||||
| Men | 0.44 | 0.51 | 1.02 | 1.16 |
| Women | 0.36 | 0.67 | 0.74 | 0.94 |
| Unattached individuals aged 50 to 64 | ||||
| Men | 0.66 | 0.55 | 1.28 | 1.65 |
| Women | 0.89 | 1.25 | 1.21 | 1.65 |
| Unattached individuals aged 65 and older | ||||
| Men | 0.17 | 0.44 | 0.60 | 0.48 |
| Women | 0.12 | 0.29 | 0.38 | 0.42 |
| Couples with no children and major income earner aged 50 or older | ||||
| Men | 0.52 | 0.68 | 0.75 | 0.95 |
| Women | 0.73 | 0.82 | 0.91 | 1.02 |
| Couples with no children and major income earner aged 50 to 64 | ||||
| Men | 0.67 | 0.85 | 1.04 | 1.22 |
| Women | 0.85 | 1.01 | 1.08 | 1.35 |
| Couples with no children and major income earner aged 65 or older | ||||
| Men | 0.22 | 0.25 | 0.44 | 0.65 |
| Women | 0.21 | 0.14 | 0.48 | 0.47 |
| Group-level debt-to-asset ratios | ||||
| Unattached individuals aged 50 and older | ||||
| Men | 0.04 | 0.05 | 0.07 | 0.09 |
| Women | 0.03 | 0.05 | 0.06 | 0.07 |
| Unattached individuals aged 50 to 64 | ||||
| Men | 0.08 | 0.06 | 0.10 | 0.13 |
| Women | 0.08 | 0.10 | 0.09 | 0.12 |
| Unattached individuals aged 65 and older | ||||
| Men | 0.01 | 0.03 | 0.04 | 0.03 |
| Women | 0.01 | 0.02 | 0.03 | 0.03 |
| Couples with no children and major income earner aged 50 or older | ||||
| Men | 0.05 | 0.06 | 0.05 | 0.06 |
| Women | 0.06 | 0.06 | 0.06 | 0.06 |
| Couples with no children and major income earner aged 50 to 64 | ||||
| Men | 0.07 | 0.08 | 0.07 | 0.08 |
| Women | 0.08 | 0.07 | 0.08 | 0.07 |
| Couples with no children and major income earner aged 65 or older | ||||
| Men | 0.02 | 0.02 | 0.03 | 0.04 |
| Women | 0.02 | 0.01 | 0.03 | 0.03 |
|
Notes: Group-level debt-to-income ratios are computed by dividing a group's average total debt holdings by its average family income after-tax. Group-level debt-to-asset ratios are computed by dividing a group's average total debt holdings by its average total asset holdings. Source: Statistics Canada, Survey of Financial Security, 1999, 2005, 2012 and 2016. |
||||
| 1999 | 2005 | 2012 | 2016 | |
|---|---|---|---|---|
| percent | ||||
| Percentage of unattached individuals with mortgage payments | ||||
| Unattached individuals aged 50 and older | ||||
| Men | 9.3 | 14.8 | 14.9 | 16.4 |
| Women | 7.5 | 15.5 | 12.7 | 15.6 |
| Unattached individuals aged 50 to 64 | ||||
| Men | 14.1 | 15.6 | 19.7 | 22.1 |
| Women | 17.2 | 32.5 | 19.8 | 26.5 |
| Unattached individuals aged 65 and older | ||||
| Men | 3.2 | 13.8 | 7.2 | 9.2 |
| Women | 3.1 | 5.1 | 7.8 | 8.4 |
| number | ||||
| Average annualized mortgage payments divided by average family income after taxTable 8 Note 1 | ||||
| Unattached individuals aged 50 and older | ||||
| Men | 0.37 | Note ...: not applicable | 0.36 | 0.35 |
| Women | 0.36 | Note ...: not applicable | 0.38 | 0.37 |
... not applicable
|
||||
| 1999 | 2005 | 2012 | 2016 | |
|---|---|---|---|---|
| percent | ||||
| A) Used payday loans in the last three years | ||||
| Unattached individuals aged 50 and older | ||||
| Men | Note ...: not applicable | 0.3 | 3.4 | 2.8 |
| Women | Note ...: not applicable | 0.2 | 0.9 | 1.6 |
| Unattached individuals aged 50 to 64 | ||||
| Men | Note ...: not applicable | 0.5 | 5.3 | 3.6 |
| Women | Note ...: not applicable | 0.4 | 0.7 | 2.3 |
| Unattached individuals aged 65 and older | ||||
| Men | Note ...: not applicable | 0.0 | 0.3 | 1.9 |
| Women | Note ...: not applicable | 0.0 | 1.1 | 1.2 |
| B) Had no credit cards because of refusals | ||||
| Unattached individuals aged 50 and older | ||||
| Men | 5.9 | 7.3 | 6.1 | 5.2 |
| Women | 2.4 | 2.6 | 4.3 | 4.0 |
| Unattached individuals aged 50 to 64 | ||||
| Men | 9.8 | 11.5 | 7.4 | 6.7 |
| Women | 4.6 | 5.5 | 7.5 | 7.1 |
| Unattached individuals aged 65 and older | ||||
| Men | 1.1 | 1.2 | 4.0 | 3.4 |
| Women | 1.4 | 0.9 | 2.1 | 1.9 |
| C) Usually paid off credit card balances each month (credit card holders) | ||||
| Unattached individuals aged 50 and older | ||||
| Men | 81.1 | 76.3 | 77.0 | 66.5 |
| Women | 82.4 | 77.3 | 77.7 | 73.0 |
| Unattached individuals aged 50 to 64 | ||||
| Men | 75.1 | 74.6 | 69.4 | 56.6 |
| Women | 70.5 | 61.1 | 66.4 | 57.9 |
| Unattached individuals aged 65 and older | ||||
| Men | 88.1 | 78.5 | 88.6 | 79.4 |
| Women | 88.3 | 87.2 | 85.1 | 83.0 |
|
... not applicable Note: The 2016 numbers in panel C show the percentage of individuals paying "the full amount" on their credit card balances. Source: Statistics Canada, Survey of Financial Security, 1999, 2005, 2012 and 2016. |
||||
| 1999 | 2005 | 2012 | 2016 | |
|---|---|---|---|---|
| percent | ||||
| A) Ever withdrew money from registered retirement savings plan (RRSP) for any other reasonTable 10 Note 1 | ||||
| Unattached individuals aged 50 and older | ||||
| Men | 14.2 | 17.9 | 15.8 | 23.9 |
| Women | 11.3 | 14.9 | 15.7 | 17.9 |
| Unattached individuals aged 50 to 64 | ||||
| Men | 17.2 | 24.4 | 17.8 | 28.5 |
| Women | 21.6 | 24.6 | 21.1 | 24.5 |
| Unattached individuals aged 65 and older | ||||
| Men | 10.5 | 8.3 | 12.7 | 18.0 |
| Women | 6.7 | 8.9 | 11.8 | 13.6 |
| B) Ever withdrew money from RRSP for any other reason,Table 10 Note 2 conditional on ever having RRSP savings | ||||
| Unattached individuals aged 50 and older | ||||
| Men | 31.5 | 34.4 | 32.9 | 41.1 |
| Women | 26.5 | 28.9 | 30.3 | 29.9 |
| Unattached individuals aged 50 to 64 | ||||
| Men | 35.8 | 42.1 | 36.7 | 47.2 |
| Women | 34.9 | 37.4 | 36.6 | 38.5 |
| Unattached individuals aged 65 and older | ||||
| Men | 25.4 | 19.3 | 26.6 | 32.7 |
| Women | 19.5 | 20.8 | 24.8 | 23.7 |
|
||||
| 1999 | 2005 | 2012 | 2016 | |
|---|---|---|---|---|
| percent | ||||
| Unattached individuals aged 50 and older | ||||
| Men | 31.0 | 30.6 | 32.0 | 22.1 |
| Women | 28.1 | 26.3 | 25.2 | 21.1 |
| Unattached individuals aged 50 to 64 | ||||
| Men | 40.8 | 38.9 | 40.8 | 29.1 |
| Women | 41.0 | 32.6 | 38.0 | 29.3 |
| Unattached individuals aged 65 and older | ||||
| Men | 19.0 | 18.4 | 17.7 | 13.3 |
| Women | 22.2 | 22.4 | 16.2 | 15.7 |
| Couples with no children and major income earner aged 50 or older | ||||
| Men | 4.3 | 3.4 | 3.0 | 2.0 |
| Women | 6.0 | 4.9 | 4.4 | 2.8 |
| Couples with no children and major income earner aged 50 to 64 | ||||
| Men | 6.1 | 4.5 | 3.8 | 2.7 |
| Women | 6.4 | 5.7 | 5.9 | 3.0 |
| Couples with no children and major income earner aged 65 or older | ||||
| Men | 1.3 | 1.3 | 2.3 | 1.5 |
| Women | 4.3 | 1.9 | 1.4 | 2.4 |
|
Note: Low income rates based on Statistics Canada's after-tax low-income cutoffs. Source: Statistics Canada, Survey of Financial Security, 1999, 2005, 2012 and 2016. |
||||
| 1999 | 2005 | 2012 | 2016 | |
|---|---|---|---|---|
| percent | ||||
| Unattached individuals aged 50 and older | ||||
| Men | 3.3 | 2.6 | 5.8 | 3.2 |
| Women | 0.9 | 1.2 | 2.4 | 3.2 |
| Unattached individuals aged 50 to 64 | ||||
| Men | 5.1 | 3.3 | 7.5 | 4.6 |
| Women | 2.2 | 2.4 | 3.8 | 5.2 |
| Unattached individuals aged 65 and older | ||||
| Men | 1.0 | 1.5 | 3.2 | 1.4 |
| Women | 0.3 | 0.5 | 1.4 | 1.9 |
| Couples with no children and major income earner aged 50 or older | ||||
| Men | 0.1 | 0.6 | 0.1 | 0.2 |
| Women | 0.2 | 1.6 | 0.7 | 0.5 |
| Couples with no children and major income earner aged 50 to 64 | ||||
| Men | 0.1 | 0.8 | 0.1 | 0.1 |
| Women | 0.3 | 1.5 | 0.4 | 0.7 |
| Couples with no children and major income earner aged 65 or older | ||||
| Men | 0.0 | 0.0 | 0.1 | 0.3 |
| Women | 0.0 | 1.9 | 1.2 | 0.2 |
|
Notes: Low-income rates based on Statistics Canada's after-tax low-income cutoffs. Financial wealth equals net worth minus housing equity, business equity and private pension plan assets. Private pension plan assets include assets from registered pension plans, registered retirement savings plans, locked-in retirement accounts, registered retirement income funds and other retirement funds. Source: Statistics Canada, Survey of Financial Security, 1999, 2005, 2012 and 2016. |
||||
| 1999 | 2005 | 2012 | 2016 | |
|---|---|---|---|---|
| percent | ||||
| Unattached individuals aged 50 and older | ||||
| Men | 9.6 | 4.3 | 16.0 | 13.3 |
| Women | 2.5 | 6.5 | 9.3 | 10.6 |
| Unattached individuals aged 50 to 64 | ||||
| Men | 13.9 | 5.7 | 19.2 | 18.0 |
| Women | 5.3 | 11.3 | 16.0 | 16.9 |
| Unattached individuals aged 65 and older | ||||
| Men | 4.3 | 2.3 | 10.9 | 7.3 |
| Women | 1.2 | 3.6 | 4.6 | 6.4 |
| Couples with no children and major income earner aged 50 or older | ||||
| Men | 5.0 | 9.3 | 7.6 | 8.9 |
| Women | 4.9 | 13.1 | 12.8 | 9.8 |
| Couples with no children and major income earner aged 50 to 64 | ||||
| Men | 7.0 | 13.6 | 12.2 | 11.7 |
| Women | 5.2 | 15.2 | 14.2 | 10.9 |
| Couples with no children and major income earner aged 65 or older | ||||
| Men | 1.9 | 1.1 | 3.7 | 6.8 |
| Women | 3.7 | 5.8 | 9.8 | 8.5 |
|
Notes: Financial wealth equals net worth minus housing equity, business equity and private pension plan assets. Private pension plan assets include assets from registered pension plans, registered retirement savings plans, locked-in retirement accounts, registered retirement income funds and other retirement funds. Source: Statistics Canada, Survey of Financial Security, 1999, 2005, 2012 and 2016. |
||||
| Major income earner | Unattached individuals aged 50 and older | Couples with no children and major income earner aged 50 or older | ||
|---|---|---|---|---|
| Men | Women | Men | Women | |
| 2016 dollars | ||||
| Average wealth in 2016 | 459,912 | 463,204 | 1,251,908 | 1,346,868 |
| Housing wealth | ||||
| Principal residence | 124,303 | 161,694 | 349,064 | 365,296 |
| Other residences | 42,090 | 24,710 | 100,101 | 109,920 |
| Registered pension plan assets | 111,210 | 113,454 | 296,261 | 344,851 |
| Registered retirement savings plans | 39,724 | 35,357 | 122,032 | 121,378 |
| Business equity | 33,808 | 7,162 | 111,966 | 127,373 |
| Other | 108,777 | 120,827 | 272,484 | 278,049 |
| percent | ||||
| Housing wealth | ||||
| Principal residence | 27.0 | 34.9 | 27.9 | 27.1 |
| Other residences | 9.2 | 5.3 | 8.0 | 8.2 |
| Registered pension plan assets | 24.2 | 24.5 | 23.7 | 25.6 |
| Registered retirement savings plans | 8.6 | 7.6 | 9.7 | 9.0 |
| Business equity | 7.4 | 1.5 | 8.9 | 9.5 |
| Other | 23.7 | 26.1 | 21.8 | 20.6 |
| number | ||||
| Sample sizes | 956 | 1,432 | 2,308 | 811 |
| Source: Statistics Canada, Survey of Financial Security, 2016. | ||||
| Major income earner | Unattached individuals aged 50 to 64 | Couples with no children and major income earner aged 50 to 64 | ||
|---|---|---|---|---|
| Men | Women | Men | Women | |
| 2016 dollars | ||||
| Average wealth in 2016 | 424,776 | 442,497 | 1,346,223 | 1,457,746 |
| Housing wealth | ||||
| Principal residence | 102,571 | 143,637 | 331,869 | 344,079 |
| Other residences | 44,211 | 19,297 | 98,120 | 132,351 |
| Registered pension plan assets | 115,814 | 148,675 | 380,716 | 417,472 |
| Registered retirement savings plans | 52,475 | 53,168 | 169,369 | 154,390 |
| Business equity | 30,938 | 7,090 | 162,776 | 166,052 |
| Other | 78,767 | 70,631 | 203,374 | 243,402 |
| percent | ||||
| Housing wealth | ||||
| Principal residence | 24.1 | 32.5 | 24.7 | 23.6 |
| Other residences | 10.4 | 4.4 | 7.3 | 9.1 |
| Registered pension plan assets | 27.3 | 33.6 | 28.3 | 28.6 |
| Registered retirement savings plans | 12.4 | 12.0 | 12.6 | 10.6 |
| Business equity | 7.3 | 1.6 | 12.1 | 11.4 |
| Other | 18.5 | 16.0 | 15.1 | 16.7 |
| number | ||||
| Sample sizes | 485 | 527 | 985 | 460 |
| Source: Statistics Canada, Survey of Financial Security, 2016. | ||||
| Major income earner | Unattached individuals aged 65 or older | Couples with no children and major income earner aged 65 or older | ||
|---|---|---|---|---|
| Men | Women | Men | Women | |
| 2016 dollars | ||||
| Average wealth in 2016 | 504,382 | 476,684 | 1,180,996 | 1,199,296 |
| Housing wealth | ||||
| Principal residence | 151,808 | 173,449 | 361,993 | 393,536 |
| Other residences | 39,406 | 28,233 | 101,590 | 80,066 |
| Registered pension plan assets | 105,383 | 90,526 | 232,763 | 248,197 |
| Registered retirement savings plans | 23,586 | 23,763 | 86,442 | 77,442 |
| Business equity | 37,439 | 7,209 | 73,764 | 75,893 |
| Other | 146,758 | 153,503 | 324,444 | 324,162 |
| percent | ||||
| Housing wealth | ||||
| Principal residence | 30.1 | 36.4 | 30.7 | 32.8 |
| Other residences | 7.8 | 5.9 | 8.6 | 6.7 |
| Registered pension plan assets | 20.9 | 19.0 | 19.7 | 20.7 |
| Registered retirement savings plans | 4.7 | 5.0 | 7.3 | 6.5 |
| Business equity | 7.4 | 1.5 | 6.2 | 6.3 |
| Other | 29.1 | 32.2 | 27.5 | 27.0 |
| number | ||||
| Sample sizes | 471 | 905 | 1,323 | 351 |
| Source: Statistics Canada, Survey of Financial Security, 2016. | ||||
References
Bumpass, L., J. Sweet and T.C. Martin. 1990. “Changing patterns of remarriage.” Journal of Marriage and Family 52(3), 747-756.
Drolet, M. 2016. “Gender differences in the financial knowledge of Canadians.” Insights on Canadian Society. Statistics Canada Catalogue no. 75-006-X.
Fortin, N. 2019. “Increasing earnings inequality and the gender pay gap in Canada: Prospects for convergence.” Canadian Journal of Economics 52 (2): 407–440.
Frenette, M. 2014. An Investment of a Lifetime? The Long-term Labour Market Premiums Associated with a Postsecondary Education. Analytical Studies Branch Research Paper Series, no. 359. Statistics Canada Catalogue no. 11F0019M. Ottawa: Statistics Canada.
Gellatly, G., and E. Richards. 2019. Indebtedness and Wealth Among Canadian Households. Economic Insights, no. 89. Statistics Canada Catalogue no. 11-626-X. Ottawa: Statistics Canada.
Heisz, A., and E. Richards. 2019. Economic Well-being Across Generations of Young Canadians: Are Millennials Better or Worse Off? Economic Insights, no. 92. Statistics Canada Catalogue no. 11-626-X. Ottawa: Statistics Canada.
Messacar, D., and R. Morissette. 2015. “Employer pensions and the wealth of Canadian families.” Insights on Canadian Society. Statistics Canada Catalogue no. 75-006-X.
Morissette, R. 2018. Changing Characteristics of Canadian Jobs, 1981 to 2018. Economic Insights, no. 86. Statistics Canada Catalogue no. 11-626-X. Ottawa: Statistics Canada.
Morissette, R. 2019a. Financial Expectations and Household Debt. Economic Insights, no. 91. Statistics Canada Catalogue no. 11-626-X. Ottawa: Statistics Canada.
Morissette, R. 2019b. The Wealth of Immigrant Families in Canada. Analytical Studies Branch Research Paper Series, no. 422. Statistics Canada Catalogue no. 11F0019M. Ottawa: Statistics Canada.
Uppal, S. 2019a. “Debt and assets among senior Canadian families.” Insights on Canadian Society. Statistics Canada Catalogue no. 75-006-X.
Uppal, S. 2019b. “Homeownership, mortgage debt and types of mortgage among Canadian families.” Insights on Canadian Society. Statistics Canada Catalogue no. 75-006-X.
Uppal, S., and S. Larochelle-Côté. 2015a. “Changes in debt and assets of Canadian families, 1999 to 2012.” Insights on Canadian Society. Statistics Canada Catalogue no. 75-006-X.
Uppal, S., and S. Larochelle-Côté. 2015b. “Changes in wealth across the income distribution, 1999 to 2012.” Insights on Canadian Society. Statistics Canada Catalogue no. 75-006-X.
- Date modified: