
Analytical Studies Branch Research Paper Series
Immigrants’ Initial Firm Allocation and Earnings Growth

Archived Content
Information identified as archived is provided for reference, research or recordkeeping purposes. It is not subject to the Government of Canada Web Standards and has not been altered or updated since it was archived. Please "contact us" to request a format other than those available.
by Wen Ci and Feng Hou
Social Analysis and Modelling Division
Statistics Canada
Abstract
While employers are playing an increasingly important role in immigration selection in Canada, little is known about how firm-level characteristics affect the economic integration of immigrants. Using a Canadian employer–employee matched dataset, this paper considers whether immigrants initially employed in low-paying firms in Canada experienced inferior earnings growth than those initially employed in high-paying firms. The results show that the large earnings differential observed between immigrants initially employed in low- and high-paying firms diminished only slightly over the subsequent 14 years, even when differences in demographic and general human capital characteristics are taken into account. Furthermore, the earnings returns to education and host-country language ability were greater among immigrants starting in high-paying firms than among immigrants starting in low-paying firms.
Keywords: immigrants, firms, employer–employee matched data, earnings
Executive summary
In spite of the role that employers may play in the selection of economic immigrants, little is known about whether and how firm-level characteristics are associated with immigrants’ labour market outcomes over the longer term. As a first step towards providing relevant evidence, this study asks whether there are large gaps between the initial earnings of immigrants starting with low- or high-paying firms, and whether the initial earnings gaps narrow with increasing length of residence in Canada. It further examines whether earnings returns to human capital among immigrants are larger if they start working in high-paying firms than in low-paying firms.
This paper uses data from the Canadian Employer-Employee Dynamics Database (CEEDD) developed by Statistics Canada. The analytical file for this study draws on four sources of administrative data: the T4 Statement of Remuneration Paid File, the T1 Personal Master File, the Longitudinal Employment Analysis Program (LEAP), and the Immigrant Landing File. The study sample includes about 420,000 immigrants who landed in Canada from 1998 to 2001, were aged 20 to 49 at time of landing, and had annual employment T4 earnings more than $1,000 (in 2012 Canadian dollars) in at least one year from 1999 to 2012.
The main outcome variable is the log annual employment earnings while the independent variable of main interest is the firm in which immigrants were initially employed after becoming permanent residents in Canada. This variable is divided into three groups according to firms’ annual median payment to employees: low-, medium-low- and high-paying firms. Low-paying firms include those with median employment earnings at or under the 25th percentile among all firms, medium-low-paying firms include those with median employment earnings in the 25th to 50th percentiles, and high-paying firms include those in the upper 50th percentile. The control variables include age at landing, marital status, immigration class, cohort, source region, education at landing, full- or part-time schooling, initial residential census metropolitan area (CMA) or province, mother tongue and official language, starting year of employment, industry, and firm size.
Results show that the first paid employment of immigrants either in low-, medium-low- or high-paying firms in Canada is a strong predictor of their long-term labour market outcomes. Immigrants starting in high-paying firms, in particular, had higher initial and long-term earnings than immigrants starting in low-paying firms, even after taking differences in individual demographic and human capital factors into consideration. This earnings advantage likely originated from a better matching between skills and job requirements and a higher selectivity in skills and abilities beyond general human capital among immigrants starting in high-paying firms, as well as the better opportunities these firms can offer new immigrants.
This study further finds that earnings returns to general human capital (education and host-country languages) were much larger both in the short and long term among immigrants starting in high-paying firms than among those starting in low-paying firms. Furthermore, immigrants with high levels of human capital starting in low-paying firms earned less than immigrants with low levels of human capital starting in high-paying firms in the first few years after landing. However, the earnings growth of the former group outpaced that of the latter group. This suggests that, in the long term, the effect of a high level of human capital outweighs the initial advantage of low-skilled immigrants who started in high-paying firms.
1 Introduction
Canada’s economic immigration policy has been undergoing substantial changes that include increasing involvement of employers in selecting economic immigrants. Yet little is known about whether and how the characteristics of employers who select immigrants are associated with immigrant labour market outcomes in the short and long term. As a first step to provide relevant empirical evidence, this study asks whether there are large gaps between the initial earnings of immigrants starting with low- and high-paying firms, and whether the initial earnings gaps narrow with increasing length of residence in Canada.
The characteristics of the firms in which immigrants initially find employment may be strongly associated with the economic outcomes of immigrants for several reasons. First, immigrants are chosen by firms based on their general human capital (e.g., education, work experience and language), specific occupational skills, and other wage-enhancing traits such as motivation and social skills. Immigrants selected by high-paying firms may be more likely to have skills that are highly rewarded by the labour market than those selected by low-paying firms. Second, even among immigrants with similar levels of educational attainment and work experience, those selected by high-paying firms may have greater opportunity to use and develop their skills and to achieve earnings growth through internal promotion and advancement. And third, in the event of job termination, immigrants from higher-paying firms may have greater opportunity to move on to better job prospects elsewhere, while immigrants from low-paying firms have fewer opportunities if their initial employment in a low-paying firm is regarded as a signal of poor skill or ability by other potential employers and thus limit their job search choices and bargaining position.
Quantifying the empirical association between employers’ characteristics and immigrant economic outcomes in both the short and long term has important social and policy implications. The types of firms that potential immigrants are being selected into could be a pertinent indicator, in addition to common human capital factors, of immigrants’ potential to do well in the Canadian labour market.
Few empirical studies have examined the association between the characteristics of employers who select or sponsor immigrants and immigrants’ labour market outcomes. Previous Canadian studies tended to focus on the effects of immigrants’ individual human capital factors, such as education, language, foreign work experience and Canadian work experience on their earnings and how changes in these characteristics affect trends in immigrant earnings (Aydemir and Skuterud 2005; Bloom, Grenier and Gunderson 1995; Frenette and Morissette 2005; Hou 2013; Reitz 2007; Schaafsma and Sweetman 2001). Other studies have explored how distribution and mobility across firms are related to immigrant earnings and earnings gaps between immigrants and non-immigrants, and how certain firm characteristics such as co-ethnic concentration are related to immigrant earnings (Aydemir and Skuterud 2008; Barth, Bratsberg and Raaum 2012; Hou 2009; Tomaskovic-Devey, Hallsten and Avent-Holt 2015). These studies analyze firms where immigrants currently work (mostly many years after immigration), which are not directly relevant to the match between immigrants and Canadian employers before or at the time of immigration.
This study examines the association between the characteristics of the initial firm where immigrants started working after arriving in Canada and immigrants’ earnings growth. Although the majority of immigrants to Canada were not selected by Canadian employers and their initial firms do not consequently represent firms that would select immigrants from abroad, initial firm allocation is the result of Canadian employers selecting new immigrants based on their common human capital factors, job-specific skills, and other qualifications that employers can individually evaluate. Accordingly, the characteristics of initial firms largely capture the extent to which new immigrants’ skills and abilities are validated and valued by Canadian employers. This study focuses on one specific, albeit important, characteristic of the initial firm—the median payment to its employees—which is a simple yet comprehensive measure of a firm’s productivity and its employees’ economic well-being, and is easily observable.
This study asks whether there are large gaps between the initial earnings of immigrants starting to work in low- or high-paying firms, and whether this initial earnings gap narrows with increasing length of residence in Canada when the differences in commonly observed human capital factors are taken into account. It further examines whether earnings returns to human capital among immigrants are larger if they start in high-paying firms than low-paying firms.
The remainder of this paper is presented in four sections. Section 2 reviews the literature on the effects of firm allocation on immigrant earnings. Section 3 discusses the data source, measures, and analytical approaches. Section 4 presents descriptive statistics and multivariate analysis results. Section 5 concludes the paper.
2 Firms and immigrant labour markets
A strand of research has examined the extent to which the earnings gap between immigrants and non-immigrants originates from within-firm pay differentials or differential allocation across firms (e.g., Aydemir and Skuterud 2008; Barth, Bratsberg and Raaum 2012; Pendakur and Woodcock 2010). These two sources of the earnings gap between immigrant and non-immigrant workers have distinct mechanisms and policy implications. Within-firm pay differentials may arise from lower productivity among immigrants due to lack of certain job-specific skills, immigrants’ difficulty signaling their productivity, shorter tenure or discrimination. Differential allocation across firms may result from immigrants’ concentration in ethnic enclaves or large metropolitan areas where low-wage firms are more prevalent, their limited information and knowledge about alternative employers, or their signaling disadvantages in the sense that native-born employers are uncertain about foreign-acquired education and work experience (Aydemir and Skuterud 2008; Barth, Bratsberg and Raaum 2012).
Using cross-sectional, employer–employee linked survey data, several previous studies have provided empirical evidence on the role of firm allocation in the earnings gap between immigrants and non-immigrants. Aydemir and Skuterud (2008) showed that immigrant men’s concentration in low-wage establishments within Canada’s major cities and regions contributed more to the earnings gap between male immigrant and Canadian-born workers than within-establishment pay differentials. Immigrant women, however, experienced a low level of concentration in low-wage establishments but a relatively large within-establishment wage disadvantage. Using the same Canadian data but a different method of identifying the effect of sorting across establishments, Pendakur and Woodcock (2010) found that both immigrant male and female workers faced substantial concentration in low-paying firms, and inter-firm sorting accounted for one-quarter to one-half of their overall wage gaps relative to Canadian-born workers. Javdani and McGee (2013) also used the same Canadian data and found that newly arrived female visible minority immigrants were disproportionately employed in firms offering limited opportunities for advancement. Furthermore, they demonstrated that immigrants—particularly newly-arrived visible minority immigrants—are less likely to be promoted in the economy as a whole because they are less likely to be promoted within any given firm.
The studies by Aydemir and Skuterud (2008) and Pendakur and Woodcock (2010) both showed that the likelihood of working in a higher-paying firm increases with the number of years immigrants have resided in Canada, and suggested that mobility into better-paying firms is an important pathway towards immigrant wage growth. However, Barth, Bratsberg and Raaum (2012) argued that the comparison of longer-term and recent immigrants in cross-sectional data fails to separate assimilation effects from cohort differences in firm allocation. They demonstrated that, after controlling for immigrant arrival cohort heterogeneity, there was little indication of favourable job mobility among immigrants. While early arrival cohorts tended to work in better-paying firms than recent-arrival cohorts, immigrants generally did not advance to high-paying firms over time at the rate of the native-born. As a result, the wage gap between immigrants from developing countries and native-born workers expanded with years in Norway, and about 40% of the wage gap was attributable to the fact that immigrants worked and stayed in low-paying firms (Barth, Bratsberg and Raaum 2012). Furthermore, Barth, Bratsberg and Raaum (2012) found that immigrants in Norway received similar wage returns to experience and seniority within establishments as native-born workers. They took these results to imply that limited access to better-paying jobs, likely due to preference-based hiring practices, is the main driver of the widening earnings gap between immigrants and non-immigrants in Norway, while immigrants’ lack of information about the host-country labour market, language barriers and inferior promotions within firms played a minor role. In contrast, using linked employer–employee longitudinal data, Eliasson (2013) found that, in Sweden, immigrants’ wage growth relative to the native-born came almost entirely from higher wage growth within workplaces, but that there was no wage catch-up from workplace mobility. This suggests that, at least in Norway, immigrants experience larger wage gains over time as employers learn more about individuals’ productivity and on-the-job performance.
Other studies have examined whether and how certain firm characteristics are associated with immigrants’ labour market performance. One characteristic that has attracted attention is the workplace concentration of immigrants. Immigrants working in firms with a high concentration of their co-ethnics have been shown to have lower earnings and slower earnings growth than immigrants in firms with lower concentrations of co-ethnics (e.g., Fong and Hou 2013; Hou 2009). However, using Swedish data, Tomaskovic-Devey, Hallsten and Avent-Holt (2015) found that wage differences between immigrant and native-born blue-collar workers were smaller in workplaces with a larger presence of immigrants, and that the wage differences between immigrant and native-born white-collar workers were smaller in workplaces with more immigrant managers. Additional studies have also considered the effects of union membership, firm size, industries and broad geographic regions where the firm is located (Aydemir and Skuterud 2008; Barth, Bratsberg and Raaum 2012). Nevertheless, these firm characteristics have mostly been investigated in a cross-sectional setting. As a consequence, little is known about how characteristics of the initial firms where immigrants started working in the host country are associated with immigrant longer-term labour market outcomes.
Note that it goes beyond the scope of this paper to establish clear mechanisms through which the initial allocation to low- or high-paying firms is linked with immigrant earnings trajectories. Low-paying firms might directly hamper immigrants’ career development because of limited promotion opportunities and training resources for their employees. The returns to work experience accumulated from low-paying firms could be low, making it difficult for immigrants to move to higher-paying firms. Alternatively, immigrants with fewer skills or less motivation may be more likely to be hired by and remain in low-paying firms. It is possible that these two mechanisms are at work at the same time.
This paper begins analysis by examining how common human capital factors could explain the initial allocation of immigrants across low-, medium-low- and high-paying firms. The overall prediction power of commonly observed individual characteristics on immigrants’ initial firm allocation was limited. This suggests that immigrant initial firm allocation may reflect unobserved characteristics of immigrants necessary for career success. This study goes on to examine the earnings growth patterns among immigrants initially working in low-, medium-low- and high-paying firms. Finally, this study examines whether returns to immigrant education and language differ by initial firm allocation.
3 Data and methods
3.1 Data
This paper uses data from the Canadian Employer-Employee Dynamics Database (CEEDD) developed by Statistics Canada. The analytical file used for this paper draws information from four administrative datasets, including the T4 Statement of Remuneration Paid File, the T1 Personal Master File, the Immigrant Landing File (ILF) and firm-level data from the Longitudinal Employment Analysis Program (LEAP). Observations in the first three datasets were linked using social insurance numbers (SINs), while LEAP information was attached to individual-level records using the longitudinal business register identification numberNote 1. The T4 File contains variables on various sources of earnings reported by employers to the Canada Revenue Agency, while the T1 Personal Master File includes basic demographic characteristics of individuals who file taxes in a given year. The ILF provides immigrant sociodemographic characteristics measured at the time of landing among immigrants who landed in Canada from 1980 to 2011. Firm-level data include both public and private establishments, which are all referred to as “firm” in this paper.
The study sample is restricted to immigrants who landed in Canada from 1998 to 2001, were aged 20 to 49 at the time of landing, and had annual T4 earnings of more than $1,000 (in 2012 Canadian dollars) in at least one year from 1999 to 2012Note 2. About 490,500 immigrants aged 20 to 49 at landing who arrived in Canada from 1998 to 2001 were identified from the landing records, among whom 418,800 earned a positive employment income of more than $1,000 in at least one year during the reference period. Immigrants are tracked over years starting from their first full year in CanadaNote 3 and their multi-year observations are pooled to estimate their earnings growth.
The outcome variable in the analysis is annual employment earnings, while the independent variable of interest is the firm in which immigrants were initially employed after landing in Canada. This variable is divided into three groups according to firms’ annual median payment to employees, defined as low-, medium-low-, and high-paying firmsNote 4. Low-paying firms are those with median employment earnings at or under the 25th percentile among all firms, medium-low- paying firms are those with median employment earnings from the 25th to 50th percentiles, and high-paying firms are those from over the 50th to 100th percentileNote 5. The median annual employment earnings of workers were lower than $11,000 (in 2012 constant dollars) in low-paying firms, between $11,000 and $21,000 in medium-low-paying firms, and over $21,000 in high-paying firms. About 41% of immigrant men who landed from 1998 to 2001 and were aged 20 to 49 found their first employment in low- (17%) or medium-low- (24%) paying firms. In comparison, only 27% Canadian-born workers aged 20 to 49 worked in low- or medium-low-paying firms. Among immigrant women, 58% were initially employed in low- or medium-low- paying firms, compared to a much smaller share among their Canadian-born peers at 38%.
Owing to the absence of information on working hours, it is not possible to distinguish full-time, part-time, permanent and temporary workers. Thus, a low-paying firm defined here could be a low-wage firm or a firm employing a relatively high proportion of part-time or temporary workers. This is not a major issue for this study since its focus is on the overall employment conditions in the initial firm, with a prevalence of low-wages, part-time jobs or high job turnover all indicative of poorer economic outcomes among employees.
Although minimal attrition exists in the administrative data, it remains a concern that not all immigrants had paid employment every year after landing. First, it could take years for some immigrants to find their first paying job in Canada. More particularly, about 78% of immigrant men and 63% of immigrant women started working for companies in the first full year after landing; others found employment in later years. This study includes the year in which immigrants started their career in Canada in econometric models as a way to control for heterogeneity potentially associated with the year of entering the host-country labour market. Second, immigrants’ paid employment is not necessarily continuous as some immigrants might drop out of the labour market in some of the tracking years either due to unemployment or leaving the labour force. These sample attrition issues will be examined in the robustness-check section.
3.2 Methods
This study first asks what factors are associated with the initial allocation of immigrants into firms with different levels of median annual payments to workers. To estimate the discrete dependent variable with values of 1 to 3 measuring initial employment in low-, medium-low- and high-paying firms, the following multinomial logistic regression model is used:
where the probability of being in each type of firm depends on the selected individual characteristics and the vector of coefficients corresponding to the alternatives 1 and 2. The reference group is initial employment in high-paying firms with y = 3. Covariates include age at landing, marital status, immigration class, source region, education, geographic region (major census metropolitan area [CMA] or province), cohort, and mother tongue and official languageNote 6. The subscript represents individuals. McFadden pseudo (1974, 1979) is used to evaluate the model’s goodness of fit. The value of the pseudo between 0.2 and 0.4 is commonly regarded as a rule of thumb for a good-fit model. All analyses are carried out for men and women separately.
To address the main goal of this study, the following model is constructed to determine whether there are disparities in employment earnings in both the short- and longer-term between immigrants starting their careers in disadvantaged firms (low-paying and medium-low-paying firms) and those in high-paying firms:
The dependent variable, , represents the natural log annual employment earnings of immigrantsNote 7. and are variables of interest representing low-paying and medium-low-paying firms, respectively, with high-paying firms as the common reference group. represents years since landing equaling the tax year minus the landing yearNote 8. The vector consists of other individual characteristics including age at landing, marital status, immigration class, cohort, source region, education at landing, full- or part-time schooling, initial residential CMA or province, mother tongue and official language, starting year of employment, industry, and firm size.
When all the covariates are held constant, the gap in log earnings between immigrants who were initially employed in low-paying firms and those in high-paying firms is , which is determined by coefficients , , , and as well as time spent in Canada. Similarly, captures the earnings gap between those initially hired by medium-low-paying and high-paying firms in a given year after landing. The inclusion of the cubic function of (i.e., the squared and cubic terms) and allowing each immigrant group by initial firm allocation to have their unique cubic function captures their observed earnings trajectories better than the commonly-used quadratic function (i.e., without the cubic term)Note 9.
4 Results
4.1 Initial employment in lower-paying firms
This section compares immigrants who started their initial employment in low-, medium-low- or high-paying firms along several dimensions: age at landing, gender, marital status, language, education, immigration class, and first entry year into paid employment after landing. Table 1 lists summary statistics for these variables. Immigrants who started in low-paying firms were more likely to be older and not married, with lower educational attainment and poorer official language proficiency, and not in the principal skilled-worker class like their counterparts starting in high-paying firms. Around 65% of immigrant men starting in lower-paying firms found their first paid job in the first full year after arrival, compared with 83% among those starting in high-paying firms.
These observations were generally confirmed in multivariate analyses. Table 2 presents odds ratios from multinomial logistic models for men and women separately to show the effect of a given explanatory variable on the relative likelihood of immigrants starting in low- or medium-low-paying firms over working in high-paying firms (after controlling for other included variables).
Several distinct patterns are observed using the estimates. First, there was a strong effect of age at landing for both men and women. Immigrants who landed at age 25 to 29 had the lowest likelihood of initially working in low-paying firms, followed by those at age 30 to 34. Immigrants who landed at age 20 to 24 and those at age 35 to 39 had similarly low likelihoods of starting in low-paying firms. The relative risks of starting in low-paying firms increased beyond age 40 at landing (Table 2). Second, common human capital factors that are generally associated with successful economic outcomes among immigrants also played a significant role in affecting their initial firm allocation. Immigrants whose mother tongue was English were least likely to start in low-paying firms. Higher educational attainment was associated with a lower likelihood of starting in low- or medium-low-paying firms. Among immigrant classes, skilled-worker principal applicants (the reference group) had the lowest likelihood, while business class had the highest likelihood of starting in low-paying firms. Third, immigrants who started with low-paying firms tended to begin their paid employment in later years after landing than other immigrants. That is, immigrants who found their initial jobs in high-paying firms often did so immediately after landing, while immigrants who found their initial jobs in low-paying firms were more likely to have waited to take a job or to have experienced longer job searches in the years after landing.
To what extent did the observed characteristics of immigrants account for the probability of their initial employment in low-, medium-low- or high-paying firms in the Canadian labour market? The pseudo R-squared of the multinomial logistic model for both sexes was around 0.05, which is well-below the accepted rule of 0.2 to 0.4 for a good fit. This indicates that, overall, the observed characteristics of immigrants explained little about the initial employment of new immigrants across low-, medium-low- or high-paying firms. Thus, initial firm allocation is very likely determined by immigrants’ transferability of foreign skills and the match between individual-specific skills and employers’ job requirements—factors that are not sufficiently captured by conventional human capital factors, but might be better known by employers.
4.2 Earnings growth trajectory
Charts 1 and 2 present earnings trajectories from the first full year to the fourteenth year after landing for immigrant men and women respectively by initial firm allocation. Immigrant men starting in low-paying or medium-low-paying firms in the first full year after landing earned, on average, about $20,000 to $25,000 less than those who started in high-paying firms, and these observed earnings differences persisted over the next 14 years. Similar patterns are observed among immigrant women. These results do not take into account observed differences, such as age or educational attainment.
Table 3 reports the results of the regression models which examine the association between initial firm allocation and log earnings growth, while taking into account differences in observed characteristics. The models are estimated separately for men and women. For each sex, three models are estimated. Model 1 includes initial firm type, landing cohort, years since landing, the squared and cubic functions of years since landing, and the interaction between the initial firm type and years since landing as well as the squared and cubic functions of years since landing. Model 2 adds in individual characteristics of immigrants, and Model 3 further includes firm size, industry and further postsecondary education for the year in which the earnings were observed.
The annual earnings advantages of immigrants starting in high-paying firms were reduced but did not disappear as the selected individual and firm-related characteristics were added from Model 1 to Model 3. This suggests that some of the earnings disparity between groups were attributed to the included characteristics, yet the remaining earnings gap remained large. The estimated coefficients of the low-paying ( ) variable were -0.751 for men and -0.667 for women based on Model 3, indicating that immigrants starting in low-paying firms earned significantly less upon landing (i.e., ) than their counterparts in high-paying firms. Put differently, male immigrants initially employed in low-paying firms initially received annual earnings roughly 53% ( ) less than their observationally equivalent counterparts initially employed in high-paying firms. Female immigrants initially employed in low-paying firms earned 49% less ( ) their observationally counterparts initially employed in high-paying firms. The corresponding earnings gaps for male and female immigrants initially employed in medium-low-paying firms were 28% ( ) and 24% ( ) lower, respectively, than their observationally equivalent counterparts initially employed in high-paying firms.
The relative disparities in earnings by initial firm allocation narrowed with years in Canada, as indicated by the significant and positive interaction term between low-paying firms and years since immigration. However, the absolute earnings differences between the three groups of immigrants changed little. Charts 3 and 4 show the estimated earnings trajectories of immigrant men and women initially employed in low-, medium-low- and high-paying firms based on Model 3 in Table 3. Clearly the differences in absolute earnings persisted as immigrants resided in Canada over time. Relative to immigrants starting in high-paying firms, observationally equivalent immigrant men initially employed in low-paying firms were estimated to earn almost $11,000 less in the first year after landing, with this earnings gap decreasing to about $8,600 after 14 years in Canada. For men initially employed in medium-low-paying firms, the earnings gap increased from approximately $6,000 in the first year to $7,000 by the fourteenth year. The patterns were similar for immigrant women. The earnings difference between immigrant women starting in low- and high-paying firms was approximately $6,000 in the first year after landing and $5500 in the fourteenth year. Among immigrant women starting in medium-low-paying firms, these differences were about $3,000 and $5,000 in the first and fourteenth years respectively. These estimates indicate that immigrants starting in lower-paying firms had lower earnings in both the short and long term.

Description for Chart 1
| Initially in low-paying firm | Initially in medium-low-paying firm | Initially in high-paying firm | |
|---|---|---|---|
| 1 | 10,641 | 16,564 | 35,360 |
| 2 | 15,223 | 20,936 | 41,197 |
| 3 | 18,875 | 24,363 | 44,274 |
| 4 | 21,972 | 27,076 | 46,954 |
| 5 | 25,016 | 30,055 | 49,870 |
| 6 | 28,143 | 33,133 | 53,150 |
| 7 | 31,008 | 35,896 | 55,888 |
| 8 | 33,242 | 38,136 | 58,074 |
| 9 | 35,052 | 39,739 | 59,712 |
| 10 | 36,506 | 41,107 | 61,018 |
| 11 | 37,741 | 42,459 | 62,161 |
| 12 | 37,897 | 41,987 | 63,124 |
| 13 | 37,344 | 42,296 | 63,461 |
| 14 | 38,293 | 41,661 | 63,558 |

Description for Chart 2
| Initially in low-paying firm | Initially in medium-low-paying firm | Initially in high-paying firm | |
|---|---|---|---|
| 1 | 8,415 | 12,523 | 24,446 |
| 2 | 11,441 | 15,082 | 28,108 |
| 3 | 13,958 | 17,236 | 30,057 |
| 4 | 16,079 | 19,044 | 31,946 |
| 5 | 18,103 | 21,017 | 33,988 |
| 6 | 20,260 | 22,987 | 36,266 |
| 7 | 22,176 | 24,814 | 38,576 |
| 8 | 24,018 | 26,825 | 40,799 |
| 9 | 25,652 | 28,348 | 42,708 |
| 10 | 26,866 | 29,686 | 44,404 |
| 11 | 28,045 | 30,767 | 45,742 |
| 12 | 28,427 | 31,234 | 46,528 |
| 13 | 28,786 | 31,804 | 47,312 |
| 14 | 29,547 | 31,990 | 47,047 |
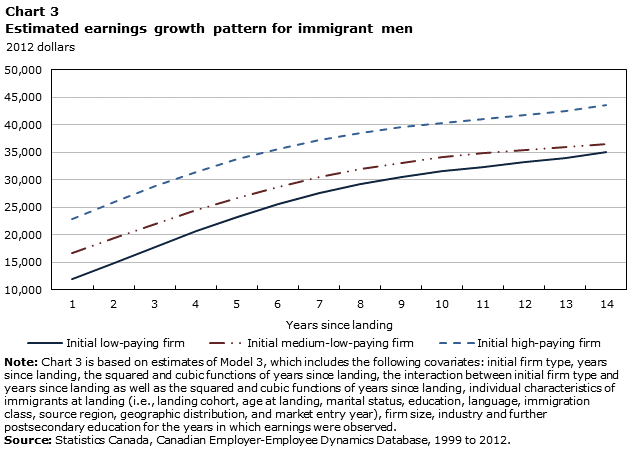
Description for Chart 3
| Initial low-paying firm | Initial medium-low-paying firm | Initial high-paying firm | |
|---|---|---|---|
| 1 | 11,969 | 16,712 | 22,847 |
| 2 | 14,857 | 19,352 | 25,942 |
| 3 | 17,797 | 21,937 | 28,834 |
| 4 | 20,647 | 24,390 | 31,444 |
| 5 | 23,283 | 26,645 | 33,721 |
| 6 | 25,614 | 28,655 | 35,644 |
| 7 | 27,591 | 30,396 | 37,221 |
| 8 | 29,207 | 31,859 | 38,488 |
| 9 | 30,494 | 33,059 | 39,498 |
| 10 | 31,516 | 34,025 | 40,322 |
| 11 | 32,362 | 34,799 | 41,042 |
| 12 | 33,134 | 35,434 | 41,747 |
| 13 | 33,952 | 35,988 | 42,534 |
| 14 | 34,944 | 36,525 | 43,507 |

Description for Chart 4
| Initial low-paying firm | Initial medium-low-paying firm | Initial high-paying firm | |
|---|---|---|---|
| 1 | 8,162 | 11,045 | 14,330 |
| 2 | 9,939 | 12,501 | 16,032 |
| 3 | 11,761 | 13,971 | 17,730 |
| 4 | 13,561 | 15,433 | 19,395 |
| 5 | 15,280 | 16,862 | 21,003 |
| 6 | 16,871 | 18,236 | 22,531 |
| 7 | 18,307 | 19,538 | 23,961 |
| 8 | 19,577 | 20,752 | 25,280 |
| 9 | 20,690 | 21,869 | 26,478 |
| 10 | 21,673 | 22,883 | 27,552 |
| 11 | 22,564 | 23,793 | 28,504 |
| 12 | 23,415 | 24,603 | 29,340 |
| 13 | 24,287 | 25,320 | 30,068 |
| 14 | 25,251 | 25,953 | 30,702 |
4.3 Returns to education and language proficiency by initial firm allocation
Do the short- and long-term earnings advantage associated with starting in high-paying firms differ by education and host-country language proficiency? Put differently, are returns to general human capital higher among immigrants starting in higher-paying firms? As noted earlier, two possible mechanisms may contribute to this. The first pertains to selection, as immigrants initially employed in high-paying firms likely have better abilities and skills beyond general human capital and lower likelihood of being overqualified for their job than immigrants in low-paying firms. The second pertains to skills usage and development, as high-paying firms may provide greater opportunity for immigrants to use and develop their skills. In both cases, immigrants with higher levels of human capital may be more likely than other immigrants to benefit from employment in high-paying firms, and one might expect earnings differences between high- and low-paying firms to be largest among immigrants with high levels of human capital.
To examine this issue, Model 3 in Table 3 was estimated separately by education. The results are plotted to compare immigrants with a bachelor’s degree and those with only a high school diploma in Chart 5 for men and in Chart 6 for women. Similarly, Model 3 was estimated separately by official-language ability. Charts 7 and 8 compare the results for immigrants whose mother tongue is English or French and for those who did not speak English or French at the time of landing.
As expected, the earnings gap between immigrants with a bachelor’s degree and those with high school was indeed larger among those initially employed in high-paying firms (Charts 5 and 6). In the first year after landing, the ‘university–high school’ difference was approximately $7,000 among immigrant men in high-paying firms and approximately $1,800 among those in low-paying firms. Over time, the magnitude of this difference remained larger among immigrants from high-paying firms.
It is also clear from Charts 5 and 6 that among immigrants with a bachelor’s degree, the earnings difference between those initially employed in high- or low-paying firms remained large and persistent over the 14-year reference period. This persistent gap is consistent with the view that among immigrants with a bachelor’s degree there are significant differences in skills and abilities that are not captured by educational attainment (i.e., unobserved characteristics), and that these unobserved characteristics contributed to the initial sorting of immigrants into high- and low-paying firms and to sustained earnings differentials over the longer term. However, it is also possible that the persistent earnings gap between immigrant bachelor’s degree holders initially employed in high- and low-paying firms is attributable to barriers preventing those starting in low-paying firms from catching up. This could include loss of skills resulting from under-employment, or reduced attractiveness to prospective higher-paying employers resulting from negative signals associated with low-wage employment or job turnover.
It is also clear from Charts 5 and 6 that immigrants with a bachelor’s degree starting in low-paying firms earned less than high-school graduates starting in high-paying firms in the first few years after landing. However, by the fourth year, the former group outpaced the latter in earnings growth. This suggests that the long-term advantage of higher education was larger than the initial advantage of less-educated immigrants due to their other abilities or opportunities that high-paying firms had to offer.
Finally, among immigrants with high school or less, the earnings gap by initial firm allocation decreased over time. For less-educated immigrants, the advantage of starting in high-paying firms may reflect differences in both selectivity and opportunities.
Similar patterns are observed from the results of model estimates by official language ability (Charts 7 and 8). The earnings advantage of English or a French mother tongue relative to not speaking either language was larger among immigrants starting in high-paying firms than among those starting in low-paying firms. Among immigrants whose mother tongue is English or French, the earnings gap by initial firm allocation decreased only slightly over 14 years after landing. Among immigrants who did not speak English or French, the earnings gap by initial firm allocation decreased over time among men, but changed little among women. Finally, immigrants whose mother tongue is English or French who started in low-paying firm did not have any earnings advantage in the initial years after landing than immigrants who did not speak English or French. However, the former group had a higher earnings growth and earned more than the latter after 3 years among men and after 2 years among women.

Description for Chart 5
| Low-paying firm, high school or less | High-paying firm, high school or less | Low-paying firm, bachelor's degree | High-paying firm, bachelor's degree | |
|---|---|---|---|---|
| 1 | 10,512 | 17,822 | 12,344 | 25,089 |
| 2 | 12,508 | 19,718 | 15,767 | 28,841 |
| 3 | 14,462 | 21,373 | 19,373 | 32,407 |
| 4 | 16,302 | 22,761 | 22,980 | 35,679 |
| 5 | 17,970 | 23,882 | 26,405 | 38,575 |
| 6 | 19,434 | 24,762 | 29,495 | 41,052 |
| 7 | 20,686 | 25,441 | 32,139 | 43,100 |
| 8 | 21,739 | 25,977 | 34,283 | 44,745 |
| 9 | 22,627 | 26,435 | 35,924 | 46,040 |
| 10 | 23,403 | 26,888 | 37,110 | 47,059 |
| 11 | 24,127 | 27,414 | 37,922 | 47,893 |
| 12 | 24,873 | 28,096 | 38,469 | 48,643 |
| 13 | 25,722 | 29,028 | 38,876 | 49,418 |
| 14 | 26,770 | 30,322 | 39,273 | 50,335 |

Description for Chart 6
| Low-paying firm, high school or less | High-paying firm, high school or less | Low-paying firm, bachelor's degree | High-paying firm, bachelor's degree | |
|---|---|---|---|---|
| 1 | 7,190 | 11,345 | 8,776 | 16,687 |
| 2 | 8,429 | 12,357 | 11,026 | 18,944 |
| 3 | 9,661 | 13,331 | 13,389 | 21,213 |
| 4 | 10,853 | 14,256 | 15,768 | 23,449 |
| 5 | 11,975 | 15,128 | 18,068 | 25,612 |
| 6 | 13,008 | 15,942 | 20,211 | 27,665 |
| 7 | 13,943 | 16,701 | 22,143 | 29,579 |
| 8 | 14,780 | 17,407 | 23,839 | 31,333 |
| 9 | 15,531 | 18,069 | 25,304 | 32,912 |
| 10 | 16,214 | 18,694 | 26,568 | 34,312 |
| 11 | 16,856 | 19,297 | 27,684 | 35,535 |
| 12 | 17,489 | 19,892 | 28,724 | 36,591 |
| 13 | 18,152 | 20,494 | 29,774 | 37,497 |
| 14 | 18,889 | 21,124 | 30,934 | 38,273 |

Description for Chart 7
| Low-paying firm, English or French mother tongue | High-paying firm, English or French mother tongue | Low-paying firm, do not speak English or French | High-paying firm, do not speak English or French | |
|---|---|---|---|---|
| 1 | 16,297 | 32,477 | 10,328 | 17,549 |
| 2 | 19,515 | 35,772 | 12,848 | 20,192 |
| 3 | 22,701 | 38,792 | 15,410 | 22,674 |
| 4 | 25,730 | 41,486 | 17,888 | 24,915 |
| 5 | 28,501 | 43,830 | 20,170 | 26,862 |
| 6 | 30,947 | 45,820 | 22,173 | 28,492 |
| 7 | 33,040 | 47,479 | 23,855 | 29,811 |
| 8 | 34,788 | 48,847 | 25,208 | 30,851 |
| 9 | 36,233 | 49,980 | 26,262 | 31,664 |
| 10 | 37,443 | 50,944 | 27,074 | 32,317 |
| 11 | 38,508 | 51,817 | 27,722 | 32,886 |
| 12 | 39,532 | 52,682 | 28,299 | 33,457 |
| 13 | 40,634 | 53,627 | 28,906 | 34,120 |
| 14 | 41,945 | 54,749 | 29,654 | 34,974 |

Description for Chart 8
| Low-paying firm, English or French mother tongue | High-paying firm, English or French mother tongue | Low-paying firm, do not speak English or French | High-paying firm, do not speak English or French | |
|---|---|---|---|---|
| 1 | 10,546 | 20,201 | 7,016 | 10,807 |
| 2 | 12,788 | 21,910 | 8,439 | 12,262 |
| 3 | 15,002 | 23,580 | 9,903 | 13,710 |
| 4 | 17,093 | 25,196 | 11,361 | 15,123 |
| 5 | 18,992 | 26,741 | 12,770 | 16,476 |
| 6 | 20,661 | 28,205 | 14,091 | 17,747 |
| 7 | 22,093 | 29,580 | 15,299 | 18,922 |
| 8 | 23,314 | 30,859 | 16,377 | 19,993 |
| 9 | 24,378 | 32,041 | 17,322 | 20,957 |
| 10 | 25,358 | 33,128 | 18,140 | 21,816 |
| 11 | 26,346 | 34,124 | 18,851 | 22,582 |
| 12 | 27,447 | 35,035 | 19,478 | 23,266 |
| 13 | 28,788 | 35,872 | 20,055 | 23,886 |
| 14 | 30,521 | 36,647 | 20,620 | 24,465 |
4.4 Robustness check
As discussed earlier, immigrants who started working in low-paying firms tended to delay their entry into the labour market and have fewer years of employment than immigrants who started in high-paying firms. In addition, about 12.4% of immigrants who started in high-paying firms did not receive employment earnings in the following year, compared with a much higher interruption rate of 24.9% among immigrants starting in low-paying firms. The different disruption and attrition patterns by initial firm allocation may bias the estimated earnings growth.
One simple way to address the attrition bias is to restrict the study sample to immigrants who were tracked for at least 8 years over the 14-year period. The earnings models were estimated on the restricted sample and the results are shown in Table 4. These results are similar to those based on the overall sample presented in Table 3. It is possible that the self-selection associated with attrition was largely captured by the included individual and work-related characteristics.
Further analysis was conducted for immigrants who were principal applicants in the skilled-worker class. These immigrants were selected under the points system. The results were generally in line with those obtained for all immigrants, although initial firm allocation had a stronger effect for principal applicants. Specifically, when individual demographic characteristics and firm-level covariates were controlled for in the model, male skilled-worker principal applicants starting in low-paying firms had roughly a $15,000 earnings disadvantage relative to their counterparts who started in high-paying firms, and the gap narrowed slightly to $13,000 by the end of the 14th year. Similarly, the earnings of those who initially worked in medium-low-paying firms were around $9,000 lower than those of their peers who started in high-paying firms at the beginning, and the gap increased to around $11,000 at the end of the 14-year period.
Some might raise concerns that the better earnings trajectories of immigrants starting in high-paying firms might be driven by their initial employment in the high-paying public administration industries. However, the estimation results are barely affected when the study sample is restricted to those who started their career in private firms in Canada. This could be due to the fact that only a small proportion of immigrants can find their first job in the public service industry as citizenship is generally a priority in the process of government hiring and it takes several years for new immigrants to obtain their citizenship status.
Furthermore, descriptive statistics were produced to show earnings trajectories among immigrant men and women, respectively, by initial firm allocation within each of the following major industrial sectors: manufacturing; wholesale and retail trade; information and cultural industries; finance and insurance; real estate; professional, scientific and technical services; administrative and support; educational services; health care; public administration; and accommodation and food services. In general, the pattern of earnings growth by initial firm allocation for both immigrant men and women in all industries combined, as illustrated in Charts 1 and 2, was also observed within each major industrial sector, with some noticeable variations. For both genders, the earnings gap between immigrants who started in high-paying firms and those who started in low-paying firms was the largest in the broad sector of information and cultural industries; finance and insurance; real estate; and professional, scientific and technical services; and lowest in the accommodation and food services sector. In most of the major industrial sectors, the absolute earnings gap by initial firm allocation changed little with more years after immigration. However, in the educational services, health care, and public administration sectors, the absolute earnings gap between immigrants starting in low-paying firms and high-paying firms expanded over time. In comparison, the earnings gap between immigrants starting in low-paying and those in medium-low-paying firms disappeared about six years after immigration for both immigrant men and women in the sector of accommodation and food services, and about eight years after immigration for immigrant women in the manufacturing industry.
5 Conclusion
Canada’s economic immigration policy has been undergoing substantial changes that include increasing involvement of employers in selecting economic immigrants. Yet little is known about whether and how the characteristics of employers who select immigrants are associated with immigrant labour market outcomes in the short and long term. As a first step to provide relevant empirical evidence, this study asks whether there are large gaps between the initial earnings of immigrants starting with low- and high-paying firms, and whether the initial earnings gaps narrow with increasing length of residence in Canada. Although initial firms where immigrants started their work in Canada do not necessarily represent firms that would select immigrants from abroad, initial firm allocation is the result of Canadian employers selecting newly arrived immigrants based on their human capital factors, job-specific skills, and other qualifications that the employers can individually evaluate. This study argues that the characteristics of initial firms largely reflect the extent to which new immigrants’ skills and abilities are validated and valued by Canadian employers.
Results show that the first paid employment of immigrants either in low-, medium-low- or high-paying firms in Canada is a strong indicator of their long-term labour market outcomes. Immigrants starting in high-paying firms, in particular, had higher initial and long-term earnings than immigrants starting in low-paying firms, even after differences in individual demographic and human capital factors were taken into consideration. This earnings advantage is consistent with the view that the selection of immigrants into high-paying firms reflects a better match between skills and job requirements and selection on skills and abilities beyond those captured by educational attainment, age, and language ability.
This study further finds that earnings returns to educational attainment and knowledge of English and French were larger in both the short and long term among immigrants initially employed in high-paying firms than among those initially employed in low-paying firms. Furthermore, immigrants with high levels of human capital starting in low-paying firms earned less than immigrants with low levels of human capital starting in high-paying firms in the first few years after landing. However, the former group outpaced the latter in earnings growth. This indicates that, in the long term, the effect of high levels of human capital outweighs the initial advantage of low-skilled immigrants who started in high-paying firms.
References
Aydemir, A., and M. Skuterud. 2005. “Explaining the deteriorating entry earnings of Canada's immigrant cohorts: 1966–2000.” Canadian Journal of Economics 38 (2): 641–672.
Aydemir, A., and M. Skuterud. 2008. “The immigrant wage differential within and across establishments.” Industrial and Labor Relations Review 61 (3): 334–352.
Barth, E., B. Bratsberg, and O. Raaum. 2012. “Immigrant wage profiles within and between establishments.” Labour Economics 19 (4): 541–556.
Bloom, D.E., G. Grenier, and M. Gunderson. 1995. “The changing labour market position of Canadian immigrants.” Canadian Journal of Economics 46 (28): 987–1005.
Eliasson, T. 2013. Decomposing Immigrant Wage Assimilation: The Role of Workplaces and Occupations. Working Paper–Uppsala: Institute for Evaluation of Labour Market and Education Policy, no. 2013: 7. Available at http://hdl.handle.net/10419/82263.
Frenette, M., and R. Morissette. 2005. “Will they ever converge? Earnings of immigrant and Canadian-born workers over the last two decades.” International Migration Review 39: 228–258.
Fong, E., and F. Hou. 2013. “Effects of ethnic enclosure of neighborhoods, workplace, and industrial sectors on earnings.” Social Science Research 42 (4): 1061–1076.
Hou, F. 2009. “Immigrants working with co-ethnics: Who are they and how do they fare?” International Migration 47 (2): 69–100.
Hou, F. 2013. “Immigrants entry earnings over the past quarter century: The changing roles of immigrant characteristics and returns to skills.” Canadian Studies in Population 40 (3-4): 149–163.
Javdani, M., and A. McGee. 2013. Intra-firm Upward Mobility and Immigration. IZA Discussion Paper no. 7378. Available at http://hdl.handle.net/10419/80564.
McFadden, D. 1974. “Conditional logit analysis of qualitative choice behavior.” In Frontiers in Econometrics, ed. P. Zarembka, p. 105–142. New York: Academic Press.
McFadden, D. 1979. “Quantitative methods for analysing travel behaviour of individuals: Some recent developments.” In Behavioural Travel Modelling, ed. D. Hensher and P.R. Stopher, p. 279–318. London: Croom Helm.
Pendakur, K., and S. Woodcock. 2010. “Glass ceilings or glass doors? Wage disparity within and between firms.” Journal of Business and Economic Statistics 28 (1): 181–189.
Reitz, J. 2007. “Immigrant employment success in Canada, Part II: Understanding the decline.” Journal of International Migration and Integration 8 (1): 37–62.
Schaafsma, J., and A. Sweetman. 2001. “Immigrant earnings: Age at immigration matters.” Canadian Journal of Economics 34 (4): 1066–1099.
Tomaskovic-Devey, D., M. Hallsten, and D. Avent-Holt. 2015. “Where do immigrants fare worse? Modeling workplace wage gap variation with longitudinal employer–employee data.” American Journal of Sociology 120 (4): 1095–1143.
- Date modified: