
Analytical Studies: Methods and References
Canadian Patent Research Database, 2001 to 2019
Skip to text
Text begins
Abstract
This paper provides an update to the work of Abbes et al. (2022a) and to the Canadian Patent Research Database (CPRD). The CPRD was created to study patenting, an important indicator of innovative activity, at the micro level. The CPRD was created by linking selected variables from the European Patent Office’s (EPO) Worldwide Patent Statistical Database (PATSTAT), a database on patent applications, to administrative data holdings at Statistics Canada. Originally, the 2018 version of PATSTAT was used to create a CPRD that covered the period from 2001 to 2015. PATSTAT 2021 was used to extend the coverage of the CPRD up to and including 2019. This paper documents the resulting changes in the CPRD.
1 Introduction
The Canadian Patent Research Database (CPRD) is a micro-level database developed to study innovative activity in Canada. The objective is to create a database of patenting activity by Canadian-resident businesses and Canadian residents. The first version of the CPRD, released in March 2022 (see Abbes et al. [2022a] and Abbes et al. [2022b] for more details), linked selected variables from the Worldwide Patent Statistical Database (PATSTAT) 2018 to administrative data on Canadian-resident businesses from Statistics Canada. PATSTAT is produced by the EPO using patent application data collected from patent offices around the world. Because of the time needed to collect and process patent data from across the world, and the fact that patent applications are published 18 months after the applications are filed, the data for the most recent years are normally incomplete. As a result, the first version of the CPRD covered the period up to 2015. This article documents the update of the CPRD using PATSTAT 2021, which allows the CPRD to provide patent data up to 2019.
Besides allowing for an extension of the CPRD along the time dimension, the incorporation of another vintage of PATSTAT allows the investigation of changes in the coverage of the PATSTAT file for Canada over time. This document presents the change in the number of patent grants by Canadian-resident businesses between the two vintages of PATSTAT. It also notes other changes to the CPRD that were made to improve its ability to meet research needs. Detailed breakdowns of the trends by industry, firm size and patent office are not presented in this update because the general findings of Abbes et al. (2022a and 2022b) remain unchanged.
2 Patent applications and linkage rates
Abbes et al. (2022a) found that the number of patent applications by Canadian-resident businesses rose modestly from 2001 to 2015, increasing during the early portion of the period and decreasing later on. The updated CPRD presents the same pattern and reveals that the decline in patent applications continued into 2016 (Chart 1). However, the number of patent applications then started to increase slowly up to 2019. From 2001 to 2019, the cumulative growth in the number of patent applications per year was 15.4%.
The number of applications for Canadian-resident businesses in PATSTAT 2021 fell from around 12,000 in 2019 to around 7,000 in 2020 and 600 in 2021. A similar decrease was observed in the last two years of PATSTAT 2018 because applications are generally not published until 18 months after their application date. Since the last two years of the file are largely incomplete, they are omitted from the CPRD.
These applications are then linked to Statistics Canada administrative data. The linkage rate remains high; Abbes et al. (2022a) reported a linkage rate of 93.7%. The linkage rate for the updated database is 96.1%. The improvement occurred across all years because of additional manual checks on the previously unlinked applications.

Data table for Chart 1
| Year | Number of applications |
|---|---|
| 2001 | 10,444 |
| 2002 | 11,145 |
| 2003 | 11,735 |
| 2004 | 11,749 |
| 2005 | 12,915 |
| 2006 | 13,100 |
| 2007 | 13,732 |
| 2008 | 12,918 |
| 2009 | 12,181 |
| 2010 | 13,981 |
| 2011 | 14,346 |
| 2012 | 13,715 |
| 2013 | 13,163 |
| 2014 | 13,290 |
| 2015 | 12,478 |
| 2016 | 11,679 |
| 2017 | 11,808 |
| 2018 | 11,960 |
| 2019 | 12,053 |
| Source: Statistics Canada, Canadian Patent Research Database. | |
3 Patent grants
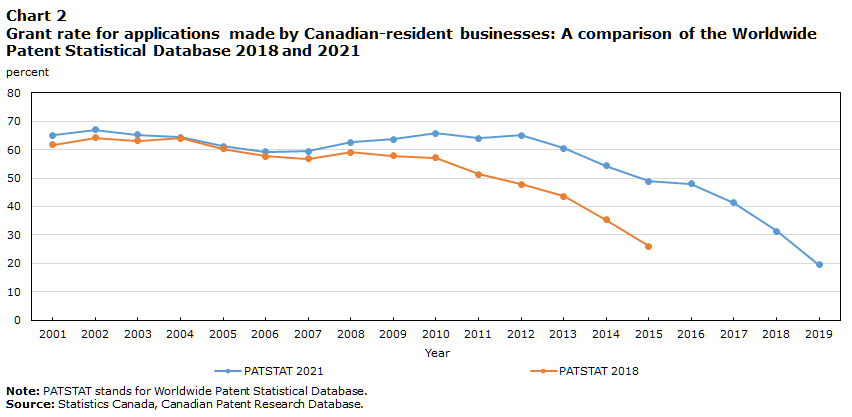
While the administrative delays between the filing of an application and its publication are known, the time between when a patent application is filed and when a patent is granted is less certain, since PATSTAT does not indicate when a patent is granted. It indicates only whether the patent was granted or not. To illustrate the length of time needed to collect reliable data on grant rates (the percentage of patent applications that are granted by year of application), Chart 2 compares the grant rates from PATSTAT 2018 and PATSTAT 2021. In the work of Abbes et al. (2022a), the data on grants were reported only up to 2011 because of the uncertainty about whether sufficient time had passed for reliable estimates to be obtained, despite data on applications being reported up to 2015. Chart 2 indicates that the caution was warranted. In fact, Chart 2 suggests that an earlier cut-off date could have been justified. Up to 2008, the grant rates are close. The grant rate reported for 2008 using PATSTAT 2021 was 62.6%, versus 59.2% using PATSTAT 2018. If it is assumed that PATSTAT 2021 gives the correct value for 2008, then the 3.4 percentage point difference between the two versions of PATSTAT implies a 5.4% error in the grant rate when PATSTAT 2018 is used. The difference in the grant rate between PATSTAT 2021 and PATSTAT 2018 increases to 5.8 percentage points in 2009 (9.2% error), 8.6 percentage points in 2010 (13.0% error) and 12.6 percentage points in 2011 (19.7% error). If a 10% error is acceptable, then 2009 should have been the cut-off date for the grant rate using PATSTAT 2018. This suggests that 2012 could be an acceptable cut-off date for the grant rates using PATSTAT 2021.
Similar analysis is carried out by patent office. The gap between the grant rates calculated using PATSTAT 2018 and PATSTAT 2021 for 2011 is largest for the EPO (26.6 percentage points) and smallest for the United States Patent and Trademark Office (USPTO) (5.7 percentage points). The gaps for the Canadian Intellectual Property Office and other offices are around the gap for all offices. This suggests that data on patent grants from the USPTO are more likely to be complete in recent years, while data from the EPO tend to lag behind those from the other offices. The differences between patent offices may indicate that the USPTO is faster in granting patents than other offices, particularly the EPO.
Data table for Chart 2
| Year | PATSTAT 2021 | PATSTAT 2018 |
|---|---|---|
| percent | ||
| 2001 | 65 | 62 |
| 2002 | 67 | 64 |
| 2003 | 65 | 63 |
| 2004 | 64 | 64 |
| 2005 | 61 | 60 |
| 2006 | 59 | 58 |
| 2007 | 59 | 57 |
| 2008 | 63 | 59 |
| 2009 | 64 | 58 |
| 2010 | 66 | 57 |
| 2011 | 64 | 51 |
| 2012 | 65 | 48 |
| 2013 | 61 | 44 |
| 2014 | 54 | 35 |
| 2015 | 49 | 26 |
| 2016 | 48 | ... |
| 2017 | 41 | ... |
| 2018 | 31 | ... |
| 2019 | 19 | ... |
|
... not applicable Note: PATSTAT stands for Worldwide Patent Statistical Database. Source: Statistics Canada, Canadian Patent Research Database. |
||
4 Firms that patent and the number of applications
Multiple applicants can be listed on each patent application. To avoid double counting, the first version of the CPRD kept only the first company that was listed on each application. While this approach ensures that each patent application is counted only once at the aggregate level, researchers may want to know whether a firm is involved as an applicant regardless of whether it appears as the first company on the application or not. To accommodate this type of analysis, the firm-level counts of patent applications in the micro-database are now constructed with all applicants, not just the first applicant. Furthermore, the patent-level file includes multiple entries for each firm that appears on the application.
The impact on analysis carried out using the first version of the CPRD is expected to be minimal. Chart 3 shows the number of patent applications (as in Chart 1) and the total number of Canadian-resident business applicants on those applications. In one year, a business can be counted twice if it is on two separate patent applications. Non-business applicants and applicants that do not reside in Canada are excluded from these counts. On average, there are roughly 500 more applicants than applications each year, or 3.9% per year. The difference between applicants and applications is smallest in the earliest years. There is a difference of roughly 120 in 2002, while the difference is largest in 2013, at 1,800.

Data table for Chart 3
| Year | Applications | Applicants |
|---|---|---|
| number | ||
| 2001 | 10,444 | 10,641 |
| 2002 | 11,145 | 11,267 |
| 2003 | 11,735 | 11,914 |
| 2004 | 11,749 | 11,930 |
| 2005 | 12,915 | 13,142 |
| 2006 | 13,100 | 13,300 |
| 2007 | 13,732 | 13,979 |
| 2008 | 12,918 | 13,157 |
| 2009 | 12,181 | 12,420 |
| 2010 | 13,981 | 14,245 |
| 2011 | 14,346 | 14,637 |
| 2012 | 13,715 | 14,845 |
| 2013 | 13,163 | 14,969 |
| 2014 | 13,290 | 14,246 |
| 2015 | 12,478 | 13,276 |
| 2016 | 11,679 | 12,357 |
| 2017 | 11,808 | 12,605 |
| 2018 | 11,960 | 12,467 |
| 2019 | 12,053 | 12,468 |
| Source: Statistics Canada, Canadian Patent Research Database. | ||
5 Conclusion
This paper documented the changes made to the CPRD in light of the availability of the 2021 version of PATSTAT. Overall, the linkage rate of PATSTAT to Statistics Canada data sources has improved, increasing the number of patents available for analysis in all years. As discussed by Abbes et al. (2022a), the high linkage rate (now 96.1%) ensures that analyses conducted with all applications and with those linked to Statistics Canada’s administrative data in the CPRD are comparable. The updated PATSTAT data also enabled the completeness of the patent grant data to be investigated. The grant rate of patents is found to be underestimated in the most recent years of PATSTAT. For example, in PATSTAT 2018, the grant rate for 2011 was 51.4%, compared with 64.0% for the same year in PATSTAT 2021. The results suggest that 2012 is an appropriate cut-off for analysis using patent grants in the CPRD based on PATSTAT 2021. Finally, the CPRD now includes all firms that file for patent applications, not just the first firm on each application.
References
Abbes, C., Baldwin, J.R., Gibson, R., & Leung, D. (2022a). Canadian Patent Research Database Activity (Analytical Studies: Methods and References, No. 42). Statistics Canada. Canadian Patent Research Database (statcan.gc.ca)
Abbes, C., Baldwin, J.R., & Leung, D. (2022b). Patenting Activity by Canadian Resident Businesses. Economic and Social Reports, 2(3). https://doi.org/10.25318/36280001202200300005-eng
- Date modified: