
Analytical Studies: Methods and References
The System of National Quality-of-Life Statistics: Conceptual Framework
by Peter Hicks
Skip to text
Text begins
1. Introduction
Statistics Canada has launched a major strengthening of its social statistics, relabelled as quality-of-life statistics. This initiative is described in the 2022 paper “The System of National Quality-Of-Life Statistics: Future Directions” which:
- Outlines the rationale for this approach. As a reminder to readers, Box 1 summarizes this rationale.
- Describes its content in systems terms, i.e., it examines the proposed inputs, processes, outputs, and outcomes of the system.
This present paper provides a complementary description from a different perspective, namely:
- Its conceptual framework. i.e., a description of the structure of the inputs (individual data items from multiple sources) and how they are consistently used to produce outputs (indicators, dashboards, supporting tables and microdata files).
- The main challenges and next steps in operationalizing this framework.
Section 2 describes why a conceptual framework is needed now.
Section 3 describes in practical terms how the conceptual framework can be operationalized by examining the resulting changes that will be needed on Statistics Canada’s website.
Section 4 outlines issues that will need to be addressed in the future and how the conceptual framework will facilitate the needed development work.
Section 5 concludes by reviewing the benefits, and challenges in implementing a system based on microdata foundations.
An annex describes the historical antecedents to the proposed approach. A micro based framework is a logical continuation of 50-year-old dialogues that were associated with the development of the current version of the System of National Accounts (SNA).
2. The necessity of having a conceptual framework
What is a conceptual framework?
A conceptual framework describes how national statisticians define their concepts and processes. It is based on a model of society that reflects their understanding of what, in the real world, it is important to measure.
Box 1. Rationale for the shift to the System of National Quality-of-Life Statistics
Compared with current arrangements, the proposed system will produce statistics which will be more timely, more granular, more responsive to the needs of users, and more easily accessed.
In line with directions set out in Budget 2021, the system that is being developed will provide comprehensive, useable evidence on:
- The inter-related factors, including non-economic factors like health, housing, environment, and safety that result in a high quality of life. The system also takes into account the effects of the policies and programs of all orders of government on people as they move through the course of their lives.
- Equality, showing the distribution of outcomes and opportunities across places and people, taking account of the great diversity of the Canadian people and the need for analysis, and action, at the level of small population groups including those facing barriers to a high of quality life.
- Sustainable outcomes, assessing how current actions will support high quality of life in the future.
Over time, the system will also begin to provide evidence that can improve decisions about the particular social interventions that are likely to work best for specific individuals – with that information being accessible at the time when these decisions are being taken based on analysis of what has worked best in similar situations in the past.
Such applications are best developed as partnership arrangements with bodies who deliver social programs and services.
The resulting evidence will support government budgeting and accountability, the design of effective programs, and efficiency in their administration. Decision-making by individual citizens and service providers will be supported with practical ‘what is likely to work best’ data.
The outcome will be major improvements in the operation of labour markets, health, learning and other social dimensions of life in Canada, both on average and for all population groups – and direct benefits to individuals as they make big decisions in the social, health and labour domains of life.
Unlike the existing social statistics, which are based around particular data sources such as surveys, censuses and summarized administrative records, the new system will provide far more detailed and timely information by drawing on data from multiple sources. These sources will include a much more flexible suite of surveys, finely-grained information about operation of social programs, and anonymized data about individuals that currently exist in administrative records.
A multi-source system is possible as a result of the major improvements in digital information processing technology that have been introduced in recent decades, with promise of even more powerful tools and data sources on the horizon.
The usual analogy is with the SNA which describes the operation of the macro economy as seen through the lens of the social science discipline of economics and which has become the dominant statistical conceptual framework that guides policy-making.
In the case of a system of national quality-of-life statistics, the conceptual framework focuses on individuals and their wellbeing. In practical terms, it takes the form of the documentation (sometimes called metadata) that describes the standard concepts, definitions, classifications systems, procedures, and outputs used in the statistical system, with an emphasis on:
- Consistency in the description of the separate items of microdata and in the measurement of their quality.
- Consistency in the ways in which each data item (of the almost countless number that are, or could be, collected) is consolidated into higher order aggregated statistics and indicators.
- Consistency with related systems, including with:
- International standards and indicators.
- The frameworks used in economic and environmental statistical systems.
- Concepts used in a range of scientific disciplines.
Why do we need one now?
In the past, social statistics were organized around separate collection vehicles such as censuses or surveys of individuals, or surveys that obtained data from administrative records. There was no integrated, comprehensive system of social statistics.
- Each survey or other collection vehicle was, of course, based on an implicit understanding of what, in the real world, it was important to measure. However, the model of society being used was not explicit and there was typically no reference to the concepts used in other collection vehicles.
- In practice however, effort was often placed on ensuring comparability in definitions when the same variable was collected using different collection vehicles. That often consisted of borrowing definitions used in other existing collections vehicles – not through reference to a conceptual model.
In other words, in the past there was a need for co-ordination but not for establishing a set of rigorous, consistent definitions that encompassed all social statistics. The “Future Directions” paper explained that the shift to a multi-source system will necessitate the development of an explicit conceptual framework with standard definitions for all variables and other metadata descriptors.
- When statistical outputs are based on the processing of variables drawn from many sources, it is imperative that those variables be defined in the same way and that their quality is measured in a consistent, rigorous way.
- This requires the use of standard definitions for all variables, with consistency ensured by developing those standard definitions in relation to a commonly-held model of how society operates at the micro level.
- That is, two sets of definitions are in play: first, a standard definition of a variable that identifies what is needed or intended and, second, a description of the actual data items that are collected from various sources, including any deviations from the standard definition.
- A wealth of new statistical information can be produced by using data linkage tools based on overlapping data from multiple sources – provided that these standard definitions and quality measures are in place.
In other words, there is no alternative in a multiple-source system to having a conceptual framework that provides a set of consistent, inter-related, standard definitions of the variables and other concepts used in the system and how they are aggregated in a systematic way into various outputs such as tables, indicators, or microdata files.
As described in the next sections, the task of creating and operationalizing such a framework is entirely manageable:
- Many elements of it already exist.
- A common way of understanding the way that society works is implicit in nearly all existing social data and standard definitions will usually be easy to create – at least for existing cross-sectional data.
- Implementation can be gradual. A system built on micro-foundations is inherently flexible. It makes use of whatever data is available. Errors and mis-starts are easy to fix.
3. Operationalizing the conceptual framework on the Statistics Canada website
The needed conceptual framework can be made operational by making incremental changes to the Statistics Canada website in the following areas:
- Gradually extend the existing metadata on the website to include all the variables, statistical units and classification systems used in the quality-of-life system.
- Consistent with the approach described in the “Future Directions” paper, gradually increase the outputs on the website in the following categories, with the data in all outputs being based on the consistently-defined microdata described above:
- Standard microdata files.
- Standard tables.
- Standard dashboards (some of which may be referred to as hubs).
- Quality-of-life indicators.
- Adding contextual material to the website related to the system of quality-of-life statistics, taken as a whole.
Metadata descriptors of variables
Many of the needed definitions are already on the central metadata section of the existing Statistics Canada website, although some of these are still defined in relation to data sources, not on what they are intended to measure.
- Others are found in the sections of the website related to specific data from various sources. Most of these definitions have, as noted, been defined in a consistent manner.
- Others are included in documentation related to microdata sets. Many of these definitions are particular to the source data, often an administrative file, and do not necessarily reflect any standard definition produced by the statistical system.
The initial task therefore consists of expanding the existing metadata descriptions on the website to gradually cover all the data in the system of quality-of-life statistics, ensuring that each entry contains a standard definition (defined in terms of a model of how society operates – and that has no reference to sources of data) as well as definitions of the actual data collected from different sources, showing if and how it deviates from the standard definition. The sidebar provides an example.
Example of a metadata entry describing an employed person
The entry might start with the standard definition of an employed person, defined without reference to the source of that data.
This might be followed by descriptions of the actual data items that had been collected, each with an adjective or modifier in its title that distinguished it from the standard definition and showing how it varied from the standard, e.g.,
- Employed person (Labour Force Survey definition): for data collected from this survey.
- Employed person (Survey of Employment, Payrolls and Hours definition) for data collected from this survey.
- And other variants for employment variables collected from other surveys or administrative files.
The entry might also include sub-entries for closely-related variables, mainly those that relate to different groups within employment such as:
- Part-time employed person, with a standard definition of what constitutes part-time.
- Employed person in various other categories of work relationships and work modalities.
The entry would also contain cross-references to closely-related entries such as those for hours or precariousness. Definitions could be repeated in various entries, when needed. As well, there could be an index that lists all variables in all entries separately.
Standard definitions already exist for most variables relating to individuals. As noted, there is currently no explicit theory of society that is used to define the ideal or standard definition. However, in practice nearly all the data that currently exists in the system are implicitly based on a cross-sectional model where:
- Individuals have attributes that are defined in a consistent way.
- Individuals interact with other individuals and with social programs, social institutions and groups through transactions and activities that are also defined in a consistent way (e.g., the dollar value of the transaction or the length of the activity).
Figure A1 of the Annex shows the simple conceptual model that underlies most existing social data. It also suggests ways in which individual attributes might be grouped in a way the stresses the quality-of-life theme.
- Note that this framework, since it encompasses economic transactions, is compatible with the SNA and its various satellites in the social area, as referred to in Section A5 of the Annex.
In other words, creating comprehensive metadata describing variables related to individuals presents no serious conceptual challenges – at least for existing cross-sectional data. As well, metadata relating to classification systems and statistical units are already on the website or could be referenced on that site.
There will be conceptual challenges ahead as the system evolves to better support lifecourse and other longitudinal analysis and to support causal analysis of the effects of social programs on individuals. These challenges, which include developing standard definitions for variables that describes programs and institutions, are discussed in the Section 4.
Standard outputs on the website
The main statistical outputs on the current version of the website consist of tables and associated graphics which can, increasingly, be manipulated by users in diverse ways. These tables are typically based on data from a particular source, such as data from the Labour Force Survey or Census data tables.
The “Future Directions” paper explains why the following standardized outputs, which are all derived from the consistently defined microdata, should be gradually added to the web site:
- Standard multi-source tables defined in terms of the subject matter, not the source.
- Existing tables would, obviously, remain on the website.
- Tables where data was drawn from different data sources would be gradually added, following consultation with users. Box 2 provides examples.
- A challenge will be to develop effective ways of informing users about the sources and quality of the data in these tables.
- Standard multi-source microdata files. Existing methods of releasing microdata files would, of course, continue.
- In addition, following consultations with users, a new set of fully-documented standard microdata files that have been vetted to protect privacy would be gradually created and made accessible via the web site. These would be designed to meet a range of current needs and would typically contain data from multiple sources, including synthetic data when that proved to be useful. Box 2 provides examples.
Box 2. Examples of standard multi-source tables and standard multi-source microdata files
Standard multi-source tables
- Some could be tables showing simple compilations of existing data, for example showing year-to-year changes in key labour market variables drawn from different surveys and administrative sources (employment by gender, hours, wages, vacancies, multiple job-holding, unemployment and receipt of Employment Insurance benefits, etc.).
- Other could be based on fully integrated synthetic data drawn from multiple sources, such as tables produced from the existing Social Policy Simulation Database.
- A promising avenue would involve examining existing analytic studies that are based on linked data files. These are typically one-off studies, but some of the tables produced for these studies might be useful candidates for ongoing standard tables to be accessed on the web site.
Standard multi-source microdata files
As described in the “Future Directions” paper, there has been much progress in creating rich platforms of linkable databases in the social area, mainly based on administrative files but with plans to include census and survey files. New tools have been developed to carry out linkages while ensuring privacy protection.
This new capacity has been used to produce some analytic studies, but its potential has only started to be tapped. One element in a plan for further development could be the identification of microdata files that could be usefully produced on an ongoing, documented basis and that could be accessed without privacy risks.
- Microsimulation modelling could be used in some cases since it can produce useful synthetic data without privacy risks. The Social Policy Simulation Database/Model provides a current example.
- This is an area where partnership arrangements with external researchers might prove to be productive.
- Quality-of-life indicators. A proposed set of high-level quality-of-life indicators has already been developed by the Department of Finance with the assistance of Statistics Canada. It is described in Section A6 of the annex.
- The “Future Directions” paper argues that the Finance indicators could be used on Statistics Canada website whether or not they are formally adopted by the Government of Canada for use in policy-making. It suggested that, should this not be possible, a version of the Organisation for Economic Co-operation and Development (OECD) better life indicators could be used.
- These would not be the only indicators on the Statistics Canada website. The Finance indicators have been designed to be consistent with (and overlap) indicators developed for other purposes such as the poverty reduction strategy or the housing strategy, or the Sustainable Development Goals. For example, the Quality-of-life indicators would include indicators (such as the poverty rate) that are also included in the Canadian Indicator Framework for the Sustainable Development Goals.
- The Quality-of-life indicators would be seen as one part of an overall set of information products that also contained dashboards aimed at particular policy and program applications and associated supporting tables and dashboards.
- Dashboards and hubs. Quality-of-life indicators, and social indicator initiatives generally, are cast at too high a level to be directly useful in most practical policy and program agendas. The “Future Directions” paper calls for consultations with users to develop lower-level indicator sets, referred to as dashboards, to support the needs of those dealing with particular policy or program issues.
- Some of these requirements will be quite specific to a single user and will be met by providing tailor-made tables and associated graphics. Others will meet the needs of a wider range of users and will be included on the website.
- Some of these are already on the current website where they are referred to as hubs, such as the Dimensions of Poverty Hub, the Accessibility Data Hub, and the Sustainable Development Goals Data Hub. The information on these hubs is quite rich, often with considerable explanatory material and designed to meet a wide range of needs.
- The “Future Directions” paper also envisages the gradual creation of sets of dashboard indicators that are less elaborate and detailed than those in the present hubs, in some cases dealing with issues that are temporary in nature or that are directed to more specialized audiences, such as those dealing with programming that affects a particular population group. These could be created simply and quickly. They would be flexible in their design, although all would contain links to the higher-level Quality-of-life indicators and to supporting tables and microdata.
Contextual material relating the entire system
In additions to the metadata and the outputs just described, it is proposed that the Statistics Canada website also add contextual material relating to the system of national quality-of-life statistics taken as whole. This would include information about historical context, strategic plans, explanations of significant issues and how they are being addressed, and descriptions of consultation processes related to the development of new data. This contextual material reflects the perspective that:
- This is a period of transformational change in the national statistical system – both in the sources and uses of social data and in the consultative, partnership and decision-making processes that are used.
- It is useful during such periods of transition to be open and explicit about the who, how, what, and why. It will help support the new emphasis on outreach and partnership.
- It will help both users and producers of data to focus attention on the system as a whole, as well on its component parts taken separately.
4. Future development
The preceding section took a short- and medium-team operational view by examining the implementation of the shift to a quality-life perspective in terms of the changes that will be needed on Statistics Canada website. The “Future Directions” paper also looked to longer-term challenges. These will result in pressures to strengthen the capacity of the system of national quality-of-life statistics to:
- Measure the sustainability and equality dimensions of wellbeing, including an emphasis on disaggregated data and on gains and losses over time in financial, human, and social capital.
- Increase its responsiveness, including timeliness.
- Measure how social policies and institutions, taken singly and in combination, affect the quality of the lives of individuals over the course of their lives.
- Provide practical statistical information directly to individuals. This includes working in partnership with service providers in developing pilots and demonstration projects that will provide real-time ‘what is likely to work best’ estimates geared to particular interventions.
Moving in these directions will require new research and development work (R&D) to extend the conceptual model of society that underlies the framework in ways that are set out in Box 3. Key points are:
- While some of this R&D is ambitious and will take the national statistical system in new directions, implementation can be gradual, reflecting available resources and current priorities.
- The cross-sectional model that underlies current social statistics is highly flexible. It can be extended to encompass the new kinds of analysis that will be needed. As noted in Box 3, much of the needed development work has been anticipated in a 2012 paper, “A Framework for Citizen-Centred Social Statistics and Analysis”, which is discussed in Section A4 of the Annex.
Box 3. Examples of further development work that will be needed to meet new priorities
Sustainability and equality. The shift to a microdata basis will, of course, enable major gains in analysis related to equality. It supports the most disaggregated analysis that is possible given the inherent limitations of the source data.
To support sustainability analysis, further work will be needed in developing the conceptual framework to allow better analysis of the causes of changes in human, financial and social capital.
- The existing model does a good job in examining how flows involving monetary transactions provide gains and losses in financial capital, such an individual wealth. However further development work is needed to show how flows involving services and information (including those take place outside of market settings) lead to gains and losses in human and social capital – which are important dimensions of a high quality of life.
- The paper, “A Framework for Citizen-Centred Social Statistics and Analysis”, which is discussed in Section A4 of the Annex, provides advice on the kind of development work that is needed.
Responsiveness and timeliness are not new pressures. Statistics Canada made major improvement here in response during COVID-19 and the “Future Directions” paper describes current plans to increase responsiveness in responding to requests for new information.
- A multi-source system has the capacity to provide a much wider range of statistics more quickly, as will current plans to implement a more responsive and timely internal survey capacity.
- The use of Quality-of-life indicators and the more extensive use of dashboards and policy-related hubs will result in even more pressure to improve timeliness. Their usefulness is very much dependent on the timeliness of the indicators used.
- There is likely to be increasing pressure to produce estimates of current data, even if of lower quality, on the assumption that some current data is better than none. R&D related to the feasibility and quality of now-casting tools (including microsimulation) will likely become important.
Measuring the impact of combinations of government interventions on the subsequent lives of the individuals affected is becoming a feasible objective for the statistical system given a micro, multi-source approach and new data processing power, although in some areas of social policy it is still a far-off goal. Much R&D and a gradual implementation strategy will be required.
- Describing institutions and programs at a fine level of granularity. A key challenge will be to develop consistent ways of measuring the processes and outputs of particular government programs and the interventions of social institutions consistently, and at fine level of granularity.
- The system currently does this well for programs that provide individuals with income. However, development work will be needed for programs that provide individuals with services or information.
- Currently most information of that sort is aggregated data, based on surveys of administrative records, often without consistent coding of outputs.
- Describing individual lifecourses. A second challenge f will be to extend the cross-sectional concepts that underlie the definition of existing variables to also allow longitudinal analysis.
- The paper, “A Framework for Citizen-Centred Social Statistics and Analysis”, referred to above, shows how this can done by coding some flows as events and transitions. This allows an examination of an individual’s lifecourse in different domains that correspond to the way in which public policy is organised – life in school, life in work, life in the family, life in sickness and disability.
- That paper also shows how the conceptual framework can be extended to allow integrated approaches to longitudinal analysis using both lifecourse and stock/flow approaches.
Providing ‘what is likely to work best’ information directly to individuals results in similar R&D challenges to those above related to the causal effects of programs, although ones that are easier to address in practice because of the gradual experimental approach that is set out in the “Future Directions” paper. It proposes moving first in areas where good data already exist.
- Again, a key challenge will be to develop consistent, highly granular ways of describing the processes and outputs of program interventions that provide services.
- Another challenge will be to find ways of communicating the quality of these ‘probability of success’ data to users.
- Once again, the paper, “A Framework for Citizen-Centred Social Statistics and Analysis”, provides advice and insights on the kind of development work that is needed.
5. Implementing micro-based framework: benefits and challenges
In terms of implementation, there are many advantages to a micro-based approach like that proposed here:
- It makes use efficient use of whatever data are there, from all sources. It accommodates data at different levels of aggregation or that is limited to certain groups or geographic areas or reference periods.
- This efficiency was one of the main reasons why the social accountants of the 1960s and 70s preferred a micro approach, as described in Section A1 of the Annex.
- That efficiency also enables a gradual, experimental approach to implementation and future development – to learn by experience.
- The focus on the individual is consistent with the kind of policy analysis that is becoming increasingly important. Section A7 of the Annex discusses policy trends.
- It provides a common language that facilitates partnerships arrangements with parties whose interests are not identical with, but overlap, those of the national statisticians.
- The finely-grained descriptions of microdata will support most types of analytic uses, including those that only emerge in the future.
- It allows flexibility in the resulting statistical outputs. For example, if there is a need for a new high-level social indicator, a consistent microdata base will often allow such an indicator to be added without new data collection – along with the full set of historic time series.
- Similarly, it is easy to adjust the microdata descriptors should the need arise. New or differently defined variables can be easily incorporated. There is no problem, for example, in coding an individual’s activities in different ways, provided that all variants are carefully documented, as seen in the sidebar box on page 5.
- It results in statistics that are consistent with those produced in other statistical areas, such environmental and economic statistics. Section A5 in the Annex provides an example.
Privacy protection may, at first look, appear to be a bigger issue in a system that is based on using information about individuals drawn from multiple sources. However, as stressed in the “Future Directions” paper:
- Statistics Canada’s role in developing and using data linkage tools that do not infringe on privacy will be highlighted, as will its world-leading Necessity and Proportionality Framework for balancing use, privacy, and response burden.
- New emphasis will be place on the role of Statistics Canada itself – a secure and neutral location – in producing multi-source tables and microdata files that have been vetted to ensure both quality and privacy protection, reducing past reliance on external users to conduct some of these functions.
- The new partnerships and the more responsive statistical outputs that are produced will result in a larger and more vocal base of support for Statistics Canada when issues surrounding privacy and response burden are discussed in public fora.
There will be challenges of course. These lie mainly in the area of the resources needed to develop the new multi-source system while maintaining the existing system, and at the same time building stronger outreach and partnership relationship – an exercise that can be resource intensive. Many of the skills needed in technical areas such the manipulation of very large data files and their use in statistical applications are already in short supply. Strategic planning will need to put these resourcing issues at centre stage.
Annex: Historic foundations
Purpose and content of this annex
The annexNote provides historical background to the long-term directions being developed by Statistics Canada with respect its social statistics, newly re-labeled as the system of national quality-of-life statistics.
- Section A1 looks back to the foundational work in the late 1960s and 70s to find a social statistics equivalent to the economic System of National Accounts. The main conclusion reached 50 years ago was that there was a need to develop a microdata framework that would be independent of the SNA, but supported by further work on those social dimensions that could be addressed by the SNA and by social indicators.
- Section A2 describes a conceptual framework based on microdata that was developed in Statistics Canada in the mid-1990s for use in microsimulation modelling.
- Section A3 describes work by the Policy Research Initiative in the early 2000s in developing an integrative framework for social statistics that used the same basic conceptual framework as proposed in the two bullets above, but that extended it to support lifecourse analysis and applications that involved qualitative as well as quantitative analysis.
- Section A4 describes a 2011 initiative by Statistics Canada directed to the future development of the system of social statistics. It included papers on social accounting and on lifecourse principles that are precursors of the concepts used in the present plans. It also radically over-turned traditional planning assumptions by identifying individuals and institutions as prime, direct audiences for social statistics.
- Section A5 describes a recent “Beyond GDP” initiative, which uses remarkably similar concepts to those described in Statistics Canada’s current strategic thinking.
- Section A6 summarizes the proposal for Quality of Life Indicators, developed by the Department of Finance with the assistances of Statistics Canada, that was described in the 2021 federal budget.
- Section A7 steps back and describes societal, policy and technological trends that underlie the need for integrated social statistics based on multi-source microdata.
A1. Foundational work in social accounting
The late 1960s and 1970s was a golden age of progress for statistical frameworks. A group of mainly American experts reshaped the SNA and started work on examining similar frameworks on the social side. Box A1 on the next page describes the main themes of the work that took place on social accounts.
The statement of the problem that was identified a half century ago reads as if it could have been drafted yesterday, as do the proposed solutions. Approaches that involved social indicators and extensions of the SNA were considered, but the preferred approach was to develop a microdata-based (individual level) framework which used two types of accounting principles: one based on national accounting principles and the other on time use. Such a framework would provide an integrated approach to subjective and objective measures of wellbeing and had other advantages as identified in Box A1.
The approach identified at that time was ahead of its time. It was not followed up for political and technical reasons that are discussed in “A Framework for Citizen-Centred Social Statistics and Analysis”. However, much more powerful computing resources, new analytic techniques, and new data sources have made it feasible today. Indeed, the conceptual framework described in the main text bears much resemblance to the proposals described in Box A1.
A2. Wolfson’s 1995 criteria
By the mid-1990s the development of microdata files and analytic tools had developed to a point where social statistics could be seen as system based on microdata, at least in microsimulation modelling applications. Michael Wolfson, from Statistics Canada, set out the criteria for a microdata framework in 1995. His approach operationalized aspirations expressed by the earlier generation of framework builders by applying computing power that simply did not exist a couple of decades earlier. His conceptual framework is shown Box A2. Wolfson was envisaging the use of this framework in a microsimulation model, but its usefulness does not depend on any particular model or analytic tool.
The Wolfson approach brought a new practicality to the earlier social accounting thinking by showing how it could be operationalized using analytic techniques that had become practical as the result of growing computing power, particularly by using the device of synthetic individuals which allow the consistent use of data drawn from many sources.
Box A2 suggests that Wolfson may have been overly optimistic about the speed at which increased computing power would allow access to social data. However, he did produce a highly sophisticated dynamic microsimulation model, LifePaths, which was based on the principles he described. The model had a long and useful life but was, for reasons that are also discussed in “A Framework for Citizen-Centred Social Statistics and Analysis”, never used as much as had been anticipated.
Box A1. Main themes from the social accounting discussions of the 1970s
Problem that was addressed
There was general agreement that social accounting should address two main faults in the social statistics that then existed:
- Existing statistics were descriptive rather than dynamic and analytical. They were weak in helping us understand cause and effect.
- Existing statistics were not easily integrated. There was little ability to see how changes in various aspects of society related to each other.
Type of solution
Social indicator approaches were examined but the emphasis was on creating accounting systems that would:
- Show how social data were related to each other and with economic data.
- Be based on flows, which enable a better understanding of inter-relationships and that provide a better handle on understanding cause and effect.
The main alternatives
The focus was on two types of general-purpose accounting systems:
- Demographic accounts, based on national accounting principles. The basic idea is that one can examine tables that show flows among different population groups (i.e., not individuals) with different characteristics at different points in time. This approach results in an integrated approach to examining changes in status including many social dimensions – education, health, marital status, income, wealth, or even subjective wellbeing status
- Time-based accounts, which use two types of accounting principles: one based on national accounting principles and the other on time use. This approach is based on micro (individual level) data. It provides an integrated approach to subjective and objective measures of wellbeing.
Preferred approachNote
While all approaches were useful, the clear preference was to further develop the micro-level accounts.
- Time would be allocated to market production (working for money) and to a range of non-market activities.
- These activities produce a range of outputs (e.g., earnings that can buy goods and services, a clean house, improved health).
- The activities add up to the 24 hours that are available in a day, providing a powerful accounting tool.
- The satisfaction obtained from the outputs can be measured – as can sustainability (the capacity to continue on in life).
- The outputs produced can be associated with the capital stocks associated with time use, including physical capital, financial capital, and human capital.
As well, the microdata approach was thought to have the potential for far more efficient manipulation, collection, and storage of data (including from multiple sources) and allowed far more integration (e.g., between objective and subjective data). As well, the micro approach could readily take account of macro data – such as the control totals needed to ensure consistency at the level of the economy as whole.
On the other hand, much of the data needed to get full advantage of the time-based micro approach simply did not then exist – with data from sample surveys being fragmentary and often conflicting. But even here, this seeming weakness was really a backhand complement. The time-based micro system could work with whatever data was available; it did not require full-scale implementation to be analytically useful. It was possible to start with what was there and gradually include more data as it became available.
Next steps
Developmental work, as foreseen at that time, should be directed to developing a system that would:
- Be general purpose in nature – serving a broad spectrum of demographic, social and economic research, and creating a comprehensive common data base.
- Integrate micro and macro data. The macro accounts should be conceptually derivable from aggregations of micro accounts and should provide a framework for the whole system.
- Not require the estimation or recording of trivia that arise purely because of accounting design.
- Be open-ended, so that analysts interested in specific problems or kinds of data can build on the existing system without having to begin anew.
The present proposal reflects Wolfson’s principles, as the following examples from Box A2 illustrate:
- Longitudinal data at the micro level is essential.
- Data processing and analysis must treat social data as a whole, not compartmentalized by the original stovepipes where the data was collected.
- Wolfson’s use of attributes and relationships (particularly relationships that involve interactions) as the heading for descriptors is similar to the flow concepts used in the earlier social accounting shown in Box A1 and the activity/transaction concepts of the present proposal as discussed in Sections 2 and 3 of the main paper.
- More stringent quality standards are required for microdata analysis, and these must be reflected in planning and in detailed and accessible documentation.
- Overlap in the content of data sources is needed to maximize synthetic statistical matching and equivalent methodologies. This is needed to create new data (data that cannot be obtained from single data source taken individually) and to control quality.
These are all points that are incorporated in the Statistics Canada’s current planning exercise, and all receive heavy emphasis in the “Future Directions” paper.
A3. Policy Research Initiative and the Olivia framework
Early in the 2000s, the Policy Research Initiative, an internal think tank within the Government of Canada, explored a range of newer social policy issues. These included asset-based policies, social capital, exclusion, and lifecourse perspectives. A framework was developed called the Olivia frameworkNote that illustrated the micro-based information that would be needed support these applications. It used the concepts found in the social accounting and the Wolfson approaches described above, but extended them in new directions:
- It was expressed in narrative, biographical terms as well as in terms of the micro-level data needed for statistical analysis, both qualitative and quantitative. It was intended to support the intellectual frameworks and analytic tools used in different social science disciplines.
- In addition to providing the cross-sectional view of society that underlies most current social statistics, it provided an integrated approach to two kinds of longitudinal analysis:
- Stock and flow analysis (which reflects the economic orientations found in the social accounting literature).
- Life-course analysis (which reflects thinking developed in other social science disciplines) that is particularly useful in examining changes over the course of life in those domains of those life corresponds with the way in which most public policy is structured, e.g., policies related to education, to work, to families, to health, or to public safety.
Box A2. Wolfson on the key elements of a framework for socioeconomic statistics, 1995
At any point in time, the population is best represented by a sample of individuals, each of whom is characterized by a set of attributes and relationships.
- Attributes include income, educational attainment, consumption, various aspects of health status, time use and patterns of activity.
- Relationships include conventional kinship ties as well as cohabitation (i.e., in database or graph-theoretic terms, such relationships can be represented by various kinds of pointers to other individuals – each of whom is also in the database).
- Relationships also include interactions with the major institutions of society – school, work, and government programs. These contacts, relationships or transactions between individuals and major institutions can also be considered part of the set of individual attributes. They can take the form of pointers to descriptions of the institutions – schools, workplaces, and government programs – with which the individuals were interacting.
- This individual database can then easily be viewed as comprised of a hierarchy of various types of units – e.g., individuals, nuclear families, extended families, and households.
- Each unit (individual, family, or household) can be described by any one of several summary attributes such as disposable income, leisure time, or self-reported satisfaction.
- Measures of variety can then be defined by summary statistics over this multivariate joint distribution of units (e.g., Gini coefficients, quantile shares).
- Over time, the population is best represented by a series of individual biographies, the equivalent of a broad and deep longitudinal panel survey.
- Given this longitudinal representation, a coherent family of summary indicators can be constructed from generalizations of the notion of life expectancy – including partitions of life expectancy into cumulative sojourn times in various life states.
A complete longitudinal microdata sample would provide a microcosm of the actual population and its relationships to major social and economic institutions.
From this microcosm, a wide variety of statistical indicators could be readily constructed – effectively with no more effort than pressing the ubiquitous <Enter> on a computer keyboard to launch the appropriate software algorithm and have it pass through the microcosm data.
By construction, all such summary indicators would be coherent because they would be derived from the identical underlying micro-database. The summary indicators would not obscure the population’s variety and heterogeneity, because the underlying micro-database would always be open (at the click of a mouse button, say, in terms of contemporary informatics functionality) for detailed inspection.
The main question is from where would this microdata come? For the very practical reasons of cost, respondent burden, and concerns for individuals’ privacy, it could not come from an omnibus longitudinal household survey. Moreover, there is not time to wait half a century or more for such a longitudinal survey to be substantially completed, by which time many things will have likely changed dramatically. The unavoidable conclusion is that the microdata will have to be synthesized.
Such synthesis would be an extension of the synthesis of a population cohort already implicit in indicators such as life expectancy. It would differ methodologically, because the semi-aggregate or cell-based approach inherent in the underlying life table is incompatible with explicit microdata foundations. Instead, microsimulation is required.
Implications for data collection systems in a national statistical agency
These implications may not be that costly (relative to primary data collection costs), and most are relatively straightforward:
- Data collection processes cannot exist as “stovepipe” systems, in isolation from one another.
- One kind of coordination across data collection processes is use of common concepts and definitions (e.g., identical definitions and methods for eliciting educational attainment).
- The other kind of coordination is assuring appropriate overlap in content – basically to anticipate the need for synthetic statistical matching (or equivalent methodologies).
- Microanalytic uses of raw data are far more demanding of data quality than aggregative uses.
- In effect, this means that data collection systems must be jointly planned, and that micro level data quality standards must be more stringent.
Source: Michael C. Wolfson, Socio-Economic Statistics and Public Policy: A New Role for Microsimulation Modeling
ISBN: 0-662-21734-9. A Paper Prepared for the 50th Session of the International Statistical Institute, Beijing, 21-29 August 1995
A lifecourse perspective is particularly well-suited to policy analysis. It examines the different trajectories through which people pass during the course of life and how what happens at stage of life affects later stages. It takes account of the interactions that occur across the various domains of life (including in the family, at school, at work and in leisure), the role of social interactions, as well as the societal, economic, and environmental contexts in which people live.
- It provides an understandable framework that is suited to many types of analysis, such as those related of human development or social capital, as well as the more customary types of cross-sectional economic analysis.
- It holds potential for more integrated analysis of the combined effects on individual lives of tax and transfer programs, programs that provide services, and programs that are based on regulation.
The model of society used in the Olivia framework was adapted for use in the 2011 social accounting framework paper that is discussed in the next section.
A4. Planning Initiative of 2011: a new audience for social statistics and the need to develop standard micro-level concepts
In 2011 Statistics Canada, in conjunction with Employment and Social Development Canada, commissioned papers that explored future directions in social statistics. As noted, the conceptual framework discussed in Chapters 2 and 3 of the present paper is a revised version of one those papers, “A Framework for Citizen-Centred Social Statistics and Analysis”. Another paper by Martin Cooke explored the potential use of lifecourse perspectives in national social statistics.
Individuals and institutions as a key audience. The mandate provided for the 2011 project is of particular interest. It called for …a conceptual and measurement framework for renewing Canada’s social data system to ensure that future social data can meet informational needs of Canadians, businesses, and institutions … and should cover multiple fields (e.g., economics, sociology, psychology). While seemingly straight-forward, this mandate in fact represented a call for a deep change in the system of national social statistics:
- In this definition of the audience, the primary users of the data are individuals and institutions. Then, and still now, by far the most important users of social statistics are analysts in governments, academia, think tanks and interest groups. Data reach individuals typically through the analytic and other reports of these intermediaries or through the media. It was clarified at the time that, while traditional analytic users were of course not to be ignored, the new focus was indeed to be on direct uses by individuals and institutions.
- At present, national social statistics reflect the conceptual perspectives of economics. To seriously incorporate the perspectives of psychologists and sociologists would require a rethinking of the content social statistics and the use of quite different approaches to consultation, outreach, and partnership.
The current strategic plans being developed by Statistics Canada, as described in the “Future Directions” paper, maintain these new perspectives and a plan is presented for making them operational.
Distinguishing what we wish to measure and what we actually measure. A Framework for Citizen-Centred Social Statistics and Analysis placed huge emphasis on the necessity, in a micro-based statistics system, of defining all the variables (and statistical units and classification schemes) in a way that was based on what we wanted to measure in the real world, without reference to the source of the data. It is essential to determine, and define, the model of society that national social statisticians will measure. We need an equivalent to SNA for social statistics, but defined at the micro level.
Figure A1 is an updated version of the model of society that was proposed, at least as it relates to a cross-sectional perspective. It is based on the early work on social accounting, Wolfson’s approach to operationalizing a model of society using microsimulation tools, and the Olivia framework, as discussed in the preceding sections. The model in Figure A1 has been updated for purpose of this annex by:
- Using ‘quality of life’ wording instead of the social wellbeing terminology.
- Limiting the framework to its cross-sectional dimension since that is all that is required to develop the new standard concepts and definitions for existing variables. Nearly all existing social microdata are based on point-in-time readings.
There is a need to gradually develop a statistical language that covers the longitudinal and lifecourse dimensions. The model in Figure A1 has been designed to facilitate that evolution – as explained in “A Framework for Citizen-Centred Social Statistics and Analysis”.
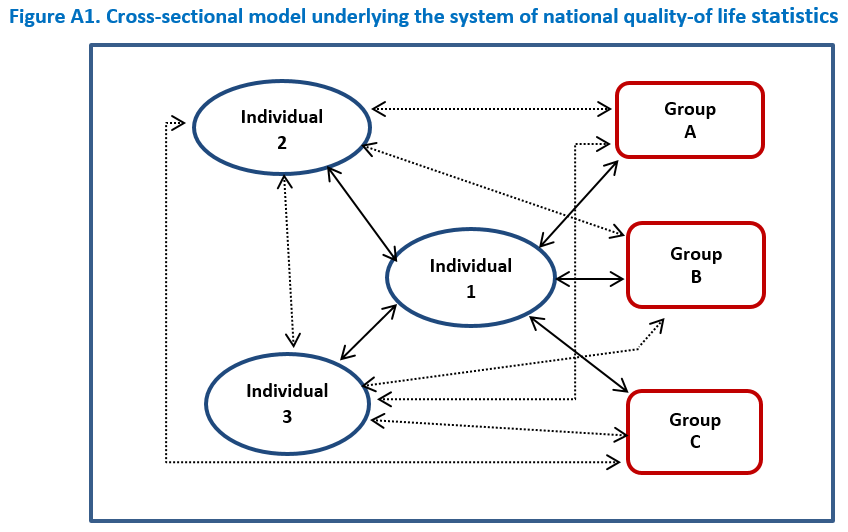
Description for Figure A1
The attributes of individuals are described under the following headings:
- Assets and capacities related to quality of life. These can be accumulated or lost over time and, accordingly, play a large role in analysis related to sustainability as well a current wellbeing. These include:
- Financial and material assets including housing
- Human capital including health, skills, e.g., health status, skill levels
- Social capital, defined in terms of social networks
- Perceived wellbeing and associated factors, e.g., workplace quality, safety, housing conditions
- Socio-economic and cultural characteristics that are related to quality of life and analysis of inequality, e.g., race age, gender, language, place of birth
- Membership in groups that play independent societal roles with respect to well-being such as families, workplaces, schools. Some groups or institution are also separately identified in the model.
- Geographic location, which is also separately described in the model.
The attributes of groups are described under the following headings:
- Inputs
- Processes
- Outputs
- Outcomes
- Current geographic location, which is also described separately in the model.
Note: The statistical system includes information obtained directly from the group or institution and from those individuals who comprise the group, e.g.,
- Workplace information obtained both from employers and from the individuals who work there.
- Information about a government program obtained from admin data and from surveys of the individuals who receive the program benefit.
Examples of groups include family groupings, workplaces, social service institutions and government programs, retail stores and personal services, as well as social networks, including via social media.
The flows are the transactions and activities shown by the double-headed arrows connecting individuals and groups.
These are often referred to as interactions or relationships. The definitions of interactions or flows in this cross-sectional model are organized as follows:
- Monetary transactions measured in dollars (such as purchasing goods or receiving Employment Insurance benefits);
- Non-monetary activities (where the interaction involves services or information) measured in terms of time (hours, weeks, or years as appropriate).
- In addition, there are self-directed activities (uses of time such sleeping or time alone) that are not shown on the chart.
- There are also derived flows or activities (i.e., not observable in the real world), often involving multiple, user-defined activities, such as those used in the unemployment measure.
Note that most flows (apart from the self-directed activities) are reciprocal, involving exchanges of money, services, or information, as suggested by the use of double headed arrows.
For sake of simplicity, the flows among groups are not shown.
Geographic locations are also described separately.
Although not shown in the chart, the statistical system also records information about the geographic areas that are identified in the descriptions of individuals and groups, including:
- Environmental information such as pollution, green spaces, temperature.
- Economic variables such as GDP, housing costs or local unemployment rates.
- Access measures such as the existence of schools, hospitals, social services, and walkable shopping.
A5. Beyond GDP initiatives
The preceding sections described the antecedents to a conceptual framework for a system of national social statistics based on microdata, going back to the 1970s. However, the main work over this period has been on further developing the SNA in the social areas and on social indicators. This section and the next make observations on these developments and how they relate to the micro-based conceptual framework described in this paper.
On the SNA front there has been, and continues to be, much work in going “beyond GDP”, including work on extending the market-based SNA framework to social areas. There are international plans to include a labour account as part of the core SNA and to create a supplementary training and education account. Canada has developed satellite accounts related to the value of household work, the non-profit sector, pensions, and culture. As noted earlier, the micro model of society discussed in this paper is entirely compatible the macro model used in SNA including its recent extensions.
In recent years, emphasis in all areas of statistics, including in the SNA, has been placed on measuring not only progress in achieving social wellbeing but also implications for equality and sustainability. A 2019 book by Rutger Hoekstra, Replacing GDP by 2030: Towards a Common language for the Wellbeing and Sustainability Community, makes an ambitious proposal for an integrated set of social, economic, and environmental accounts that addresses both equality and sustainability. His proposal, which is summarized in Box A3, uses the following devices to integrate the various accounts:
- Stocks and flows, which provide a common accounting language in areas of environmental, economic, and other social areas of study.
- Networks, which describe the linkages among the many actors within and between systems, including norms, rules, and institutional arrangements.
- Limits, which are the boundaries of various stocks, flows and networks, such as the fixed number of hours in a day, or events which mark the boundary when a system shifts from one state to another (such as the marriages or births that change the fundamental characteristics of family lifecourse trajectories).
These are the same tools of integration that have been built in micro-based conceptual framework described in this paper.
Whether or not the Hoekstra proposal proves to be too ambitious to be implemented, it is reassuring to note that similar conceptual approaches to integration can apply to both the micro approach to a national quality-of-life statistics as well as to big thinking about global macro accounts. Progress on both fronts is likely to be harmonious.
Box A3. Hoekstra on replacing GDP by 2030
In his 2019 book, Replacing GDP by 2030: Towards a Common language for the Wellbeing and Sustainability Community, Rutger Hoekstra proposes a new system of Global and National Accounts.
By global he does not mean only the sum of national measures, but rather measures that also describe what is happening at the level of the globe taken as whole including environmental and economic phenomena that cross national boundaries.
Components of the System
The proposed system of Global and National Accounts would consist of five subsets.
- Global Environmental Accounts describing stocks and flow in the broader environmental system – an extension of the longstanding System of Environmental and Economic Accounting. It measures stocks and flows of an economy, including physical flows in terms of mass and energy units, as well as resource use or emissions by industry.
- Global Societal Accounts describing stocks and flows in the core societal system, the human dimension of the broader environment. See details below.
- Global Economic Accounts describing the economic system, one element of society. These accounts are like the present SNA but use the entire globe as the scope rather than the nation and use both non-monetary and monetary units of measurement and descriptors.
- Global Distribution Accounts directly dealing with inequality. It describes the distributional aspects of the three core ‘systems’ accounts above.
- Global Quality Accounts and Quality Indicators: a separate quality account using different techniques to assess whether the systems above are moving in the right direction.
Details of the Global Societal Accounts
This is the component that mainly overlaps the Canadian system of national quality-of-life statistics, although the Canadian micro-based system also integrates distribution and quality dimensions which are treated in separate compartments by Hoekstra.
The Global Societal Accounts measure:
- How many we are. The approach is the usual one of showing how demographic flows (birth, migration, etc.) affect the stock of people in the next time period.
- Who are we. Stocks and flows are similarly examined for people in a wide variety of demographic, social and economics categories. These include additions to and deletions from the stocks of skills, health, income, assets, financial assets, et al. for people with different socio-economic characteristics.
- How we are organized. There would be accounts related to the various institutions (households, firms, social groups) to which the individuals belong. The linkages (networks) among individuals and institutions would be described.
- What we do. Recording time use (which is both a limit and a powerful accounting device) is the final dimension of the social accounts.
A conceptual framework that allows integration
The following concepts, which are common to many scientific disciplines, provides a framework for the development of a universal language that can be apply in each of the five sets of accounts:
- Stocks and flows which provides a common accounting language in many areas of environmental, economic, and other social areas of study.
- Networks which describe the linkages among the actors within and between systems, including norms, rules, and institutional arrangements.
- Limits, which are the boundaries of various stocks, flows and networks, such as the fixed number of hours in a day, or events which mark the boundary when a system shifts from one state to another (such as the temperature shifts that result in liquid water turning into ice or vapour, or the marriages or births that changes the fundamental characteristics of a family.
Implementation strategy
Building on the precedents set by the development of global environmental measures and System of National Accounts, Hoekstra argues that international bodies, with the support of national governments, should take the lead in coordinating the work of the global scientific community in developing these new accounts, which have been structured in a way that should facilitate the needed international coordination.
A6. Quality of life indicators
Recent years have seen much interest in the development of social indicators in many countries and internationally, again with recent developments adding a focus on equality and sustainability, as well as the more traditional measures of social progress. The OECDs better life initiative is the best-known example.
In Canada, work has been underway since 2019 in the Department of Finance (with support from Statistics Canada on statistical matters) on developing quality-of -life indicators with a view to their use in the policy process. While more development is needed, this work has reached a level of maturity that a description of the proposed approach was included in Budget 2021.
The Finance proposal is described in Box A4 on the next page.
In describing the criteria for choosing the indicators that are shown in Box A4, particularly heavy weight was given in both the Finance paper and in an earlier Statistics Canada background paper to consistency with other indicators and related initiatives, both domestic and international.
- Particular attention was paid to mapping the proposal against the Canadian Index of Well-being and the OECD’s Better Life indicators (the main domestic and international indicators with similar goals) and with the Canadian indicators associated with UNs Sustainable Development Goals.
- In addition, the consistency with dozens of related initiatives was explored, including the international ‘Beyond GDP ’ work associated with the System of National Accounts, the well-being frameworks introduced in other countries, and a range of Canadian measurement frameworks that are, for example, related gender, to indigeneity, to poverty, and to children and families.
The choice of indicators is pragmatic and not based on an exogenous macro-level theory about the operation of society. Rather it reflects trade-offs based on data availability, anticipated uses and consistency with other indicators. This is in line with the direction being proposed by Statistics Canada’s new directions for the system of national quality-of-life statistics where consistency and integration are built into the standard definitions of variables that reflect a model of society at the micro level, thereby avoiding the need for rigid top-down hierarchies.
The Finance proposal, in its present form, examines the uses of the proposed indicators taken in isolation from the rest of the system of quality-of-life statistics. When and if they are included on the Statistics Canada website, their usefulness will be considerable enhanced through their association with a range of additional dashboards designed to support particular policy and program agendas, as well as linkages to supporting tables and microdata files.
Box A4. The Quality-of-Life Indicators in Budget 2021: a work in progress
Starting in 2020, the Department of Finance, with the technical support of Statistics Canada, has explored the possible use of quality of life indicators in decision-making and budgeting. It was publicly released in Budget 2021, alongside the longer report “Measuring What Matters”. Most recently, as outlined in the President of the Treasury Board Mandate Letter (released in December 2021), the Treasury Board Secretariat will assume leadership for refining and strengthening the Framework, with a focus on advancing the implementation of Quality of Life indicators and applying the Framework to decision making across government.
Objectives
The objective is to provide indicators of progress in achieving:
- Quality of Life, including non-economic factors like health, housing, environment, and safety.
- Equality, looking at the distribution of outcomes and opportunities across places and people.
- Sustainability, looking at whether today's prosperity undermines future living standards.
The subject-matter domains that are covered
The indicators cover five domains associated with quality of life plus a sixth complementary measure of life satisfaction. The domains are divided into sub-domains as follows:
- Prosperity: Income and growth, Employment and job quality, Skills and opportunity, Economic security and deprivation.
- Health: Healthy people, Healthy care systems.
- Environment: Environment and people, Ecological integrity, and Environmental stewardship.
- Society: Culture and identity, Social cohesion and connections, Time use.
- Good Governance: Safety and security, Democracy and institutions, Justice and human rights.
- Life satisfaction and sense of meaning and purpose are two measures of overall or subjective well-being, positioned at the centre of the Framework (in the report, these are identified as ‘additional’ indicators).
Headline indicators
The Quality of Life Framework for Canada is organized into a series of domains, each of which includes a number of indicators. As of March 2022, the Framework consists of 85 indicators, with 20 being identified as headline indicators. Headline indicators are intended to provide a high-level assessment of overall quality of life in Canada.
For example, the Employment and job quality subdomain under the Prosperity heading above, includes the following indicators, with employment being identified as the headline indicator:
- Employment (headline indicator)
- Labour underutilization
- Wages
- Precarious or gig work
- Job satisfaction
Criteria for choosing indicators
The chosen indicators must not only be capable of measuring overall trends and levels, but they must also provide indicators of equality and sustainability. This means that:
- Many must be capable of being disaggregated to include data for smaller at-risk populations as well as providing direct measures of deprivation.
- There must be measures of both stocks (e.g., household wealth, skills, health status) and flows (e.g., wages, physical activity, time use).
Other criteria include being:
- Meaningful in that they are easily understood and relevant to general understandings of what constitute quality of life. They should cover a wide range of factors associated with quality of life.
- Available from existing sources (or be readily attainable) and meet the usual statistical tests of timeliness, accuracy, and accountability as well a granularity - and be comparable over time and with related indicators.
- Useful in policy making, i.e., sensitive to changes in policy, showing impact of policy changes and consistency with other domestic and international frameworks. (The Finance version refers to federal policy, but the indicators on the Statistics Canada website would be relevant to all social policies and would be supported by many additional dashboards designed to inform particular policy and program agendas.)
Flexibility
- The choice of indicators was based on practical compromises that met the criteria above. These trade-offs reflected both data availability and consultations on the usefulness of various measures. The goal is to produce evergreen, flexible indicators that evolve over time and in light of changing needs and new data sources.
- There is a mix of subjective and objective indicators, with subjective measures in both the domain indicators and as an added supplementary measure.
- While the focus is on indicators that measure quality of life outcomes, there are also some indicators of the determinants of those outcomes, with no distinction made between the two.
- No overall composite indicator is created.
A7. Policy and technological trends towards individualized programing
This concluding section describes broader shifts that are taking place in society, in technology, and in social policy that are shaping the future directions of the system of national social statistics.
Changes in values – what we mean by social progress and wellbeing and the way we interpret dignity, equality, and freedom of individuals – will have deep repercussions for the kinds of social statistics that will be needed. A 2015 essay published by the Institute for Research on Public Policy, The Enabling Society, describes how results from various waves of the World Values Survey indicate a clear trend across both the developing and industrialized worlds toward increased weight being placed on values such as autonomy, greater participation in decision-making, self-actualization, and developing individual capacities in a way that respects equality and tolerance.
Social policy of course reflects these individual-centric value shifts, but with lags and cycles – as do the national statistics that support those policies. Earlier sections have described plans for making individuals a prime audience for social statistics, with those statistics based on a conceptual model of society that centres on individuals and their interaction with others.
Social programs, and the statistical information that is used in their design – and in the measurement of their impact – reflect not only societal values, but also the limits and capacities of current technology.
The Enabling Society essay argued that a big step forward in social policy occurred during the 1960s and 70s when Canada put in place its version of mature welfare state programming. Especially in its universality, that programming represented a major step beyond the more fragmented, often paternalistic, social programs that preceded them.
- The success of the mature welfare state programming was due in part to the computing technology that was then new.
- That technology provided the capacity for social policy to meet the broadly defined needs of broadly defined groups of beneficiaries in a broadly uniform manner – often at a point in time or stage of life – by using separate program silos that could provide efficient and accountable delivery.
While a major improvement, the resulting welfare state programming still places people in standard boxes and provides highly compartmentalized interventions.
- Individuals must access different programming streams that are often uncoordinated and with designs that support the efficiency and accountability of those who deliver the programs, not the needs of their recipients.
- Many social problems today are cast in terms of discrimination and inequality related to gender, race, disability, age, and many other areas where society systematically puts people in boxes that are not relevant to the issue at hand and fails to respect the huge diversity that actually exists in real life.
We now have the technology, including the use of big data and predictive analytics, to allow programming to be far more responsive to the diverse needs of individuals and to respect the value shifts mentioned above.
The Enabling Society essay argues that the availability of new technologies for collecting and analyzing social statistics means that we are on the cusp of a new period of transformative change towards a citizen-centred social policy:
- Where social programs and services will be much more tailored to the needs and circumstances of specific individuals over the course of their lives, consistent with a greater emphasis on supporting individuals in developing their capabilities.
- Where the values of autonomy, respect, equality, and sustainability are more consciously built into the design of social programming and social policies.
Transitioning to such an enabling society will require a major, if gradual, overhaul of statistical systems in ways that are well reflected in Statistics Canada’s the “Future Directions” paper.
- There will be much more disaggregated data about individuals and the contexts in which individual lives unfold, with analysis based on anonymized microdata.
- Statistics will be able to better trace the combined effects of programs and services on the lives of citizens over the course of life.
- Individuals, and the social service agents who assist individuals, will (gradually) become the main users of the system of social statistics which will provide the tailor-made information about the probability of success of alternative interventions in shaping future life.
- Date modified: