
Analytical Studies: Methods and References
Defining and Measuring Business Exits Using Monthly Data Series on Business Openings and Closures

Archived Content
Information identified as archived is provided for reference, research or recordkeeping purposes. It is not subject to the Government of Canada Web Standards and has not been altered or updated since it was archived. Please "contact us" to request a format other than those available.
Skip to text
Text begins
Abstract
This article describes the methodology of measuring exits (or permanent closures) in the monthly estimates of business openings and closures. By linking the payroll deductions file to the Business Register, it is possible to derive a survival model and determine that the average length of time that a business is closed before resuming its activities is six months. In addition, the analysis of closures over six months established that 76.1% became exits as defined by the Longitudinal Employment Analysis Program (LEAP). By combining these two methods and comparing the growth rates of closures of more than six months with the growth rates of exits, the LEAP definition of an exit will be used in the monthly series. Given the lack of timeliness associated with this definition, by performing a regression of the growth rate of the number of exits according to LEAP over the growth rate of closures of more than six months, the percentage change in exits is predicted up to the last month for which closures of more than six months are available.
1 Introduction
In 2020, Statistics Canada began publishing monthly releases of data on business openings and closures.Note These data provide a better understanding of business dynamics and provide decision makers with evidence to support economic policy development. For example, the COVID-19 pandemic led to many businesses closing because of public health restrictions imposed by different levels of government. Data on business reopenings and entrants, which have been published since February 2021, show the extent and speed of economic recovery. However, they cannot indicate whether a closure is temporary or permanent. Data from the Longitudinal Employment Analysis Program (LEAP) contain information on exits, but they are published with a two-year lag due to the processing of T4 slips, which are the primary source of these data. As a result, using LEAP, the long-term impacts of the pandemic cannot be determined until mid-2022.
This methodological article, which complements Lafrance-Cooke et al. (2020), describes how this lack of current data will be addressed by adding the number of exits (permanent closures) to the monthly estimates of business openings and closures.
The analysis in this article is based primarily on the payroll deduction forms linked to the Business Register. These data helped to measure the number of exits using the definition from LEAP: an exit at time t is a closure at time t not followed by a reopening at the end of t and t+1. Based on current data, this definition cannot measure exits that took place until December 2019. A survival model showed that the average closure time is six months. Comparing the monthly growth rates of exits and closures lasting more than six consecutive months showed a near-perfect correlation between the two. As a result, it is possible to project the number of exits using predictions of their growth rate derived from the regression of exits on closings of more than six months.
The next section briefly describes the data used in this article, while the section thereafter presents the analytical framework for measuring business exits. The conclusion and perspectives are presented in the last section.
2 Data
The data used in this article are primarily from payroll deductions forms (PD7) linked to the Business Register. The fact that the data are monthly is particularly useful in determining the duration of an exit. The PD7 files linked to the Business Register enable a business to be tracked from its closingNote to its reopening, if applicable. It is therefore possible to calculate the number of months a business was inactive. Although PD7 files are available up to August 2021, the analysis covers the period from January 2015 to December 2019. This avoids any bias that would be caused by the sharp increase in closures in 2020 due to the pandemic.
3 Analytical framework
Business entrants and exits are two important factors in analyzing the dynamics of businesses because of their link to growth, productivity or the adoption of new technologies (e.g., Baldwin and Gu, 2011; and Macdonald, 2014 in Canada; De Monte, 2020 in France). Unfortunately, even though the exit of a business can be observed, it is difficult to measure it. Unless there is a survey of closed businesses, which presents challenges in collecting data, or media coverage of a permanent closure, such as for very large businesses, it is almost impossible to determine whether a closure is temporary or permanent. However, it is clear that an exit is necessarily a closure. In addition, businesses that close can be classified into two groups: temporary exits, consisting of businesses that have resumed their activities (reopenings), and extended exits, representing businesses that have remained inactive since closing (probable exits).
3.1 Survival model
The link between reopenings and exits is used to determine whether a business remained inactive long enough to be considered an exit. The time required for a closed business to resume its activities also corresponds to the minimum closure time for that business to be considered an exit.
To do this, a survival model—also known as a duration model—is developed considering only reopenings to predict the median duration of an exit. It should be noted that the sample is limited to businesses that have been inactive for 24 months or less (representing 93% of all reopenings). The reasons for this are twofold: to dispose of outliers, and because the benchmark definition Note of an exit used in this article is the one from the Longitudinal Employment Analysis Program (LEAP) (i.e., a closure not followed by a reopening at the end of the current and subsequent year), which would give a maximum of 24 months for an exit in January. In addition, businesses that are closed for only one month are excluded from the model in order to account for delays by some companies in making their PD7 remittances and thus to avoid underestimating the duration of closures.
The Weibull parametric model,Note whose dependent variable is the period a business is closed, is used in this article. There is no censorship in this analysis because the closing dates (starting point to calculate the duration) and reopening dates (date of the event) are known for all businesses. The closure period therefore represents the number of months between closure and reopening. The three-digit North American Industry Classification System (NAICS) codes are included as controls to account for differences between industries. Some industries are more likely to see closures, because of seasonal businesses. The size of the business as measured by the number of employeesNote in the month prior to closure is also included in the model because the data show differences in closure durations by business size. The employment rate added to the model is to account for macroeconomic variations that can influence reopening.
The survival model estimate was used to calculate the median duration of a closure for each business that had to resume its activities, by size and industrial sector and the employment rate in the month prior to closure. The median values obtained are aggregated to produce the data in Table 1, which show that businesses that resume their activities were, on average, closed for six months. This is a threshold that could be considered to define an exit, but the margin of error would be quite significant given that some seasonal businesses can be inactive for more than six months. As reported by Lafrance-Cooke et al. (2020), in the work on business dynamics, a business is not generally considered to be an exit when the closure lasted for less than one year. This is consistent with the results of the survival model. The predicted maximum duration of closure for businesses that resumed their activities is 12 months, which could correspond to the threshold at which businesses would be classified as exits.
Different versions of the model were considered to ensure robust results. Even though the industry is controlled in the base model, industry-specific regressions (two-digit NAICS code) have similar results to the base model. Moreover, instead of predicting the median duration, predicting the average duration using the base model also produces quite similar results. The analysis in this article is for the national level. However, a version of the survival model in which the provincial employment rate and an indicator of geographic region were added produced results comparable to those presented in Table 1.
| Number of businesses | Average | Minimum | Maximum |
|---|---|---|---|
| 918,077 | 6 | 5 | 12 |
| Source: Statistics Canada, authors’ calculations. | |||
3.2 Closure threshold simulation
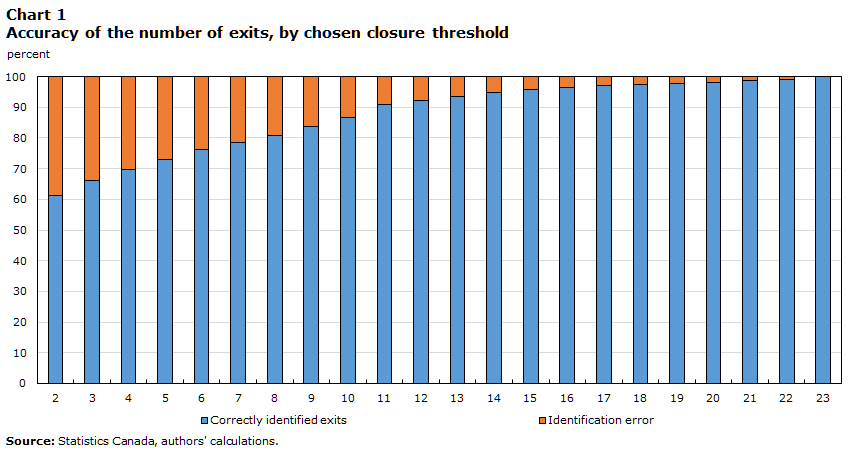
In compliance with the survival model, an exit could be defined as a closure of more than 12 months. However, the data show that some businesses resume their activities after more than 12 months of exit. The simulation carried out in this section determines the level of error associated with the threshold selection. This not only helps to either confirm or negate the result produced by the survival model, but also to determine a confidence interval for the threshold to be used. An exit is correctly predicted when the closure period is above the established threshold and the business has not reopened. In contrast, there is a prediction error when the closure period is above the threshold, but the business reopened. Only reopenings that occur no later than the year following closure are considered. For example, a business that closed in March 2016 and reopened in April 2017 will have been inactive for 13 months. With a threshold of 12, it will mistakenly be considered an exit. However, if the reopening took place in January 2018 or after, a threshold of 12 would be a correct prediction, and the business will then be classified as a new business, which may be the result of organizational restructuring or a resumption of economic activity.
The simulation presented in Chart 1, with thresholds ranging from 2 to 23 months, shows that the margin of error decreases as the threshold increases. In other words, the higher the threshold, the more accurate is the number of estimated exits; for example, with a two-month threshold, 38.6% of the businesses classified as exits resumed their activities. This figure fell to 23.9% and 7.7% for thresholds of 6 and 12 months, respectively. Based solely on this simulation, 24 should be the minimum number of months of closure for a business to be classified as an exit, because with a threshold of 23, the level of accuracy is 100% if the definition from LEAP is considered to be an indicator of actual exits. It is important to note that the LEAP definition that was used as a reference is also unable to capture all exits. For example, a business may resume its activities after several years of closure, which is why it is necessary to define a breaking point.
Data table for Chart 1
| Correctly identified exits | Identification error | |
|---|---|---|
| percent | ||
| 2 | 61.4 | 38.6 |
| 3 | 66.1 | 33.9 |
| 4 | 69.7 | 30.3 |
| 5 | 73.1 | 26.9 |
| 6 | 76.1 | 23.9 |
| 7 | 78.6 | 21.4 |
| 8 | 80.9 | 19.1 |
| 9 | 83.8 | 16.2 |
| 10 | 86.6 | 13.4 |
| 11 | 90.8 | 9.2 |
| 12 | 92.3 | 7.7 |
| 13 | 93.6 | 6.4 |
| 14 | 94.7 | 5.3 |
| 15 | 95.7 | 4.3 |
| 16 | 96.4 | 3.6 |
| 17 | 97.0 | 3.0 |
| 18 | 97.4 | 2.6 |
| 19 | 97.8 | 2.2 |
| 20 | 98.1 | 1.9 |
| 21 | 98.7 | 1.3 |
| 22 | 99.1 | 0.9 |
| 23 | 100.0 | 0.0 |
| Source: Statistics Canada, authors’ calculations. | ||
3.3 Defining and measuring exits
Even if the accuracy of the data is 100% with a threshold of 23, their timeliness would be lacking as long as there is a two-year lag before being published, which is a relatively long time between the exit and the availability of information. The number of closures of over 12 months is also thought to represent an adequate approximation of the number of exits, but could be released only after 15 months, taking into account the three-month lag to process PD7 data. The six-month threshold based on the survival model would be useful in publishing more timely data on exits, but the data would have a 23.9% margin of error if based on the simulation.
However, a comparison of the growth rates of the number of closures of more than six months and the number of exits based on the LEAP definition revealed similar trends between the two series.Note As shown in Chart 2, the monthly percentage changes are almost identical over the period for which the two series are available, from January 2015 to December 2019. Therefore, by performing a regression of the growth rate of the number of exits according to LEAP over the growth rate of closures of more than six months, the percentage change in exits can be predicted up to the last month for which closures of more than six months are available. The predicted growth rates can then be applied to the last month for which exits are available in order to produce a projection.

Data table for Chart 2
| Date | Exits | Closures of more than six months |
|---|---|---|
| number | ||
| 2015 | ||
| February | -5.70 | -13.60 |
| March | 3.30 | 0.30 |
| April | -30.00 | -30.20 |
| May | -19.40 | -16.80 |
| June | 56.90 | 45.80 |
| July | -8.80 | -3.60 |
| August | -18.50 | -21.00 |
| September | 40.50 | 43.30 |
| October | -11.70 | -6.50 |
| November | 15.80 | 5.20 |
| December | -10.30 | -8.60 |
| 2016 | ||
| January | 38.70 | 71.50 |
| February | -6.40 | -8.80 |
| March | -1.80 | -7.60 |
| April | -42.20 | -46.30 |
| May | 10.10 | 4.40 |
| June | 1.00 | 6.20 |
| July | 58.70 | 46.10 |
| August | -30.50 | -30.40 |
| September | 19.70 | 28.80 |
| October | -8.00 | -3.90 |
| November | 32.60 | 16.50 |
| December | -13.70 | -12.30 |
| 2017 | ||
| January | 26.00 | 78.20 |
| February | -23.60 | -41.20 |
| March | 24.90 | 37.80 |
| April | -48.60 | -52.90 |
| May | 0.60 | -5.00 |
| June | 60.00 | 53.60 |
| July | -17.50 | -11.40 |
| August | -14.70 | -19.90 |
| September | 68.10 | 68.40 |
| October | -28.60 | -20.90 |
| November | -19.40 | -21.00 |
| December | 47.80 | 37.60 |
| 2018 | ||
| January | 26.70 | 77.70 |
| February | -21.00 | -39.70 |
| March | 18.00 | 22.70 |
| April | -48.40 | -50.70 |
| May | 17.60 | 8.50 |
| June | 31.70 | 33.10 |
| July | -23.10 | -16.30 |
| August | 17.00 | 3.90 |
| September | 28.30 | 33.60 |
| October | -28.80 | -20.50 |
| November | 108.90 | 67.10 |
| December | -40.80 | -33.10 |
| 2019 | ||
| January | 30.30 | 84.40 |
| February | -16.30 | -37.80 |
| March | -0.30 | 9.60 |
| April | -43.20 | -47.90 |
| May | 15.80 | 8.00 |
| June | 63.60 | 52.90 |
| July | -25.50 | -18.90 |
| August | -18.30 | -20.30 |
| September | 77.30 | 70.10 |
| October | -34.90 | -25.80 |
| November | 15.50 | 9.10 |
| December | 16.30 | 14.70 |
|
Note: LEAP = Longitudinal Employment Analysis Program Source: Statistics Canada, authors' calculations. |
||
As a result, the LEAP definition of an exit is maintained; a business is classified as exited in month M of year Y if it is closed in month M of year Y and remained inactive until the end of year Y+1. For all months of year Y except December, exits will be measured using the values observed up to Y-2 and the projected values between Y-1 and Y. For December, year Y-1 is observed and only Y is projected; for example, if the last available data point is August 2021, then all the measures of exits between 2020 and 2021 would be based on the projection. However, if the last data point is December 2021, only the exits in 2021 are projected.
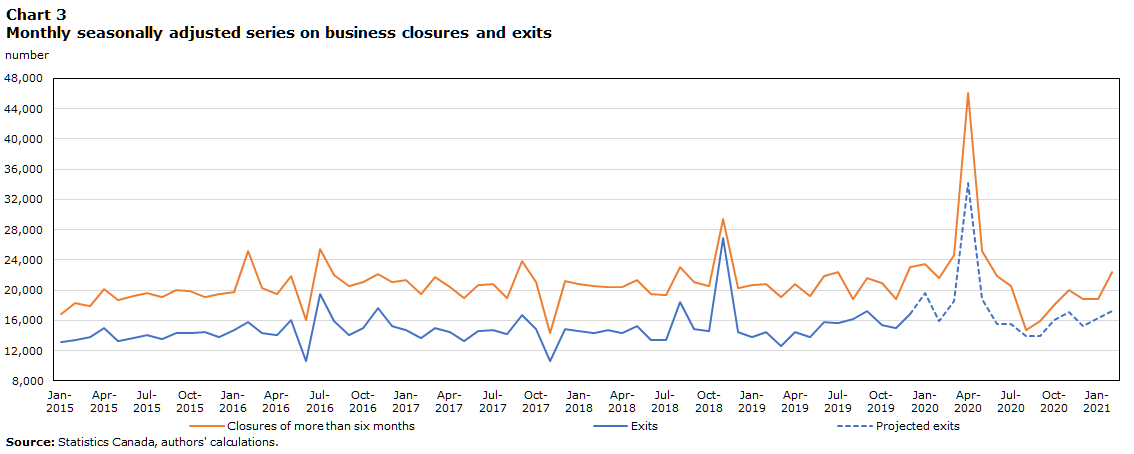
Chart 3 shows that preliminary seasonally adjusted data on exits and the number of closures of more than six months between January 2015 and February 2021 follow similar trends. Public health restrictions related to the pandemic brought about unusual changes in business dynamics. As a result, the observed relationship between closures and exits that underlies the use of growth rates to project the number of exits may not hold. This would bias the estimates. However, the gap between the values projected and the actual values should be mitigated by the measures implemented by governments to support businesses and prevent termination of employment.
Data table for Chart 3
| Date | Exits | Projected exits | Closures of more than six months |
|---|---|---|---|
| number | |||
| 2015 | |||
| January | 1,314,400 | 0 | 1,687,000 |
| February | 1,337,500 | 0 | 1,826,300 |
| March | 1,381,300 | 0 | 1,784,000 |
| April | 1,494,900 | 0 | 2,009,600 |
| May | 1,330,200 | 0 | 1,867,200 |
| June | 1,369,200 | 0 | 1,917,600 |
| July | 1,401,300 | 0 | 1,958,200 |
| August | 1,351,000 | 0 | 1,914,500 |
| September | 1,426,100 | 0 | 2,001,000 |
| October | 1,430,300 | 0 | 1,986,600 |
| November | 1,446,000 | 0 | 1,910,000 |
| December | 1,382,000 | 0 | 1,941,700 |
| 2016 | |||
| January | 1,467,100 | 0 | 1,976,300 |
| February | 1,571,400 | 0 | 2,511,100 |
| March | 1,433,500 | 0 | 2,021,700 |
| April | 1,400,600 | 0 | 1,951,200 |
| May | 1,607,600 | 0 | 2,189,500 |
| June | 1,056,900 | 0 | 1,600,400 |
| July | 1,950,100 | 0 | 2,550,300 |
| August | 1,591,200 | 0 | 2,196,700 |
| September | 1,403,300 | 0 | 2,060,500 |
| October | 1,493,900 | 0 | 2,101,500 |
| November | 1,761,700 | 0 | 2,209,600 |
| December | 1,525,100 | 0 | 2,106,700 |
| 2017 | |||
| January | 1,476,700 | 0 | 2,133,100 |
| February | 1,359,400 | 0 | 1,948,500 |
| March | 1,503,400 | 0 | 2,170,500 |
| April | 1,443,600 | 0 | 2,043,200 |
| May | 1,321,400 | 0 | 1,892,800 |
| June | 1,454,100 | 0 | 2,061,900 |
| July | 1,473,200 | 0 | 2,087,000 |
| August | 1,419,900 | 0 | 1,896,600 |
| September | 1,673,100 | 0 | 2,383,300 |
| October | 1,486,300 | 0 | 2,105,100 |
| November | 1,060,800 | 0 | 1,430,700 |
| December | 1,480,000 | 0 | 2,119,000 |
| 2018 | |||
| January | 1,456,900 | 0 | 2,076,700 |
| February | 1,426,600 | 0 | 2,054,400 |
| March | 1,474,100 | 0 | 2,043,900 |
| April | 1,431,200 | 0 | 2,039,600 |
| May | 1,518,800 | 0 | 2,131,500 |
| June | 1,336,900 | 0 | 1,943,900 |
| July | 1,338,000 | 0 | 1,935,900 |
| August | 1,840,300 | 0 | 2,309,400 |
| September | 1,481,500 | 0 | 2,111,900 |
| October | 1,455,400 | 0 | 2,053,000 |
| November | 2,689,300 | 0 | 2,947,200 |
| December | 1,442,800 | 0 | 2,028,700 |
| 2019 | |||
| January | 1,378,200 | 0 | 2,068,200 |
| February | 1,448,200 | 0 | 2,078,400 |
| March | 1,260,600 | 0 | 1,903,100 |
| April | 1,443,900 | 0 | 2,080,000 |
| May | 1,379,700 | 0 | 1,924,200 |
| June | 1,575,600 | 0 | 2,187,000 |
| July | 1,557,800 | 0 | 2,235,600 |
| August | 1,615,200 | 0 | 1,888,200 |
| September | 1,719,000 | 0 | 2,157,000 |
| October | 1,544,300 | 0 | 2,089,800 |
| November | 1,496,500 | 0 | 1,886,300 |
| December | 1,679,600 | 1,679,600 | 2,300,000 |
| 2020 | |||
| January | 0 | 1,956,500 | 2,339,300 |
| February | 0 | 1,592,400 | 2,165,400 |
| March | 0 | 1,850,500 | 2,470,700 |
| April | 0 | 3,418,600 | 4,613,700 |
| May | 0 | 1,888,300 | 2,515,600 |
| June | 0 | 1,556,300 | 2,189,400 |
| July | 0 | 1,553,200 | 2,060,500 |
| August | 0 | 1,393,000 | 1,467,300 |
| September | 0 | 1,391,900 | 1,591,200 |
| October | 0 | 1,600,500 | 1,798,700 |
| November | 0 | 1,708,500 | 2,001,000 |
| December | 0 | 1,531,000 | 1,876,800 |
| 2021 | |||
| January | 0 | 1,628,000 | 1,887,400 |
| February | 0 | 1,722,700 | 2,234,300 |
| Source: Statistics Canada, authors' calculations. | |||
The PD7 files currently available are used to establish closures of more than 12 months up to August 2020. In addition, Chart 1 shows that 92.3% of businesses that were inactive for more than 12 consecutive months were exits as per the LEAP definition. Based on this comparison, it is possible to have an approximation of the error associated with the projection over the period from January to August 2020. By applying the method of projecting exits to closures of more than 12 months, the projected number of closures of more than 12 months can be compared with those observed between January and August 2020. This exercise helped to determine that on average, the projected values are different from those observed by 9.0%. Given the proximity between closures of more than 12 months and exits, a similar margin of error can be anticipated.
4 Conclusion
This analysis helped to fill a data gap on business dynamics inasmuch as monthly estimates on business openings and closures will include data series on business exits. By linking the payroll deductions file to the Business Register, it was possible to derive a survival model and determine that the average length of time that a business is closed before resuming its activities is six months. The median closure time is estimated by industry and size of the business in the month prior to its closure, as well as the employment rate. In addition, the analysis of closures over six months established that 76.1% became exits as defined by the Longitudinal Employment Analysis Program (LEAP).
By combining these two methods and comparing the growth rates of closures of more than six months with the growth rates of exits, the LEAP definition of an exit will be used. An exit in month M of year Y is therefore a closure in month M of Y and is not followed by a reopening at the end of Y and Y+1. This definition is nonetheless associated with a period of up to 24 months between the closure and the availability of information. The exit measures published in the Common Output Data Repository are a combination of current and projected values. For all months of year Y except December, the measure of exits will be composed of values observed up to Y-2 and values projected between Y-1 and Y. For December, year Y-1 is observed and only Y is projected. Projected growth rates are obtained from the regression of the growth rate of the number of exits according to LEAP over the rate of closures of more than six months.
The series on business exits combined with the one on business entrants will provide researchers and decision makers with evidence of business dynamics. For example, these series will provide a better understanding of the long-term effects of the COVID-19 pandemic on business operations. In addition, the turnover rate of businesses—a characteristic often considered in the analysis of business dynamics—can be derived from measures of business entrants and exits.
This methodological article on business openings and closures is the second of its kind after Lafrance-Cooke et al. (2020). Work on this topic continues in order to add new indicators. For instance, job creation and destruction associated with business entrants and exits are indicators that help to better put labour market variations into context.
Bibliography
Baldwin, J.R. & Gu. W. (2011). Firm dynamics and productivity growth: A comparison of the retail trade and manufacturing sectors. Industrial and Corporate Change, 20 (2): 367-395.
Ciobanu, O. & Wang. W. (2012). Firm Dynamics: Firm Entry and Exit in Canada, 2000 to 2008 (The Canadian Economy in Transition, No. 022)
De Monte, E. (2020).Entry, Exit and Productivity: Evidence from French Manufacturing Firms (Working Papers of BETA, no 2020-07), Bureau d’Économie Théorique et Appliquée, University of Strasbourg.
Lafrance-Cooke, A., Macdonald R. and Willox M. (2020). Monthly Business Openings and Closures: Experimental Series for Canada, the Provinces and Territories, and Census Metropolitan Areas (Economic Insights, No. 116).Statistics Canada.
Macdonald, R. (2014). Business Entry and Exit Rates in Canada: A 30-year Perspective (Economic Insights, No. 38). Statistics Canada.
- Date modified: