
Research to Insights: Cannabis in Canada

Archived Content
Information identified as archived is provided for reference, research or recordkeeping purposes. It is not subject to the Government of Canada Web Standards and has not been altered or updated since it was archived. Please "contact us" to request a format other than those available.
About Research to Insights
The Research to Insights series of presentations features a broad range of findings on selected research topics. Each presentation draws from and integrates evidence from various studies that use innovative and high-quality data and methods to better understand relevant and complex policy issues.
Based on applied research of valuable data, the series is intended to provide decision makers, and Canadians more broadly, a comprehensive and horizontal view of the current economic, social and health issues we face in a changing world.
Background
Canada is the first major industrialized country to provide legal and regulated access to cannabis for non-medical purposes
- The Cannabis Act (C-45) came into force on October 17, 2018. The Act legalizes and strictly regulates the production, distribution, sale, import and export, and possession of cannabis for adults of legal age.
- During the first year of legalization of cannabis for non-medical purposes, legal sales were limited to dried cannabis, fresh cannabis, cannabis oil, cannabis plants and cannabis seeds. Starting on October 17, 2019, a wider array of products was permitted for legal production and sale, including cannabis extracts, edibles and topicals.
- The regulation of cannabis remains a shared responsibility of the federal, provincial and territorial governments. Provinces and territories are responsible for regulating cannabis sales and distribution in their jurisdiction. They also have the flexibility to establish more stringent controls, such as further restrictions for personal (home) cultivation, restricting public use and access to some products, or increasing the minimum legal age.
The main objectives of the Act are to keep cannabis out of the hands of youth, keep profits out of the pockets of criminals, and protect public health and safety by allowing adults access to a quality-controlled supply of legal cannabis.
For more information: Cannabis Legalization and Regulation.
By October 17, 2023, it will have been five years since cannabis was legalized for non-medical purposes in Canada
- After identifying data needs and data sources, Statistics Canada made the following adaptions to the national statistical system to measure the social, health and economic impacts of legalized cannabis:
- Introduction of new surveys
- Exploration of alternative data sources
- Addition of new questions to existing surveys
- Integration of cannabis into the Canadian System of Macroeconomic Accounts
- A cannabis economic account – The framework
- Constructing Historical Cannabis Consumption Volume Estimates for Canada, 1960 to 2015
- The Daily—Provincial and Territorial Cannabis Economic Accounts, 2017
- Integrating the production, distribution and consumption of cannabis in the Canadian national economic accounts.
For studies about the preparations for legalization, see
- Preparing the statistical system for the legalization of cannabis
- Preparing the social statistics system for the legalization of cannabis.
Cannabis use before legalization had been steadily increasing over the last 30 years

Data table for Chart 1
| HPS | NADS | GSS | CADS | CTUMS/ CTADS | |
|---|---|---|---|---|---|
| percent | |||||
| 1985 | 5.6 | Note ...: not applicable | Note ...: not applicable | Note ...: not applicable | Note ...: not applicable |
| 1989 | Note ...: not applicable | 6.5 | Note ...: not applicable | Note ...: not applicable | Note ...: not applicable |
| 1990 | 5.1 | Note ...: not applicable | Note ...: not applicable | Note ...: not applicable | |
| 1993 | Note ...: not applicable | Note ...: not applicable | 4.2 | Note ...: not applicable | Note ...: not applicable |
| 1994 | Note ...: not applicable | Note ...: not applicable | Note ...: not applicable | 7.5 | Note ...: not applicable |
| 2002 | Note ...: not applicable | Note ...: not applicable | Note ...: not applicable | Note ...: not applicable | Note ...: not applicable |
| 2004 | Note ...: not applicable | Note ...: not applicable | Note ...: not applicable | Note ...: not applicable | 9.4 |
| 2005 | Note ...: not applicable | Note ...: not applicable | Note ...: not applicable | Note ...: not applicable | 9.7 |
| 2006 | Note ...: not applicable | Note ...: not applicable | Note ...: not applicable | Note ...: not applicable | 9.5 |
| 2007 | Note ...: not applicable | Note ...: not applicable | Note ...: not applicable | Note ...: not applicable | 9.4 |
| 2008 | Note ...: not applicable | Note ...: not applicable | Note ...: not applicable | Note ...: not applicable | 9.0 |
| 2009 | Note ...: not applicable | Note ...: not applicable | Note ...: not applicable | Note ...: not applicable | 9.3 |
| 2010 | Note ...: not applicable | Note ...: not applicable | Note ...: not applicable | Note ...: not applicable | 8.9 |
| 2011 | Note ...: not applicable | Note ...: not applicable | Note ...: not applicable | Note ...: not applicable | 9.3 |
| 2012 | Note ...: not applicable | Note ...: not applicable | Note ...: not applicable | Note ...: not applicable | 10.2 |
| 2013 | Note ...: not applicable | Note ...: not applicable | Note ...: not applicable | Note ...: not applicable | 10.6 |
| 2015 | Note ...: not applicable | Note ...: not applicable | Note ...: not applicable | Note ...: not applicable | 12.3 |
| 2017 | Note ...: not applicable | Note ...: not applicable | Note ...: not applicable | Note ...: not applicable | 14.8 |
|
... not applicable Notes: The line through the chart is a linear trend line. HPS= Health Promotion Survey; NADS= National Alcohol and Drug Survey; GSS= General Social Survey; CADS= Canadian Alcohol and Other Drugs Survey; CTUMS/CTADS= Canadian Tobacco Use Monitoring Survey and Canadian Tobacco Alcohol and Drugs Survey. Sources: 1985 and 1991 Health Promotion Survey; 1989 National Alcohol and Drug Survey; 1993 General Social Survey; 1994 Canada's Alcohol and Other Drugs Survey; 2004 to 2012 Canadian Tobacco Use Monitoring Survey; and 2013, 2015 and 2017 Canadian Tobacco, Alcohol and Drugs Survey. |
|||||
The rate of cannabis use more than doubled between 1985 and 2017, from 5.6% to 14.8%.
For more information: Analysis of trends in the prevalence of cannabis use in Canada, 1985 to 2015.
Cannabis use continued to change from 2018 to 2020

Data table for Figure 1
| Cannabis use by province | Percentage of Canadians 15 years and older who consumed cannabis in the three months preceding the survey | ||
|---|---|---|---|
| Fourth quarter 2020 | Change in percentage points from first quarter 2019 (after legalization) | Change in percentage points from first quarter 2018 (before legalization) | |
| percentage | |||
| Canada | 20 | 2 | 6 |
| British Columbia | 25 | 6 | 8 |
| Alberta | 22 | No change | No change |
| Saskatchewan | 14 | No change | No change |
| Manitoba | 22 | 9 | No change |
| Ontario | 23 | No change | 10 |
| Quebec | 11 | No change | No change |
| New Brunswick | 18 | No change | No change |
| Nova Scotia | 27 | 9 | No change |
| Prince Edward Island | 22 | 7 | 8 |
| Newfoundland and Labrador | 20 | No change | No change |
| Source: Statistics Canada, National Cannabis Survey, first quarters of 2018 and 2019 and fourth quarter of 2020. | |||
By 2021, the rates of past-year cannabis use stabilized across Canada, although regional rate differences remain
- In 2021, the rates of cannabis use were higher than the rest of Canada in British Columbia, Alberta, Ontario, Nova Scotia and Prince Edward Island, whereas cannabis use in Quebec remained lower.
- Some studies conducted during the COVID-19 pandemic suggest that cannabis consumption may have increased in response to the changed daily routines and related stress.
- Whether the higher rates of cannabis use reported during the pandemic will remain is yet to be determined, but as daily routines are reinstated and more recent data become available, this can be studied.

Data table for Chart 2
| 2020 | 2021 | ||
|---|---|---|---|
| percent | |||
| Canada (provinces only) | Canada | 22.2 | 22.4 |
| British Columbia | B.C. | 24.4 | 26.0Data table for chart 2 Note ‡ |
| Alberta | Alta. | 25.8 | 24.9Data table for chart 2 Note ‡ |
| Saskatchewan | Sask. | 23.3 | 21.6 |
| Manitoba | Man. | 21.8 | 21.0 |
| Ontario | Ont. | 23.0 | 23.8Data table for chart 2 Note ‡ |
| Quebec | Que. | 17.1 | 15.7Data table for chart 2 Note ‡ |
| New Brunswick | N.B. | 23.8 | 23.7 |
| Nova Scotia | N.S. | 27.8 | 31.5Data table for chart 2 Note ‡ |
| Prince Edward Island | P.E.I. | 23.7 | 28.4Data table for chart 2 Note ‡ |
| Newfoundland and Labrador | N.L. | 22.2 | 24.3 |
Sources: Canadian Community Health Survey, 2020 and 2021. |
|||
For more information: Canadians who report lower self-perceived mental health during the COVID-19 pandemic more likely to report increased use of cannabis, alcohol and tobacco and The Daily—Alcohol and cannabis use during the pandemic: Canadian Perspectives Survey Series 6.
Cannabis use also differs by age and increased for most age groups
- Cannabis use is most common among 18- to 24-year-olds.
- Use among 15- to 17-year-olds has not increased with legalization.
- By contrast, use in other age groups rose from 2011 to 2021.

Data table for Chart 3
| Age group | 2011 | 95% confidence interval | 2012 | 95% confidence interval | 2013 | 95% confidence interval | 2015 | 95% confidence interval | 2017 | 95% confidence interval | 2019 | 95% confidence interval | 2021 | 95% confidence interval | |||||||
|---|---|---|---|---|---|---|---|---|---|---|---|---|---|---|---|---|---|---|---|---|---|
| Lower | Upper | Lower | Upper | Lower | Upper | Lower | Upper | Lower | Upper | Lower | Upper | Lower | Upper | ||||||||
| percent | |||||||||||||||||||||
| 15 to 17 | 18.7 | 2.3 | 2.6 | 16.6 | 2.1 | 2.3 | 17.7 | 2.6 | 3.0 | 17.5 | 3.4 | 4.0 | 14.2 | 1.9 | 2.2 | 17.3 | 2.3 | 2.6 | 15.6 | 2.7 | 3.2 |
| 18 to 24 | 26.0 | 2.0 | 2.1 | 27.3 | 1.8 | 1.9 | 27.1 | 2.6 | 2.8 | 28.4 | 2.7 | 2.9 | 31.4 | 2.4 | 2.5 | 40.8 | 2.6 | 2.7 | 39.0 | 3.4 | 3.5 |
| 25 to 44 | 10.8 | 1.7 | 1.9 | 13.7 | 2.1 | 2.4 | 13.9 | 2.2 | 2.6 | 17.7 | 2.3 | 2.5 | 21.8 | 3.2 | 3.6 | 30.1 | 1.2 | 1.3 | 31.2 | 1.4 | 1.5 |
| 45 to 64 | 5.1 | 0.9 | 1.1 | 4.6 | 0.9 | 1.1 | 6.1 | 1.2 | 1.4 | 7.0 | 1.2 | 1.5 | 9.4 | 1.6 | 1.9 | 15.7 | 0.9 | 0.9 | 18.3 | 1.1 | 1.1 |
| 65 or older | Note ...: not applicable | Note ...: not applicable | Note ...: not applicable | 1.1 | 0.5 | 0.8 | 0.7 | 0.3 | 0.6 | 1.6 | 0.6 | 0.9 | 3.0 | 1.3 | 2.1 | 6.3 | 0.5 | 0.5 | 8.2 | 0.6 | 0.7 |
| 15 or older | 9.3 | 0.7 | 0.8 | 10.2 | 0.8 | 0.9 | 10.6 | 0.9 | 1.0 | 12.3 | 1.0 | 1.0 | 14.8 | 1.3 | 1.4 | 21.3 | 0.6 | 0.6 | 22.4 | 0.7 | 0.7 |
|
... not applicable Notes: The red line refers to the enactment of the Cannabis Act (October 17, 2018). Error bars represent the lower and upper 95% confidence interval. Sources: Statistics Canada, 2011 and 2012 Canadian Tobacco Use Monitoring Survey; 2013, 2015 and 2017 Canadian Tobacco, Alcohol and Drugs Survey; and 2019 and 2021 Canadian Community Health Survey. |
|||||||||||||||||||||
An objective of the Cannabis Act is to keep cannabis out of the hands of youth.
Access to legal cannabis increased since the Cannabis Act came into force
- By the end of 2018, there were fewer than 200 legal stores. By the end of 2020, the number of stores had increased nearly eightfold then doubled again by the second quarter of 2022. Data from the first quarter of 2023 suggest the number of stores has stabilized.

Data table for Chart 4
| Quarters | ||||||||||
|---|---|---|---|---|---|---|---|---|---|---|
| 2018 | 2019 | 2020 | 2021 | 2022 | 2023 | |||||
| Q4 | Q1 and Q2 | Q3 and Q4 | Q1 and Q2 | Q3 and Q4 | Q1 and Q2 | Q3 and Q4 | Q1 and Q2 | Q3 and Q4 | Q1 | |
| number of stores | ||||||||||
| Canada | 182 | 315 | 728 | 998 | 1,445 | 2,185 | 2,852 | 3,167 | Note ..: not available for a specific reference period | 3,332 |
|
Notes: Counts are subject to multiple revisions and may include e-commerce only entities. Q3 and Q4 2022 estimates are not available. Source: Statistics Canada, Business Register. |
||||||||||
An objective of the Cannabis Act is to protect public health and safety by allowing adults access to regulated, legal cannabis.
Canada’s cannabis sector grew from October 2018 to December 2022, but started to decline in 2023
- The economic activities associated with cannabis have always been in the Canadian economy but were allocated to other activities.
- Legalization made the direct measurement of the industry possible.
- Before legalization, experimental (modelled) estimates of cannabis-related economic activity were developed to create provisional measures of production and consumption activities.
- The cannabis sector accounts for about 0.5% of the total Canadian economy.

Data table for Chart 5
| Millions of chained (2012) dollars | |
|---|---|
| 2018 | |
| October | 6,484 |
| November | 6,338 |
| December | 6,196 |
| 2019 | |
| January | 6,890 |
| February | 6,660 |
| March | 7,012 |
| April | 7,571 |
| May | 7,972 |
| June | 8,091 |
| July | 8,419 |
| August | 8,468 |
| September | 8,475 |
| October | 9,768 |
| November | 9,059 |
| December | 8,491 |
| 2020 | |
| January | 8,678 |
| February | 8,774 |
| March | 8,846 |
| April | 8,759 |
| May | 8,840 |
| June | 9,079 |
| July | 9,145 |
| August | 9,128 |
| September | 9,025 |
| October | 9,367 |
| November | 9,620 |
| December | 10,083 |
| 2021 | |
| January | 9,912 |
| February | 9,790 |
| March | 10,010 |
| April | 10,038 |
| May | 10,171 |
| June | 10,380 |
| July | 10,506 |
| August | 10,439 |
| September | 10,574 |
| October | 10,810 |
| November | 10,818 |
| December | 10,956 |
| 2022 | |
| January | 10,932 |
| February | 10,961 |
| March | 11,133 |
| April | 11,181 |
| May | 11,341 |
| June | 11,332 |
| July | 11,302 |
| August | 11,429 |
| September | 11,438 |
| October | 11,574 |
| November | 11,605 |
| December | 11,566 |
| 2023 | |
| January | 11,451 |
| February | 11,151 |
| March | 10,927 |
| April | 10,821 |
| May | 10,750 |
| June | 10,778 |
| July | 10,830 |
|
Note: The red line refers to an important change to the Cannabis Act, initiated on October 17, 2019, which made extracts, edibles and topical cannabis products eligible for legal sale. Source: Statistics Canada, Gross domestic product (GDP) at basic prices, by industry, monthly. Table 36-10-0434-01. |
|
Retail sales of non-medical cannabis are a growing fraction of the retail sales of alcohol
- From 2019 to 2022, liquor authorities and other retail outlets sold, on average, $26 billion worth of alcoholic beverages annually in Canada.
- In 2022, the annual sales of cannabis for non-medical purposes by provincial cannabis authorities and other retail outlets were $4.5 billion.

Data table for Chart 6
| Beer, wine, liquor | Non-medical cannabis | |
|---|---|---|
| millions of dollars | ||
| 2018 | ||
| Q4 | 6,505 | 156 |
| 2019 | ||
| Q1 | 4,800 | 168 |
| Q2 | 6,203 | 252 |
| Q3 | 6,633 | 355 |
| Q4 | 6,616 | 415 |
| 2020 | ||
| Q1 | 5,206 | 485 |
| Q2 | 6,513 | 566 |
| Q3 | 7,114 | 737 |
| Q4 | 7,036 | 825 |
| 2021 | ||
| Q1 | 5,375 | 839 |
| Q2 | 6,647 | 916 |
| Q3 | 7,175 | 1,031 |
| Q4 | 7,324 | 1,049 |
| 2022 | ||
| Q1 | 5,351 | 1,030 |
| Q2 | 6,789 | 1,125 |
| Q3 | 7,377 | 1,175 |
| Q4 | 7,401 | 1,190 |
| 2023 | ||
| Q1 | 5,466 | 1,166 |
| Q2 | 6,856 | 1,264 |
|
Notes: Cannabis retailers [459993] and beer, wine and liquor retailers [4453]; the series is unadjusted because no seasonal pattern has been established for the official statistics of the cannabis industry in Canada. Source: Statistics Canada, Table 20-10-0056-01 Monthly retail trade sales by province and territory (x 1,000). |
||
Government revenue from the control and sale of alcohol and cannabis for non-medical purposes totalled more than $15 billion in 2021/2022 (includes net income from provincial liquor and cannabis authorities, excise taxes, retail sales taxes, other specific taxes, and licences and permits).
For more information: The Daily—Control and sale of alcoholic beverages and cannabis, April 1, 2021 to March 31, 2022.
More Canadians getting cannabis legally or growing it
- An estimated 68% of cannabis users reported obtaining at least some of the cannabis they consumed from a legal source in 2020, higher than before legalization in 2018 (23%) and just after legalization in 2019 (47%). Growing cannabis, either themselves or by someone else, was a supply source for 14% of consumers in 2020, higher than in 2018 (8%) or 2019 (9%).

Data table for Chart 7
| 2018 | 2019 | 2020 | |
|---|---|---|---|
| percent of cannabis consumers | |||
| Grown by the user or another person | 8.0Data table for chart 7 Note ‡ | 9.0Data table for chart 7 Note ‡ | 14.2 |
| Friends and family | 47.0Data table for chart 7 Note ‡ | 37.0Data table for chart 7 Note ‡ | 28.6 |
| Illegal | 51.3Data table for chart 7 Note ‡ | 38.1 | 35.4 |
| Legal | 22.9Data table for chart 7 Note ‡ | 47.4Data table for chart 7 Note ‡ | 68.4 |
Source: Statistics Canada, National Cannabis Survey, first quarter 2018, first quarter 2019 and fourth quarter 2020. |
|||
For more information: Looking back from 2020, how cannabis use and related behaviours changed in Canada.
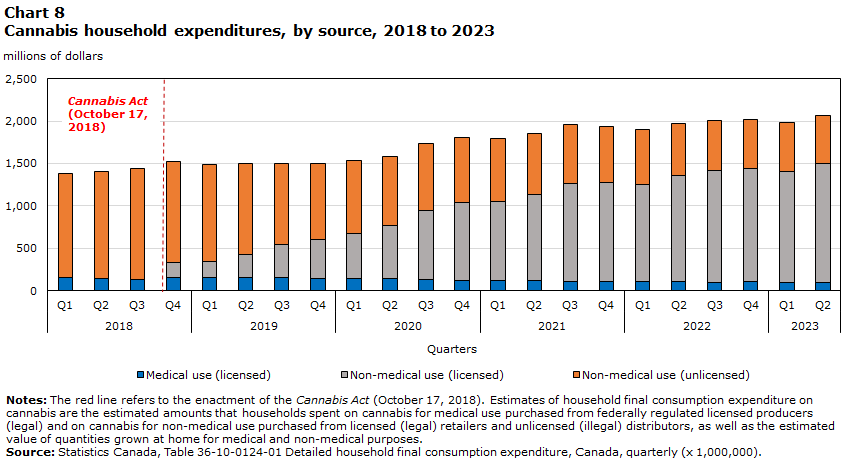
By the first half of 2023, more than 70% of the total value of cannabis consumed in Canada was from a legal (licensed medical and non-medical) source, an increase from 22% in the fourth quarter of 2018, when legalization had just begun
Data table for Chart 8
| Non-medical use (licensed) | Non-medical use (unlicensed) | Medical use (licensed) | |
|---|---|---|---|
| millions of dollars | |||
| 2018 | |||
| Q1 | 0 | 1,232 | 154 |
| Q2 | 0 | 1,254 | 147 |
| Q3 | 0 | 1,304 | 133 |
| Q4 | 175 | 1,190 | 153 |
| 2019 | |||
| Q1 | 185 | 1,152 | 155 |
| Q2 | 274 | 1,072 | 152 |
| Q3 | 393 | 954 | 151 |
| Q4 | 457 | 894 | 145 |
| 2020 | |||
| Q1 | 537 | 855 | 139 |
| Q2 | 626 | 820 | 140 |
| Q3 | 821 | 788 | 126 |
| Q4 | 919 | 764 | 121 |
| 2021 | |||
| Q1 | 935 | 749 | 114 |
| Q2 | 1,021 | 716 | 113 |
| Q3 | 1,150 | 694 | 111 |
| Q4 | 1,170 | 660 | 105 |
| 2022 | |||
| Q1 | 1,150 | 639 | 107 |
| Q2 | 1,254 | 609 | 107 |
| Q3 | 1,319 | 591 | 92 |
| Q4 | 1,336 | 580 | 104 |
| 2023 | |||
| Q1 | 1,308 | 577 | 92 |
| Q2 | 1,408 | 570 | 93 |
|
Notes: The red line refers to the enactment of the Cannabis Act (October 17, 2018). Estimates of household final consumption expenditure on cannabis are the estimated amounts that households spent on cannabis for medical use purchased from federally regulated licensed producers (legal) and on cannabis for non-medical use purchased from licensed (legal) retailers and unlicensed (illegal) distributors, as well as the estimated value of quantities grown at home for medical and non-medical purposes. Source: Statistics Canada, Table 36-10-0124-01 Detailed household final consumption expenditure, Canada, quarterly (x 1,000,000). |
|||
An objective of the Cannabis Act is to reduce or eliminate the illegal market.
Dried cannabis is the most popular product sold in the legal market and is also the product used by most consumers
- Self-reported National Cannabis Survey data also show that about 7 in 10 Canadians who reported using cannabis in 2020 consumed dried flower or leaf, while 41% reported consuming edible cannabis products.

Data table for Chart 9
| Percent | |
|---|---|
| Dried flower/ leaf | 71.1 |
| Inhaled extracts | 18.1 |
| Ingested extracts | 3.9 |
| Solid edibles | 4.1 |
| Beverages | 1.5 |
| Topicals, seeds and other cannabis products | 1.3 |
| Source: Statistics Canada, Table 10-10-0164-01 Sales of cannabis by liquor and cannabis authorities and other retail outlets, by cannabis type. | |
By affording adult consumers the option to purchase a wider array of legal cannabis products beginning in October 2019 has helped the legal industry compete with the illegal market.
For more information: The Daily — Control and sale of alcoholic beverages and cannabis, April 1, 2021 to March 31, 2022 and Looking back from 2020, how cannabis use and related behaviours changed in Canada.
Cannabis-related drug offences drop as a result of legalization
- Before legalization, cannabis possession was almost always illegal and accounted for the majority of cannabis-related drug offences.
- After legalization, total cannabis-related offences fell overall, and now most offences are related to illicit importation and exportation.

Data table for Chart 10
| Rate per 100,000 population | |
|---|---|
| 2001 | 219 |
| 2002 | 222 |
| 2003 | 193 |
| 2004 | 213 |
| 2005 | 188 |
| 2006 | 183 |
| 2007 | 191 |
| 2008 | 197 |
| 2009 | 195 |
| 2010 | 221 |
| 2011 | 228 |
| 2012 | 212 |
| 2013 | 210 |
| 2014 | 194 |
| 2015 | 171 |
| 2016 | 154 |
| 2017 | 136 |
| 2018 | 99 |
| 2019 | 45 |
| 2020 | 34 |
| 2021 | 36 |
| 2022 | 28 |
|
Notes: Red line refers to enactment of the Cannabis Act (October 17, 2018). As a result of the coming into force of the Cannabis Act on October 17, 2018, a total of 22 new violations were added to the Uniform Crime Reporting (UCR) Survey. The UCR also expired all pre-existing cannabis-specific violations under the Controlled Drugs and Substances Act (CDSA). Given that the Cannabis Act was implemented in October 2018, cannabis-related offences under the Cannabis Act and those under the CDSA before October 2018 were combined to represent all cannabis-related offences for 2018. Drug-impaired driving offences are included elsewhere. In 2016, 81% (44,919/55,657) of cannabis offences reported to police were for possession. In 2022, 67% (7,203/10,824) of cannabis offences were for illicit importation/ exportation while possession accounted for 12%. Sources: Statistics Canada, Table 35-10-0177-01 and Uniform Crime Reporting Survey 2017 to 2022. |
|
By allowing the possession of legal cannabis for adults, the Cannabis Act keeps Canadians who consume cannabis out of the criminal justice system.
End of text box
For more information: Police-reported crime statistics in Canada, 2017, Police-reported crime statistics in Canada, 2018, Police-reported crime statistics in Canada, 2019, Police-reported crime statistics in Canada, 2020 and Police-reported crime statistics in Canada, 2021.
Cannabis use can be harmful
- According to a 2023 Health Reports study, 4.7% of past-year cannabis consumers (300,000 people) experienced impaired control over their use of cannabis.
- Impaired control is a key element of dependency (addiction).
- Monitoring the number of Canadians at risk of developing a cannabis addiction is important, as addiction can harm health and negatively affect school performance, work and financial well-being.
- An improved understanding of the patterns of use and the characteristics of the people vulnerable to dependency could help with the development of more effective policy, prevention and education initiatives.
Factors independently associated with a cannabis user’s risk of developing impaired control (element of dependency), included
- frequently using cannabis
- being male
- being 18 to 24 years old (compared with being older)
- being single or never married (compared with being married or in a common-law relationship)
- being from a lower-income household (compared with being from a higher-income one)
- having been diagnosed with an anxiety or mood disorder
- having started using cannabis by age 15 or younger (compared with starting at age 16 or 17).
For more information: Using the Severity of Dependence Scale to examine cannabis consumers with impaired control in Canada.
Summary of key findings
- It has been five years since cannabis for non-medical purposes was legalized. During this time, Statistics Canada has been contributing to an improved understanding of the social, health and economic impacts of this policy change.
- Some encouraging findings since legalization include an increase in the share of cannabis obtained from legal sources from 2018 to 2023, a decrease in the number of cannabis-drug offences (since legalization, possession is not considered a criminal offence, although there are exceptions), and no increase in rates of cannabis use among 15- to 17-year-olds.
- Cannabis can be harmful, and some Canadians struggle with impaired control over their use. People experiencing impaired control also experience other harms and difficulties.
- Cannabis use monitoring and research remain important given that legal non-medical use by adults in Canada is a recent policy change, the legal retail industry continues to adjust and mature, and the Cannabis Act regulations are under review.
Next steps
- Continue to collect and analyze information on cannabis consumers and the cannabis sector:
- National Cannabis Survey, in collection from July to October 2023
- Canadian Tobacco and Nicotine Survey, released September 2023
- Canadian Community Health Survey, annual
- Mental Health and Access to Care Survey, released September 2023
- Monthly Retail Trade Survey.
- Contribute to policy-relevant information.
For more information, please contact
analyticalstudies@statcan.gc.ca
- Date modified: