
Research to Insights: Early Learning and Child Care

Archived Content
Information identified as archived is provided for reference, research or recordkeeping purposes. It is not subject to the Government of Canada Web Standards and has not been altered or updated since it was archived. Please "contact us" to request a format other than those available.
Skip to text
Text begins
About Research to Insights
The Research to Insights series of presentations features a broad range of findings on selected research topics. Each presentation draws from and integrates evidence from various studies that use innovative and high-quality data and methods to better understand relevant and complex policy issues.
Based on applied research of valuable data, the series is intended to provide decision makers, and Canadians more broadly, a comprehensive and horizontal view of the current economic, social and health issues we face in a changing world.
Context
Child care participation is associated with greater labour market participation for families, specifically mothers

- In Quebec, the introduction of the low-cost universal child care program resulted in an increase in the labour force participation rate of women and in the use of paid child care.
- Hours worked rose by 9% for women with children in Quebec from 1998 to 2015—a contribution of $2.8 billion to gross domestic product.
- An increase in labour force participation might be expected at the national level given recent investments in child care.
High-quality early childhood environment associated with better short-, medium- and long-term outcomes for children
- High-quality care is associated with greater readiness for school, as well as social and cognitive well-being (NICHD Early Childhood Research Network, 2002).
- Targeted child care programs are positively associated with academic achievement and negatively associated with externalizing behaviour and justice outcomes (Heckman, 2006; 2013).
- In 2017/2018, the federal government announced an investment of $7.5 billion in funding for early learning and child care (ELCC) over 11 years, including $95 million in funding to support ELCC data and research.
- Budget 2021 included a $27.2 billion investment for affordable, accessible and high-quality child care.
- At the national level, there is little publicly available information on the supply or demand for child care, information that could help guide the development of Canada-wide ELCC and track the impacts of these investments.
For more information: Measuring the value of women’s contribution to the Canadian economy: New insights based on recent work (statcan.gc.ca).
To address data gaps, Statistics Canada has been guided by two early learning and child care frameworks for developing data and conducting analysis and research
- Creates a set of guiding principles for ELCC systems, data collection and research.
- The objective is to support child care that is
- accessible
- affordable
- flexible
- high quality
- inclusive
Multilateral Early Learning and
Child Care Framework

Indigenous Early Learning and
Child Care Framework

Describing early learning and child care in Canada from two perspectives
Supply (spaces)
Demand (use)

In April 2022, 12,466 child care centres across Canada provided full-time care to approximately 565,000 children aged 0 to 5 years and part-time care to 152,200 children aged 0 to 5 years
Start of text boxWhat will this look like after the implementation of the Canada-wide ELCC system?
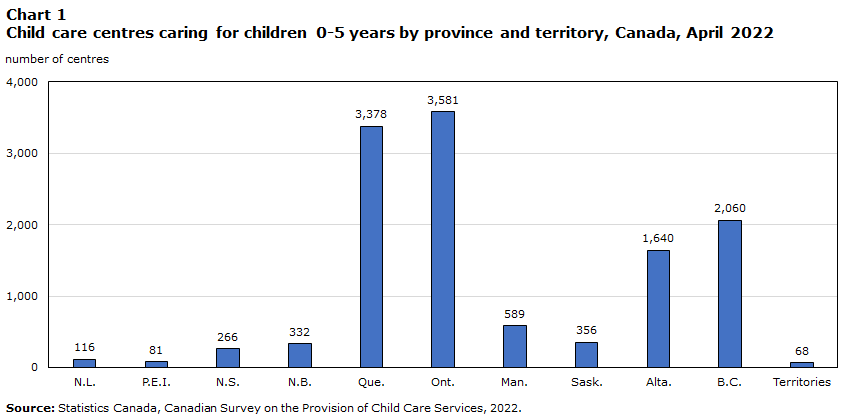
Data table for chart 1
| Number of centres | |
|---|---|
| N.L. | 116 |
| P.E.I. | 81 |
| N.S. | 266 |
| N.B. | 332 |
| Que. | 3378 |
| Ont. | 3581 |
| Man. | 589 |
| Sask. | 356 |
| Alta. | 1640 |
| B.C. | 2060 |
| Territories | 68 |
| Source: Statistics Canada, Canadian Survey on the Provision of Child Care Services, 2022. | |
For more information: Characteristics of child care centres serving children aged 0 to 5 years in Canada, 2021 to 2022 (statcan.gc.ca).
Supply: In 2022, approximately 4 in 10 child care centres were non-profit organizations
- Centres were more likely to have staff with postsecondary early childhood education (ECE) training and have different rates of pay based on ECE training.
- Having trained staff has been associated with higher-quality care.
- Non-profit child care was associated with offering higher rates of pay.
- Non-profit centres and centres with more ECE-trained staff charged lower daily fees.
The implementation of the Canada-wide ELCC system is intended to support primarily not-for-profit organizations.
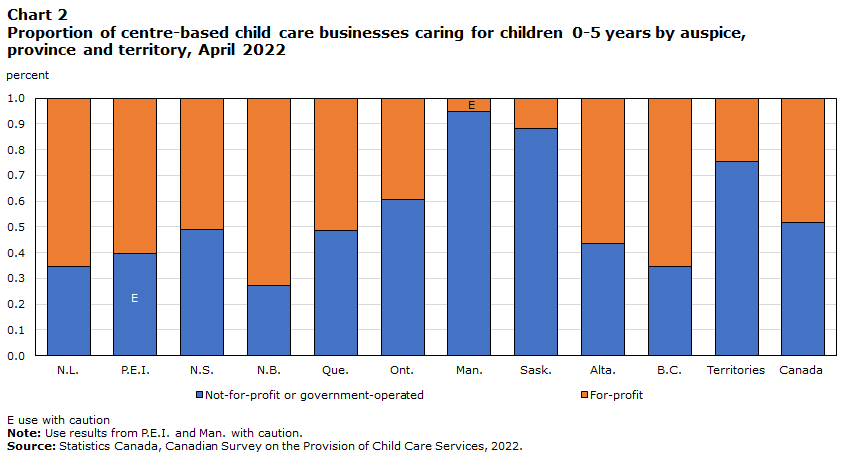
Data table for chart 2
| Not-for-profit or government-operated | For-profit | |
|---|---|---|
| percent | ||
| N.L. | 0.347 | 0.653 |
| P.E.I. | 0.396Note E: Use with caution | 0.604 |
| N.S. | 0.491 | 0.509 |
| N.B. | 0.271 | 0.729 |
| Que. | 0.488 | 0.512 |
| Ont. | 0.608 | 0.392 |
| Man. | 0.946 | 0.054Note E: Use with caution |
| Sask. | 0.881 | 0.119 |
| Alta. | 0.435 | 0.565 |
| B.C. | 0.347 | 0.653 |
| Territories | 0.755 | 0.245 |
| Canada |
0.517 | 0.483 |
|
E use with caution Note: Use results from P.E.I. and Man. with caution. Source: Statistics Canada, Canadian Survey on the Provision of Child Care Services, 2022 |
||
For more information: Characteristics of child care centres serving children aged 0 to 5 years in Canada, 2021 to 2022 (statcan.gc.ca).
Supply: Between 2008 and 2015, there were approximately 268,000 self-employed child care providers in Canada
- Home child care businesses tend to last less than three years.
- They are not necessarily households with small children.
- Almost 40% are owned by immigrants.
- Immigrant owners have different characteristics compared with non-immigrant owners (e.g., they are older and more likely to be from low-income households).
- Self-employed child care providers in Canada were more likely to exit and less likely to enter the market between 2008 and 2015.
Although they serve fewer children overall, there is a large number of home child care providers.
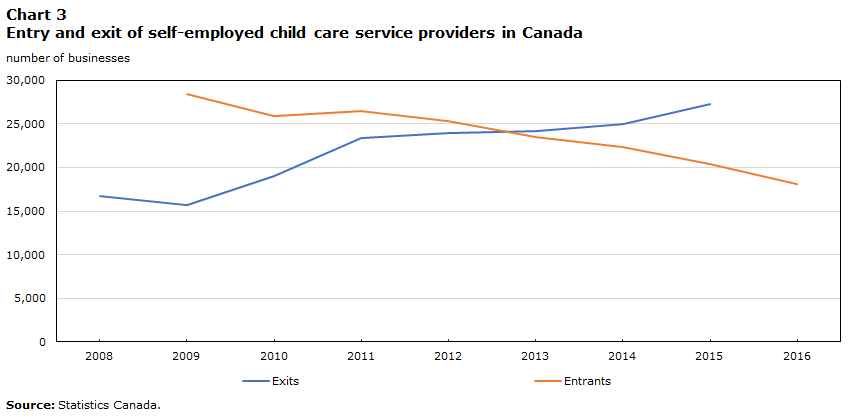
Data table for chart 3
| Exits | Entrants | |
|---|---|---|
| number of businesses | ||
| 2008 | 16,703 | Note ...: not applicable |
| 2009 | 15,730 | 28,459 |
| 2010 | 19,049 | 25,929 |
| 2011 | 23,353 | 26,516 |
| 2012 | 23,999 | 25,318 |
| 2013 | 24,148 | 23,492 |
| 2014 | 25,035 | 22,356 |
| 2015 | 27,254 | 20,449 |
| 2016 | Note ...: not applicable | 18,150 |
|
... not applicable Source: Statistics Canada. |
||
For more information: Exploring the business dynamics of self-employed child care service providers (statcan.gc.ca).
Supply: In 2016, the child care industry contributed $15.1 billion to Canadian gross domestic product
- Gross domestic product (GDP) in 2016 was $15.1 billion, 62.5% higher than in 2009.
- The child care industry is slightly higher than the fabricated metal manufacturing industry.
- About two-thirds of GDP is generated from businesses (half from parents, half from subsidies).
- About one-third of GDP comes from junior and senior kindergarten.
- GDP growth rates vary widely across provinces and territories because of the introduction of full-day junior kindergarten and changes in funding or business activity within that jurisdiction.
- GDP is higher and growing faster in larger, incorporated businesses, which are likely licensed child care businesses that are centres, are larger and have more employees.
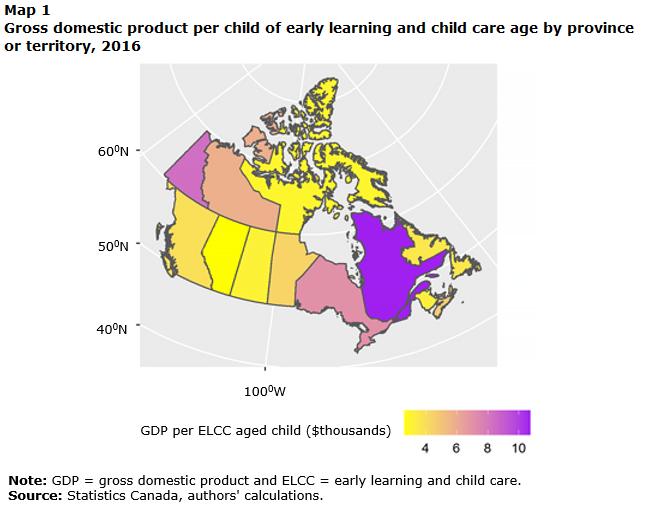
Data table for Map 1
| Millions of dollars | |
|---|---|
| Newfoundland and Labrador | 3,612 |
| Prince Edward Island | 4,870 |
| Nova Scotia | 4,759 |
| New Brunswick | 3,280 |
| Quebec | 10,737 |
| Ontario | 7,061 |
| Manitoba | 4,367 |
| Saskatchewan | 3,149 |
| Alberta | 2,638 |
| British Columbia | 3,936 |
| Yukon | 8,333 |
| Northwest Territories | 5,833 |
| Nunavut | 3,016 |
|
Note: GDP refers to gross domestic product and ELCC refers to early learning and child care. Source: Statistics Canada, authors' calculations. |
|
Supply: The child care workforce has a different profile of characteristics than workers not in the early learning and child care industry
- Early childhood educators and assistants (ECEAs) and home child care providers (CCPs) had distinct profiles for some characteristics (e.g., ECEAs were younger than CCPs).
- There was an overrepresentation of immigrants in both ECEA and CCP occupations, and the representation of non-white, non-Indigenous population groups was different across ELCC occupations.
- Retention in an ELCC occupation was more likely for
- women compared with men
- older workers compared with younger workers
- workers who were married or common law (compared with single workers)
- full-time versus part-time workers
| ELCC workers | Non-ELCC workers | |||
|---|---|---|---|---|
| Total | ECEA workers | CCP workers | ||
| percent | ||||
| Class of worker | ||||
| Paid employee | 78.2 | 84.8 | 63.5 | 87.9 |
| Self-employed | 21.8 | 15.2 | 36.5 | 12.2 |
| Hours worked during the reference week | ||||
| Worked full-time hours (30 hours or more) | 73.3 | 74.2 | 71.3 | 78.5 |
| Worked part-time hours (less than 30 hours) | 26.7 | 25.8 | 28.7 | 21.5 |
| Employment income in 2015 | ||||
| Less than $20,000 | 47.8 | 38.2 | 69.2 | 28.6 |
| $20,000 to $39,999 | 39.3 | 44.9 | 26.7 | 22.2 |
| $40,000 or more | 13.0 | 16.9 | 4.2 | 49.2 |
| $40,000 to $59,999 | 10.9 | 14.4 | 3.1 | 18.9 |
| $60,000 or more | 2.1 | 2.6 | 1.0 | 30.3 |
| Member of low-income families (based on the market basket measure) | 12.2 | 7.8 | 22.0 | 7.9 |
|
Note: ELCC = early learning and child care; ECEA = early childhood educators assistants and CCP = child care providers. All results are weighted with census sample weights. Source: Statistics Canada, 2016 Census of Population. |
||||
Demand: More than half of all children aged 0 to 5 years participate in child care, although participation decreased during the COVID-19 pandemic
Start of text boxIn 2022, there were 1.2 million children aged 0 to 5 years in Canada. Will demand for ELCC increase with the implementation of the Canada-wide ELCC system?
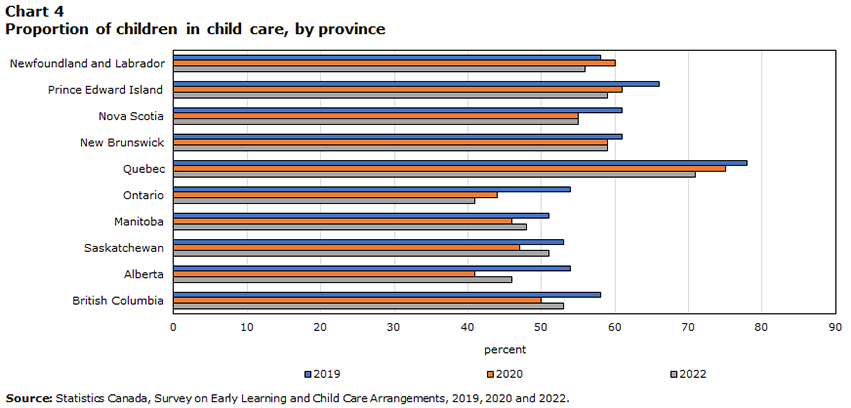
Data table for chart 4
| 2019 | 2020 | 2022 | |
|---|---|---|---|
| percent | |||
| Newfoundland and Labrador | 58 | 60 | 56 |
| Prince Edward Island | 66 | 61 | 59 |
| Nova Scotia | 61 | 55 | 55 |
| New Brunswick | 61 | 59 | 59 |
| Quebec | 78 | 75 | 71 |
| Ontario | 54 | 44 | 41 |
| Manitoba | 51 | 46 | 48 |
| Saskatchewan | 53 | 47 | 51 |
| Alberta | 54 | 41 | 46 |
| British Columbia | 58 | 50 | 53 |
| Source: Statistics Canada, Survey on Early Learning and Child Care Arrangements, 2019, 2020 and 2022. | |||
Demand: Daycare centres are the most common type of child care for children aged 0 to 5 years
- Almost one-quarter of children using child care are with a relative other than a parent, and one in five is in a family child care home.
- During the COVID-19 pandemic in 2020, children were more likely to be in care with a relative other than a parent and less likely to be in a before- or after-school program than in 2019.
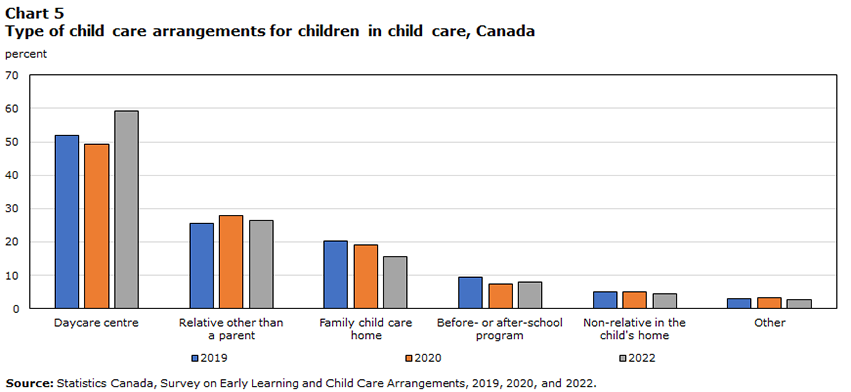
Data table for chart 5
| 2019 | 2020 | 2022 | |
|---|---|---|---|
| percent | |||
| Daycare centre | 51.9 | 49.2 | 59.2 |
| Relative other than a parent | 25.6 | 28.0 | 26.3 |
| Family child care home | 20.4 | 19.0 | 15.7 |
| Before- or after-school program | 9.3 | 7.4 | 7.9 |
| Non-relative in the child's home | 5.0 | 5.0 | 4.4 |
| Other | 3.1 | 3.3 | 2.6 |
| Source: Statistics Canada, Survey on Early Learning and Child Care Arrangements, 2019, 2020 and 2022. | |||
Demand: About 10% of children aged 0 to 5 years participated in child care during the evening and weekend in 2019, compared with 8% in 2020
- Child care use during the evening or weekend was more common among one-parent families and less common among families living in Quebec and the Eastern provinces.
- Parents who used evening or weekend care reported more difficulty finding care and reported more consequences because of this difficulty.
Will the implementation of the Canada-wide ELCC system address the need for ELCC during non-standard hours?
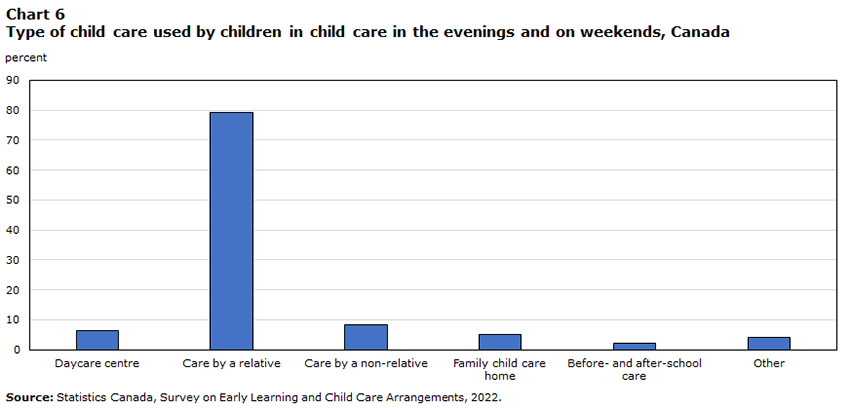
Data table for chart 6
| Percent | |
|---|---|
| Daycare centre | 6.5 |
| Care by a relative | 79.1 |
| Care by a non-relative | 8.3 |
| Family child care home | 5.1 |
| Before- and after-school care | 2.1 |
| Other | 4.0 |
| Source: Statistics Canada, Survey on Early Learning and Child Care Arrangements, 2022. | |
Demand: Parents reported paying more than $7,500 per year in child care expenses for their child aged 0 to 5 years
Start of text boxFederal funding is intended to achieve a 50% reduction in fees by the end of 2022 and an average of $10 per day by 2026.
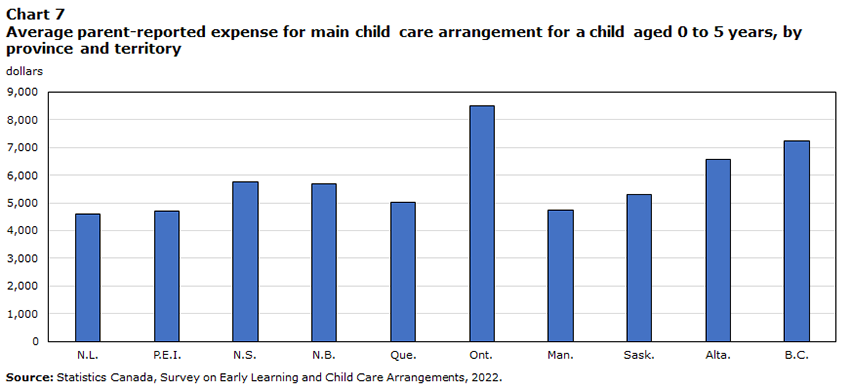
Data table for chart 7
| Dollars | |
|---|---|
| N.L. | 4,600 |
| P.E.I. | 4,690 |
| N.S. | 5,756 |
| N.B. | 5,684 |
| Que. | 5,009 |
| Ont. | 8,498 |
| Man. | 4,746 |
| Sask. | 5,293 |
| Alta. | 6,571 |
| B.C. | 7,244 |
| Source: Statistics Canada, Survey on Early Learning and Child Care Arrangements, 2022. | |
Summary of key findings

Supply of child care
- In 2022, there were more than 12,500 child care centres serving approximately 717,000 children aged 0 to 5 in Canada.
- The proportion of not-for-profit child care centres varies widely from province to province.
- The number of self-employed child care workers is declining.
- In 2016, the child care industry contributed $15.1 billion to Canadian GDP.
Demand for child care
- More than half of Canadian children aged 0 to 5 years participate in child care.
- Daycare centres are the most common type of child care for children aged 0 to 5 years (half of all children in child care), followed by one in four using child care with a relative other than a parent, and one in five in a family child care home.
- In early 2022, parents paid, more than $7,500 per year in child care expenses for their child aged 0 to 5 years.
Where do we go from here?

Knowledge gaps
- Most data were captured before the implementation of the Canada-wide ELCC system. There is a need to update and reflect on the current state of child care as the system evolves and expands.
- There are information gaps on child care used for specific subpopulations (e.g., children with disabilities and Indigenous children).
- Further exploration of the cost of child care is required.
- Data to understand regulated or licensed child care are lacking—it is difficult to disentangle types of care (only regulated care is part of the Canada-wide ELCC system).
- There is little information to address workforce issues such as recruitment and retention.
Next steps
- Continue to collect and analyze information on both supply and demand for high-quality child care:
- Canadian Survey on Early Learning and Child Care
- Survey on Before and After School Care in Canada
- Contribute to policy-relevant information.
- Date modified: