
Economic and Social Reports
Measuring the value of women’s contribution to the Canadian economy: New insights based on recent work
DOI: https://doi.org/10.25318/36280001202300200001-eng
Skip to text
Text begins
Correction notice
In the article “Measuring the value of women’s contribution to the Canadian economy: New insights based on recent work” published on February 22, 2023, two errors were found in the third sentence of the first paragraph.
The "participation rate" percentage has been adjusted from 85.0% to 85.1% and the "employment rate" percentage has been adjusted from 84.7% to 81.6%. This has been amended in both the HTML and PDF versions of this paper.
Women play a key role in the Canadian economy as workers, entrepreneurs and providers of unpaid household work. Women are important contributors to the labour market. In November 2022, the participation rate (85.1%) and the employment rate (81.6%) of core-aged women (aged 25 to 54) reached record highs.Note Women are also leaders and entrepreneurs. In 2018, over 5,000 of the 28,000 directors on the boards of corporations in Canada were women.Note They were also majority owners of 272,000 out of 1.3 million private enterprises and equal owners of another 208,000 in 2018.Note At the same time, women continue to perform the majority of household work. Over the 2015-to-2018 period, women accounted for 60.1% of the total hours of unpaid household work.Note
In this article, recent Statistics Canada research that focuses on improving estimates of women’s contribution to the economy—through paid and unpaid work—is summarized. The size of the economy has typically been measured by gross domestic product (GDP), and women’s and men’s contributions to GDP have been approximated by their shares in labour compensation (e.g., wages, salaries and supplementary labour income). However, this approach neglects the other important component of GDP, capital income, whose distribution between men and women may be different from that of labour income. Faryaar et al. (2022) examine the ownership structure of private enterprises using administrative microfiles to calculate the share of capital income of private enterprises (e.g., profits) by gender.Note They determine that in 2018, 49.2% of GDP could be attributable to men, 28.5% to women and 22.4% was unattributable. This unattributable portion represents, among other things, the profits of diversely held businesses (e.g., publicly traded corporations), foreign corporations and capital income in the public sector (e.g., public administration and the public portion of the health and education sectors).
However, GDP is limited because, by international convention, certain activities are not included in the national accounts. Among these activities is unpaid work in the household, such as cooking, cleaning, and caring for young and old dependants. These activities are predominately carried out by women. Besporstov and Sinclair (2022) estimate the monetary value of unpaid household work in 2018 to be approximately 25.5% to 37.3% of GDP, depending on the method used,Note and find that women account for between 56.7% and 57.9% of the value of unpaid work. The authors note that these shares are lower than women’s share of hours of unpaid household work (60.1%) because of the wage gap between men and women and because household tasks that are typically done by women (e.g., cleaning and caregiving) are also paid less in the market than tasks predominantly performed by men (e.g., repairs and maintenance).Note
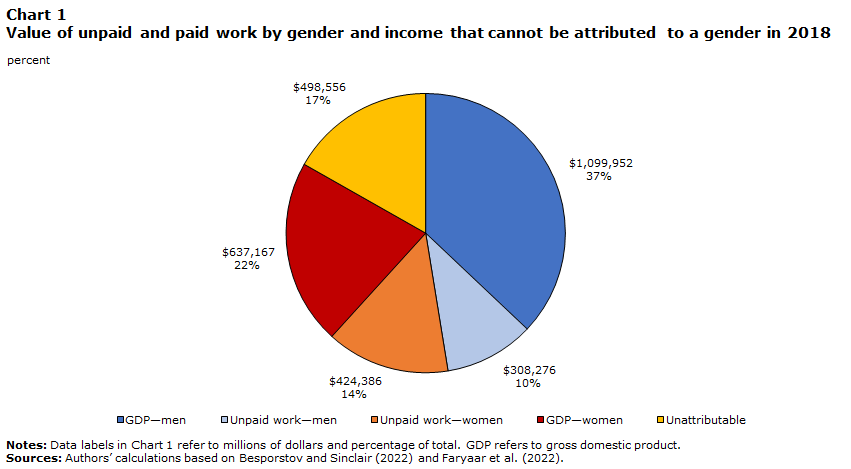
Chart 1 combines the estimates of Faryaar et al. (2022) and Besporstov and Sinclair (2022) to give estimates of women’s and men’s contribution to economic activity, including paid and unpaid work activity.Note Faryaar et al. (2022) reported that women contributed 28.5% to GDP in 2018. When the value of unpaid work is included, their contribution to economic activity rises to 35.8%. In contrast, men contributed 49.2% to GDP, but this falls to 47.5% when the value of unpaid work is included because they perform less unpaid work. The remaining 16.8% is capital income that cannot be assigned to a gender.
Data table for Chart 1
| Millions of dollars | Percent | |
|---|---|---|
| GDP—men | 1,099,952 | 37 |
| Unpaid work—men | 308,276 | 10 |
| Unpaid work—women | 424,386 | 14 |
| GDP—women | 637,167 | 22 |
| Unattributable | 498,556 | 17 |
|
Notes: Data labels in Chart 1 refer to millions of dollars and percentage of total. GDP refers to gross domestic product. Sources: Authors’ calculations based on Besporstov and Sinclair (2022) and Faryaar et al. (2022). |
||
Despite an increasing contribution of women to GDP (Faryaar et al. [2022] show that women’s contribution to GDP rose from 25.7% to 28.5% between 2008 and 2018), Chart 1 suggests that differences between men and women still exist. As suggested by Besporstov and Sinclair (2022), the wage gap between men and women plays a role. Also, if women forgo higher-earning opportunities to perform more of the household activities, continued efforts to lower barriers to women’s participation in paid work may help.
The cost of child care has been identified as a potential barrier to women’s full participation in the labour market, whether it be their entry into the labour market, their ability to work full time or their capacity to take on more senior roles. Gu (2022) found evidence that the introduction of the low-cost universal child care program in Quebec resulted in an increase in the labour force participation rate of women and in the use of paid child care in that province. The introduction of low-cost child care across Canada therefore bodes well, as it reduces or removes an important barrier to women’s employment.
Finally, Faryaar et al. (2022) show that when capital income is considered, the difference between the contribution of men and women to GDP widens. This is not surprising as there are currently more men- than women-owned businesses in Canada, and the women-owned businesses tend to be smaller and have lower productivity growth rates.Note There may be barriers unique to business ownership that women face, and understanding them is important, but they are likely intertwined with the ones facing women in the labour market. For example, Grekou and Watt (2021) find that the gap in productivity growth rates between women- and men-owned businesses appears to be driven by the fact that male entrepreneurs are more likely to have prior industry experience than their female counterparts.
Authors
Jeannine N. Bailliu and Danny Leung are with the Economic Analysis Division at Statistics Canada.
References
Besporstov, S., & Sinclair, A. (2022). Estimating the Economic Value of Unpaid Household Work in Canada, 2015 to 2019 (Latest Developments in the Canadian Economic Accounts). Statistics Canada. https://www150.statcan.gc.ca/n1/en/pub/13-605-x/2022001/article/00001-eng.pdf?st=yDTADb39
Faryaar, H., Macdonald, R., & Watt, J. (2022). Improving the Measurement of the Contribution of Women to the Economy: Estimates of Gross Domestic Product by Gender. Economic and Social Reports. 2(10). https://www150.statcan.gc.ca/n1/en/pub/36-28-0001/2022010/article/00003-eng.pdf?st=P386NEfl
Grekou, D., Li, J., & Liu, H. (2018). The Measurement of Business Ownership by Gender in the Canadian Employer-Employee Dynamics Database. (Analytical Studies: Methods and References, No. 17) Statistics Canada. The Measurement of Business Ownership by Gender in the Canadian Employer–Employee Dynamics Database (statcan.gc.ca)
Grekou, D., & Gueye, B. (2021). Who are the Men and Women Entering Business Ownership in Canada (Analytical Studies Branch Research Paper Series, No. 459). Statistics Canada. https://www150.statcan.gc.ca/n1/pub/11f0019m/11f0019m2021002-eng.pdf
Grekou, D., & Watt, J. (2021). Examining the Labour-productivity Gap Between Women-owned and Men-owned Enterprises: The Influence of Prior Industry Experience (Analytical Studies Branch Research Paper Series, No. 464). Statistics Canada. https://www150.statcan.gc.ca/n1/en/pub/11f0019m/11f0019m2021007-eng.pdf?=9wXiDto0
Gu, W. (2022). The Value of Unpaid Childcare and Paid Employment by Gender: What Are the Impacts of the Low-fee Universal Childcare Program. Economic and Social Reports. 2(7). https://www150.statcan.gc.ca/n1/en/pub/36-28-0001/2022007/article/00003-eng.pdf?st=INRqH1ip
Houle, P., & Turcotte, M., & Wendt, M. (2017). Changes in Parents’ Participation in Domestic Tasks and Care for Children from 1986 to 2015 (Spotlight on Canadians: Results from the General Social Survey). Statistics Canada. Changes in parents’ participation in domestic tasks and care to children from 1986 to 2015 (statcan.gc.ca)
Statistics Canada. (2021, March 23). Representation of women on boards of directors, 2018. The Daily. The Daily — Representation of women on boards of directors, 2018 (statcan.gc.ca)
Statistics Canada. (2022, November 24). Table 33-10-0631-01 Private enterprises by sex and Indigenous identity of ownership, province or region and enterprise size [Data table]. Private enterprises by sex and Indigenous identity of ownership, province or region and enterprise size (statcan.gc.ca)
Statistics Canada. (2022, December 2). Labour Force Survey, November 2022. The Daily. The Daily — Labour Force Survey, November 2022 (statcan.gc.ca)
- Date modified: