
COVID-19 in Canada: A Two-year Update on Social and Economic Impacts

Archived Content
Information identified as archived is provided for reference, research or recordkeeping purposes. It is not subject to the Government of Canada Web Standards and has not been altered or updated since it was archived. Please "contact us" to request a format other than those available.
Skip to text
Text begins
Statistics Canada has long had the privilege of serving Canadians by providing them with high-quality information on society and the economy. The pandemic has strengthened Statistics Canada’s commitment to sharing new, timely information that gives insights on how COVID-19 has impacted Canadian households and businesses.
COVID-19 continues to impact Canadians, with approximately 132,000 hospitalizations and over 35,000 deaths to date. Canadians continue to respond—over 30 million people are fully vaccinated. Despite these efforts, the spread of Omicron means Canadians continue to live with COVID-19, but perhaps in a different way, as restrictions begin to lift across the country. To mark the second year of the pandemic, Statistics Canada is reviewing the major social and economic impacts on the lives of Canadians and on Canadian businesses, and highlighting potential longer-term structural changes moving forward. This review builds on previous efforts to track impacts throughout the pandemic, including COVID-19 in Canada: A Year-end Update on Social and Economic Impacts, released in December 2021; COVID-19 in Canada: A One-year Update on Social and Economic Impacts, released to mark the first year of the pandemic; and The Social and Economic Impacts of COVID-19: A Six-month Update.
Statistics Canada is committed to continue tracking and reporting on the ongoing social and economic impacts of the pandemic through new and ongoing data development and analysis, illuminating the differential impacts on Canadians.
- Anil Arora, Chief Statistician of Canada
Description for Figure
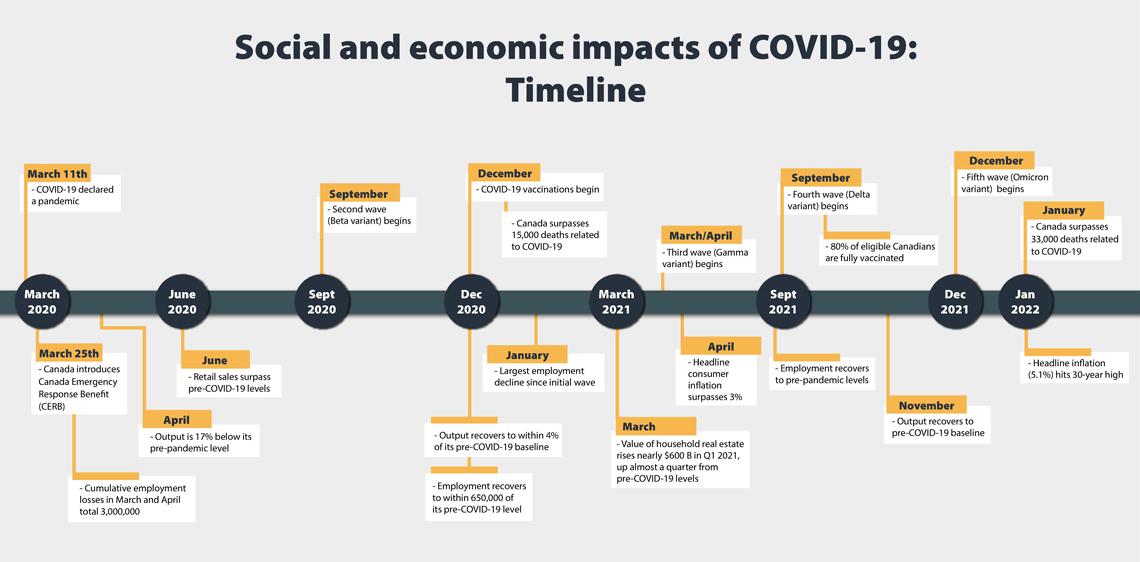
Social and economic impacts of COVID-19: Timeline
March 2020
- March 11th - COVID-19 declared a pandemic
- March 25th - Canada introduces Emergency Response Benefit (CERB)
- Cumulative employment losses in March and April total 3,000,000
April 2020
- Output is 17% below its pre-pandemic level
June 2020
- Retail sales surpass pre-COVID-19 levels
September 2020
- Second wave (Beta variant) begins
December 2020
- COVID-19 vaccinations begin
- Canada surpasses 15,000 deaths related to COVID-19
- Output recovers to within 4% of its pre-COVID-19 baseline
- Employment recovers to within 650,000 of its pre-COVID-19 level
January 2021
- Largest employment decline since initial wave
March 2021
- Value of household real estate rises nearly $600 B in Q1 2021, up almost a quarter from pre-COVID-19 levels
- March/April: Third wave (Gamma variant) begins
April 2021
- Headline consumer inflation surpasses 3%
September 2021
- Fourth wave (Delta variant) begins
- 80% of eligible Canadians are fully vaccinated
- Employment recovers to pre-pandemic levels
November 2021
- Output recovers to pre-COVID-19 baseline
December 2021
- Fifth wave (Omicron variant) begins
January 2022
- Canada surpasses 33,000 deaths related to COVID-19
- Headline inflation (5.1%) hits 30-year high
The pandemic has had significant indirect health impacts that will affect the future health of Canadians
- Mental health declines have not recovered to pre-pandemic levels. As of June 2021, 61% of Canadians reported very good or excellent mental health, compared with 67% in 2019. The decline is greater among women (-7.5 percentage points) compared with men (-4.0 percentage points).
- An estimated 26,248 excess deaths were reported in Canada from March 2020 to mid-October 2021—5.8% more deaths than would be expected with no pandemic.
- Early in the pandemic, excess deaths occurred mainly among seniors with COVID-19, but later there was an increase among younger Canadians as well, with many deaths caused by unintentional poisonings and overdoses.
- Health impacts will be felt for a long time. Modelling projections show that a six-month delay in colorectal cancer screening could increase cases by 2,800 and deaths by 1,300, between the years 2020 and 2050 (The Lancet, April 2021).

Data table
| Age | Excess deaths | COVID-19 deaths |
|---|---|---|
| percent | ||
| 85 and older | 22.6 | 47.9 |
| 65 to 84 | 40.6 | 42.2 |
| 45 to 64 | 21.6 | 8.8 |
| 0 to 44 | 15.1 | 1.1 |
| Source: Statistics Canada, special tabulations. | ||
The pandemic has impacted public safety and social cohesion
- While overall crime levels decreased during the pandemic, there was a 7% increase between 2020 and 2021 in selected crimes (i.e., assault, sexual assault, uttering threats, robbery, motor vehicle theft and shoplifting).
- There was a 37% increase in police-reported hate crimes—718 more in 2020 compared with 2019. This is the highest number since comparable data have been available, and it reflects crimes targeting Black, Asian and Indigenous populations.
- Social unrest has been linked to income inequality. In March and April 2020, 40% of Canadians were very or extremely concerned about the possibility of civil disorder. Concern was doubled among those expecting that the pandemic would impact their finances, compared with those anticipating no impact (61% vs. 32%).

Data table
| 2017 | 2018 | 2019 | 2020 | |
|---|---|---|---|---|
| number | ||||
| Total | 2073 | 1817 | 1951 | 2669 |
| Race or ethnicity | 878 | 793 | 884 | 1594 |
| Religion | 842 | 657 | 613 | 515 |
| Sexual orientation | 204 | 186 | 265 | 259 |
| Sex or gender | 32 | 54 | 56 | 46 |
| Other motivationNumber of police-reported hate crimes, by type of motivation, Canada, 2017 to 2020 Note 1 | 85 | 105 | 94 | 143 |
Source: Statistics Canada, Canadian Centre for Justice and Community Safety Statistics, Incident-Based Uniform Crime Reporting Survey. |
||||
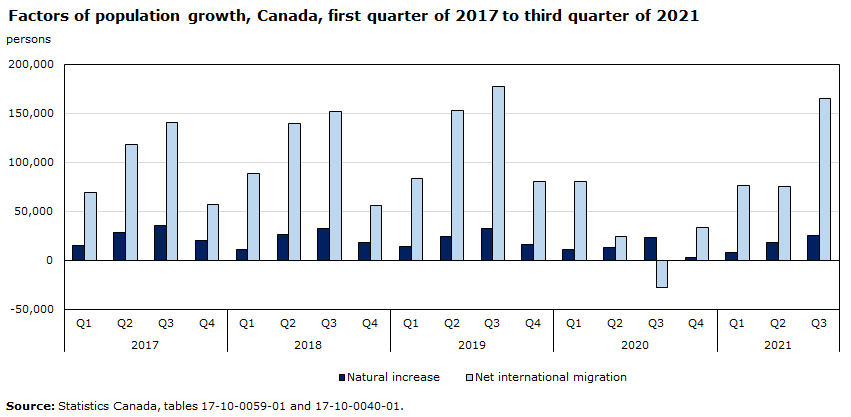
Canadian demographics were hit by the pandemic, but are recovering quickly
In 2020,
- population growth (+0.4%) fell to levels not seen since the First World War annual deaths surpassed 300,000 for the first time (+8%)
- life expectancy went down by 0.6 years—the largest single-year decline since 1921
- one in five Canadian adults said the pandemic made them delay having children or choose to have fewer
- the percentage of population growth from international migration was 68%, down from a record high of 85% in 2019
- the largest net loss of non-permanent residents (-88,901) was caused by declines in student- and work-permit holders
- more Canadians returned to live, rather than leaving the country—net emigration was negative (-13,997) for the first time since comparable records have been available.
Although the pandemic weakened the country’s population growth in 2020, data from the 2021 Census show that Canada’s population grew at almost twice the pace of other G7 countries from 2016 to 2021—1.8 million more than in 2016 (+5.2%). Most of the growth was caused by immigration before the pandemic. Since mid-2021, immigration numbers have been recovering to pre-pandemic levels.
Data table
| Natural increase | Net international migration | |
|---|---|---|
| persons | ||
| 2017 | ||
| Q1 | 14,756 | 69,158 |
| Q2 | 28,909 | 118,314 |
| Q3 | 35,318 | 140,669 |
| Q4 | 20,235 | 56,950 |
| 2018 | ||
| Q1 | 10,940 | 89,083 |
| Q2 | 26,497 | 140,156 |
| Q3 | 33,013 | 152,288 |
| Q4 | 18,449 | 56,401 |
| 2019 | ||
| Q1 | 13,699 | 84,012 |
| Q2 | 24,816 | 153,468 |
| Q3 | 32,901 | 177,268 |
| Q4 | 16,290 | 80,910 |
| 2020 | ||
| Q1 | 11,406 | 80,051 |
| Q2 | 12,819 | 24,329 |
| Q3 | 23,651 | -27,841 |
| Q4 | 2,715 | 33,143 |
| 2021 | ||
| Q1 | 8,222 | 76,117 |
| Q2 | 17,813 | 75,084 |
| Q3 | 24,893 | 165,446 |
| Source: Statistics Canada, tables 17-10-0059-01 and 17-10-0040-01. | ||
More stress on pocketbooks as supply disruptions and strong demand continue to fuel consumer inflation
- Headline consumer inflation (+5.1%) was at a 30-year high in January 2022.
- Prices for food and shelter rose steadily over 2021. In January, annual price increases for both food (+5.7%) and shelter (+6.2%) were above the headline rate. Grocery prices rose at their fastest yearly pace (+6.5%) since May 2009.
- Excluding gasoline, consumer price growth was 4.3% in January, the largest yearly increase since this index became available in 1999.
- Consumer inflation has outpaced average wage growth since the spring of 2021.
- The annual increase in average hourly wages, adjusted for changes in composition of employment during the pandemic, was 2.7% in January. Unadjusted for these changes, average hourly wages rose 2.4%.

Data table
| Average hourly wages (fixed-weight measure) | Consumer Price Index | |
|---|---|---|
| Index (January 2018=100) | ||
| 2018 | ||
| January | 100.0 | 100.0 |
| February | 100.3 | 100.6 |
| March | 100.5 | 100.9 |
| April | 100.8 | 101.2 |
| May | 101.1 | 101.3 |
| June | 101.1 | 101.4 |
| July | 101.3 | 102.0 |
| August | 101.2 | 101.9 |
| September | 101.5 | 101.5 |
| October | 101.5 | 101.8 |
| November | 101.5 | 101.4 |
| December | 101.8 | 101.3 |
| 2019 | ||
| January | 102.2 | 101.4 |
| February | 103.0 | 102.1 |
| March | 103.2 | 102.8 |
| April | 103.7 | 103.3 |
| May | 103.9 | 103.7 |
| June | 104.4 | 103.5 |
| July | 104.7 | 104.0 |
| August | 104.3 | 103.9 |
| September | 105.3 | 103.4 |
| October | 105.3 | 103.7 |
| November | 105.5 | 103.6 |
| December | 105.3 | 103.6 |
| 2020 | ||
| January | 106.1 | 103.9 |
| February | 106.6 | 104.3 |
| March | 107.1 | 103.7 |
| April | 109.2 | 103.0 |
| May | 109.0 | 103.3 |
| June | 108.2 | 104.2 |
| July | 108.0 | 104.2 |
| August | 107.8 | 104.0 |
| September | 108.0 | 103.9 |
| October | 108.3 | 104.4 |
| November | 108.0 | 104.6 |
| December | 108.4 | 104.3 |
| 2021 | ||
| January | 109.2 | 104.9 |
| February | 109.3 | 105.5 |
| March | 109.2 | 106.0 |
| April | 109.8 | 106.5 |
| May | 109.9 | 107.1 |
| June | 109.6 | 107.4 |
| July | 109.6 | 108.0 |
| August | 109.7 | 108.3 |
| September | 110.2 | 108.5 |
| October | 110.7 | 109.3 |
| November | 111.0 | 109.5 |
| December | 111.2 | 109.3 |
| 2022 | ||
| January | 112.2 | 110.3 |
|
Notes: Average hourly wages (Labour Force Survey fixed-weight), one-year percent change: January 2021 to January 2022: 2.7%. Consumer Price Index, one-year percent change: January 2021 to January 2022: 5.1%. Sources: Statistics Canada, Labour Force Survey, special tabulations, and table 18-10-0004-01. |
||
The costs of middle-class membership rise as home prices continue to surge across the country
- Homebuilders in a majority of census metropolitan areas reported double-digit increases in new home prices during 2021. Annual increases exceeded 20% in Windsor, Winnipeg, Ottawa and London, and 30% in Kitchener–Cambridge–Waterloo.
- The Canadian Real Estate Association’s Multiple Listing Service Home Price Index was up 26.6% on a year-over-year basis in December 2021. Home prices in the Greater Toronto Area were up over 30%.
- Analysis at the Bank of Canada indicates that the share of home purchases accounted for by first-time buyers has continued to edge down during the pandemic, while the shares for repeat buyers and investors have risen.
- According to RBC Economics, housing affordability in the third quarter of 2021 was at a 31-year low. CIBC Economics has reported that about 30% of first-time buyers have received down payment gifts.
- Financial barriers to homeownership may have lasting impacts on social and economic mobility. On a per-household basis, homeowners have seen their wealth rise by over $260,000 during the pandemic, while renters have seen gains of $50,000.

Data table
| Fourth quarter of 2019 | Third quarter of 2021 | |
|---|---|---|
| dollars | ||
| Renters | 218,200 | 267,708 |
| Owners with mortgage | 744,271 | 945,380 |
| All households | 787,907 | 981,932 |
| Owners without mortgage | 1,474,027 | 1,810,574 |
| Source: Statistics Canada, table 36-10-0660-01. | ||
Labour market conditions improved for diverse Canadians in the second half of 2021
- Lockdown measures earlier in the pandemic disproportionately impacted diverse Canadians—including newcomers and many Canadians in racialized communities—who are more likely to work in high-contact settings. Job recovery strengthened for many diverse groups in the second half of 2021.
- Employment rates among many groups designated as visible minorities, including Southeast Asian, Black and Filipino Canadians, rose notably during 2021.
- The share of very recent immigrants of core working age who were working was almost 8 percentage points higher in December 2021 than in December 2019.
- Employment among Indigenous people in Canada in December was up 10% year over year.
- The impact of Omicron in January 2022 was widely felt. The decline in the employment rate for core-aged members of groups designated as visible minorities (-1.6 percentage points to 79.8%) was similar to the decline observed for Canadians who do not identify as a visible minority and are not Indigenous (-1.5 percentage points to 84.6%).
- There were impacts on job quality, too: in January 2022, members of groups designated as visible minorities (8.5%) were more likely than those who did not identify as a visible minority (6.7%) to report that they were planning to leave their job in the next 12 months, and to cite low pay as their main reason for doing so.
- In the fourth quarter of 2021, nearly half of businesses owned by members of groups designated as visible minorities (48.4%) stated that the absence of government support programs would have a medium-to-high impact on the survival of their business, compared with one-third of all Canadian businesses.

Data table
| Population group | Unemployment rate |
|---|---|
| percent | |
| Not Indigenous or a visible minority | 6.2 |
| Total, visible minority | 8.0 |
| Black | 11.7 |
| Arab | 9.6 |
| Chinese | 7.3 |
| South Asian | 7.0 |
| Filipino | 6.1 |
| Source: Statistics Canada, special tabulations. | |
Labour market imbalances will persist as employers and workers continue to adjust
- Demand for workers accelerated to record levels during the second half of 2021. Job vacancies in the third quarter rose over 60% compared with pre-pandemic levels, reflecting increases in all provinces and most industrial sectors.
- No “Great Resignation” in Canada: In late 2021, the number of job-leavers and job-changers remained comparable to pre-pandemic levels, as did the share of unemployed workers who returned to work in the same industry as their last job (about 50%). In January 2022, fewer than 1 in 10 workers were planning to leave their job over the next 12 months.
- Businesses are adjusting their hiring strategies—employers appear to be lowering educational requirements to attract workers. In late 2021, about 10% of workers who had a high school diploma or less had recently started jobs that typically require university education, up from 4.0% in late 2019.
- Businesses are adjusting their wage plans. In the two years leading up to November 2021, wages among new hires rose by 10%, compared with 6.4% for established employees. In the fourth quarter of 2021, almost half of businesses reported that they planned to raise wages for existing employees over the coming year, while one-quarter planned to increase wages offered to new employees.

Data table
| Third quarter of 2019 | Third quarter of 2021 | Job vacancies | Percent growth from third quarter of 2019 to third quarter of 2021 | |
|---|---|---|---|---|
| percent | ||||
| All industries | 3.3 | 5.4 | 912,600 | 62 |
| Accommodation and food services | 5.2 | 12.9 | 163,000 | 113 |
| Health care and social assistance | 3.1 | 5.2 | 118,200 | 79 |
| Retail trade | 3.4 | 5.0 | 104,100 | 45 |
| Manufacturing | 3.0 | 5.0 | 81,200 | 62 |
| Construction | 3.6 | 6.3 | 75,300 | 84 |
|
Note: The numbers in bold are the number of reported job vacancies in Q3 2021 and the percentage increase since Q3 2019. Source: Statistic Canada, table 14-10-0326-01. |
||||
Longer-lasting impacts of the pandemic on work are likely to exacerbate existing inequalities
- About 40% of Canadians hold permanent, pandemic-resilient jobs that are less likely to be impacted by automation (triple-protected jobs). Higher-paid, more educated workers are far more likely to hold these jobs.
- Couples in the top 10% of the earnings distribution were about 20 times more likely to have triple-protected jobs than couples in the bottom 10%.
- Couples with postsecondary degrees were seven times more likely to hold triple-protected jobs than couples without postsecondary credentials.
- Challenges to job and income stability continue to persist in lower-paying, high-contact sectors.
- While total employment rebounded to pre-COVID-19 levels in September 2021, employment in accommodation and food services remained 211,000 below pre-pandemic levels, as of December that year. This was before additional losses of 113,000 in January 2022, when tighter restrictions related to Omicron were in effect.
- Conversely, employment in professional, technical and scientific services—a sector with some of the highest levels of job flexibility and telework capacity—has risen by 179,000 since the start of the pandemic.

Data table
| Wage decile | Job is triple protected |
|---|---|
| percent | |
| 1st | 9.2 |
| 2nd | 12.5 |
| 3rd | 20.3 |
| 4th | 26.4 |
| 5th | 32.1 |
| 6th | 42.2 |
| 7th | 50.3 |
| 8th | 64.3 |
| 9th | 73.9 |
| 10th | 87.2 |
| Source: Frenette, M. and R. Morissette. 2021. "Job security in the age of artificial intelligence and potential pandemics." Economic and Social Reports. Statistics Canada Catalogue no. 36-28-0001. | |
Financial uncertainties deepen for many businesses as emergency support programs wind down
- Emergency programs have been a critical lifeline for many businesses during the pandemic. Business insolvencies have remained below pre-COVID-19 levels, but rose 37% in the fourth quarter of 2021.
- During the fourth quarter of 2021, one-third of businesses reported that the absence of government support programs over the next 12 months would have a medium-to-high impact on their survival. This includes almost two-thirds of those in accommodation and food services, and 40% of businesses with 5 to 19 employees.
- About 15% of all businesses reported that it would be a major challenge to pay off funding received from repayable government support programs over the next 12 months, including almost 40% of those in accommodation and food services.
- Financial stresses may become more acute as cost pressures continue to rise. In the fourth quarter, 43% of businesses expected rising input costs to be an obstacle in the coming months, including 71% of manufacturers and two-thirds of businesses in accommodation and food services.

Data table
| Industry | Fourth quarter of 2021 |
|---|---|
| percent | |
| All industries | 33.3 |
| Accommodation and food services | 63.7 |
| Arts, entertainment and recreation | 59.0 |
| Manufacturing | 38.3 |
| Retail trade | 33.4 |
| Information and cultural industries | 33.1 |
| Transportation and warehousing | 33.0 |
| Health care and social assistance | 32.7 |
| Administrative and support, waste management and remediation services |
32.4 |
| Construction | 29.0 |
| Mining, quarrying, and oil and gas extraction | 23.9 |
| Real estate and rental and leasing | 23.6 |
| Professional, scientific and technical services | 23.3 |
| Finance and insurance | 11.6 |
| Source: Statistics Canada, table 33-10-0417-01. | |
Impacts of the pandemic on Canadian competitiveness remain an open question
- Business productivity has fallen back to pre-pandemic levels: The sharp increase in productivity early in the pandemic in part reflected the shift in hours worked from less to more productive industries when many non-essential businesses were shuttered. Business productivity has declined since mid-2020 as non-essential businesses ramped up their activities.
- Overall business productivity in the fourth quarter of 2021 was 1.2% below levels observed in late 2019.
- Growing pressures on cost competitiveness: Unit labour costs in the business sector, which measure the payments to labour required to produce a unit of output, were up 6.0%, year-over-year, in the fourth quarter of 2021, and have trended higher over the course of the pandemic.
- Non-residential business investment has been slow to recover: Important drivers of productivity and wage growth, non-residential outlays on structures and machinery and equipment were still 6.2% below pre-pandemic levels in late 2021, and down nearly one quarter from levels observed before the oil price shock in the mid-2010s.
- Business spending on research and development scaled back during the second half of 2021 and was 11% below pre-pandemic levels late in the year.
- Investments in digital technologies and the longer-term impacts of working from home may be important factors affecting business competitiveness.

Data table
| Real gross domestic product | Hours worked | Labour productivity | |
|---|---|---|---|
| quarterly percent change | |||
| 2019 | |||
| Q4 | 0.3 | -0.1 | 0.4 |
| 2020 | |||
| Q1 | -2.7 | -6.2 | 3.7 |
| Q2 | -13.5 | -23.2 | 12.6 |
| Q3 | 10.9 | 22.7 | -9.6 |
| Q4 | 2.5 | 4.2 | -1.6 |
| 2021 | |||
| Q1 | 1.3 | 3.8 | -2.5 |
| Q2 | -1.4 | -0.7 | -0.7 |
| Q3 | 1.4 | 2.7 | -1.2 |
| Q4 | 2.0 | 2.6 | -0.5 |
| Source: Statistics Canada, table 36-10-0206-01. | |||
Looking forward
- The unintended health impacts of COVID-19 restrictions, along with the impacts of post COVID-19 condition, will be felt for years and will continue to strain health care resources.
- Recent protests against pandemic restrictions are indicative of growing divisions among Canadians, and the potential long-term impacts on social cohesion are difficult to predict.
- Canada’s population grew at almost twice the pace of other G7 countries from 2016 to 2021, primarily from immigration prior to the pandemic. Lower immigration during COVID-19, coupled with structural pressures related to population aging, will continue to impact labour market imbalances.
- To what extent will the accelerated shift towards automation and digital technologies in low-wage sectors create new employment opportunities?
- High inflation and modest wage gains suggest that pressures related to affordability will worsen in the near term—especially if prices for food and shelter continue to rise.
- Financial barriers to homeownership may have lasting impacts on social and economic mobility, especially for new Canadians and younger families.
- As targeted wage subsidies and lockdown supports wind down, businesses in high-contact sectors face continued uncertainty as input costs rise and vacancies remain near record levels.
- Will digitalization and working from home lead to permanent increases in businesses productivity?
- Date modified: