
COVID-19 in Canada: Year-end Update on Social and Economic Impacts
Skip to text
Text begins
Statistics Canada has long had the privilege of serving Canadians by providing them with high-quality information that helps shape their view of our society and economy. The pandemic has strengthened our commitment to provide new, timely information that provides insights on how COVID-19 has impacted Canadian households and businesses.
This presentation provides an update of selected highlights from COVID-19 in Canada: A One-year Update on Social and Economic Impacts released on March 11, 2021 to mark the first year of the pandemic. This review reflects work that the Agency has undertaken, and continues to undertake, using existing and new data sources to provide critical insights into the social and economic impacts of COVID-19 on Canadians. The year-in-review compendium updates and extends our analysis of the pandemic’s early impacts, building on The Social and Economic Impacts of COVID-19: A Six-month Update and reflecting the many analytical releases in COVID-19: A data perspective.
While continuing to document the current impacts of the pandemic remains important, we are turning our attention to trends and measures that may be pointing to potential longer-term changes in the economic and social lives of Canadians.
-Anil Arora, Chief Statistician of Canada
Summary of contents
- Vaccination and unintended health impacts of COVID-19
- More Canadians get vaccinated as provinces introduce passports, but vaccination rates are uneven across the country.
- Stress levels remain high as the pandemic continues to challenge Canadians’ mental health.
- The pandemic has resulted in more deaths than would be expected, but they are not all from COVID-19—poisonings and opioid overdoses are contributing to excess mortality.
- Demographic Impacts
- Increased deaths, decreased immigration and delayed family planning due to the pandemic will change the demographic make up of Canada.
- These demographic changes will impact employment and interprovincial migration.
- Assessing the economic recovery
- Economic activity remains below pre-pandemic levels and the recovery is uneven across industries.
- Employment rebounded to pre-COVID levels but high job vacancies reveal a mismatch between labour supply and demand.
- Rising prices put pressure on businesses and consumers as input costs increase and consumer inflation accelerates at the fastest pace since 2003, outpacing wage growth.
Vaccination and unintended health impacts of COVID-19
Vaccination efforts continue across the country as jurisdictions opt for vaccine passports
- Vaccination rates have risen recently as provinces issued vaccination passport requirements for non-essential services.
- As of December 4th, 89.6% of Canadians aged 12 and older had received at least one dose and 86.7% were fully vaccinated.
- At 85%, Newfoundland and Labrador has the highest proportion of its total population fully vaccinated. Saskatchewan, Alberta, Northwest Territories and Nunavut had rates at or below 70%.
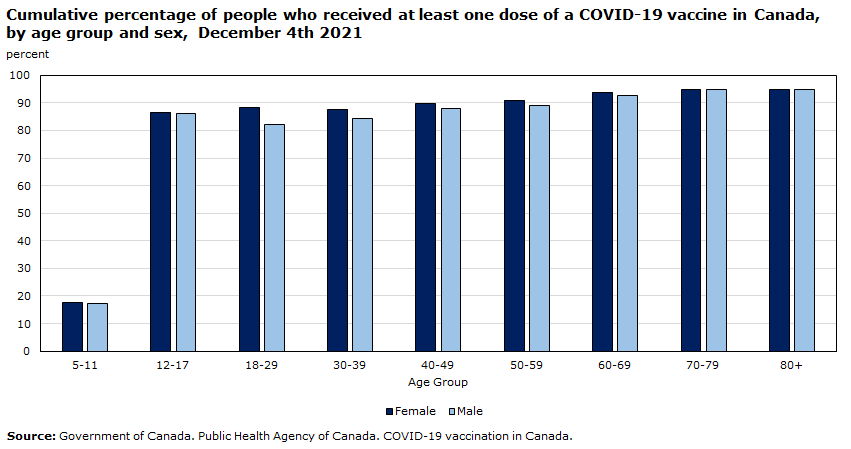
Data table
| Age group | Female | Male |
|---|---|---|
| percent | ||
| 5-11 | 17.6 | 17.4 |
| 12-17 | 86.5 | 86.3 |
| 18-29 | 88.3 | 82.2 |
| 30-39 | 87.7 | 84.5 |
| 40-49 | 89.7 | 87.9 |
| 50-59 | 91.0 | 89.0 |
| 60-69 | 93.6 | 92.7 |
| 70-79 | ≥95.0 | ≥95.0 |
| 80+ | ≥95.0 | ≥95.0 |
| Source: Government of Canada. Public Health Agency of Canada. COVID-19 vaccination in Canada. | ||
Excess mortality among those under 65 years of age due in part to unintentional poisonings and overdoses
- The pandemic has resulted in excess deaths in Canada – that is, more deaths occurring than what would be expected if there was no pandemic.
- Overall, from March 2020 to May 2021, there were an estimated 19,884 excess deaths in Canada, or over 5% more deaths than what would be expected were there no pandemic.
- Early on in the pandemic, excess deaths were largely occurring among seniors and were mostly attributable to COVID-19. Later on, excess deaths rose among younger Canadians.
- Between March 2020 and May 2021, approximately 35% of excess deaths occurred among those less than 65 years of age compared with approximately 7% of COVID-19 related deaths. Excess deaths were partially due to unintentional poisonings and overdoses.
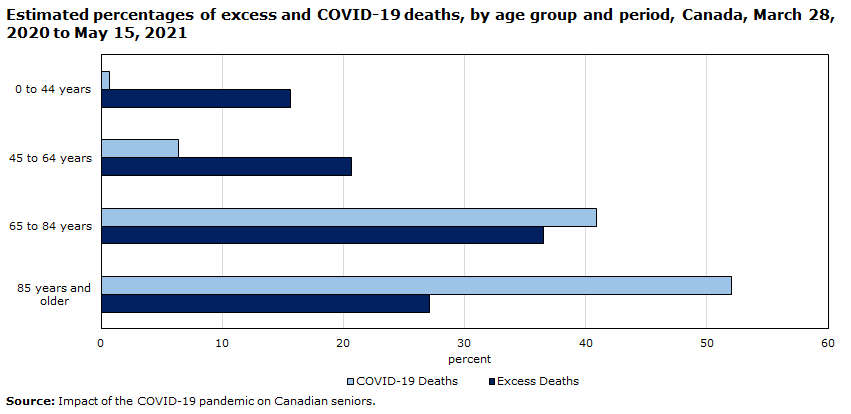
Data table
| Excess Deaths | COVID-19 Deaths | |
|---|---|---|
| percent | ||
| 0 to 44 years | 15.6 | 0.7 |
| 45 to 64 years | 20.7 | 6.4 |
| 65 to 84 years | 36.5 | 40.9 |
| 85 years and older | 27.1 | 52.0 |
| Source: Impact of the COVID-19 pandemic on Canadian seniors. | ||
Increases in opioid overdoses during the pandemic are occurring mostly among young Canadians and those living in British Columbia, Alberta or Ontario
- According to the Public Health Agency of Canada, 6,946 apparent opioid toxicity deaths occurred between April 2020 and March 2021 — representing an 88% increase from the same time period prior to the pandemic (April 2019 to March 2020 – 3,691 deaths).
- Between January and March 2021, 1,772 apparent opioid toxicity deaths occurred — approximately 20 deaths per day — representing a 65% increase compared to January to March 2020 (1,073 deaths).
- 90% of all opioid toxicity deaths occurred in British Columbia, Alberta or Ontario.
- The majority of deaths were among individuals aged 20 to 49 years.
- 75% of accidental apparent opioid toxicity deaths occurred among males.
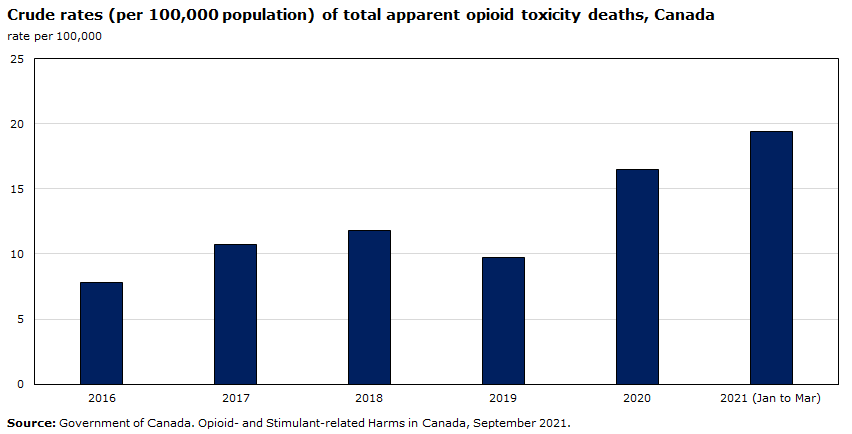
Data table
| Year | Rate per 100,000 |
|---|---|
| 2016 | 7.8 |
| 2017 | 10.7 |
| 2018 | 11.8 |
| 2019 | 9.7 |
| 2020 | 16.5 |
| 2021 (Jan to Mar) | 19.4 |
| Source: Government of Canada. Opioid- and Stimulant-related Harms in Canada, September 2021. | |
Generally, those experiencing opioid overdoses represent diverse groups – many disadvantaged and impacted by the pandemic
- A national study of individuals experiencing opioid poisoning-related hospitalizations revealed higher rates among those…
- with lower levels of income and education
- who were unemployed or out of the labour force
- who self-identify as Indigenous
- who live in lone parent households
- who spend more than 50% of their income on housing (Carriere et al, 2018).
- Studies that examined the socio-economic conditions facing individuals who experienced an opioid overdose in British Columbia and parts of Ontario prior to the pandemic revealed…
- higher rates of unemployment
- among those who were employed, many were in construction and services
- approximately half received social assistance
- between 30% and 40% had at least one police contact in the two years prior.
Socio-economic characteristics of individuals experiencing an opioid overdose in Simcoe Muskoka prior to the pandemic
Of the individuals who experienced an overdose, half received social assistance (52%).
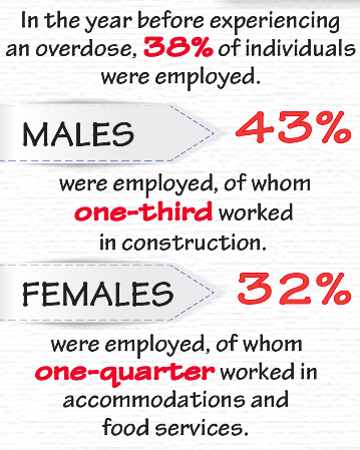
Figure description
In the year before experiencing an overdose, 38% of individuals were employed.
Males: 43% were employed, of whom one-third worked in construction.
Females: 32% were employed, of whom one-quarter worked in accommodations and food services.
Sources: Statistics Canada. Carriere G et al. Social and economic characteristics of those experiencing hospitalizations due to opioid poisonings, October 2018; Carriere G et al. Understanding the socioeconomic profile of people who experienced opioid overdoses in British Columbia, 2014 to 2016, February 2021; Statistics Canada. Understanding opioid overdoses in Simcoe Muskoka, Ontario. October 2021
The pandemic also continues to cause high levels of stress among some Canadians
- In the spring of 2021, one-quarter of Canadians reported experiencing high levels of stress most days.
- Nearly 50% of Canadians considered that their stress levels were somewhat or much worse than prior to the pandemic. Rates were higher among…
- women
- those age 35 to 44
- LGBTQ+ and
- those living with children less than 15 years of age.
- Many of these groups experience more challenges related to mental health in general.
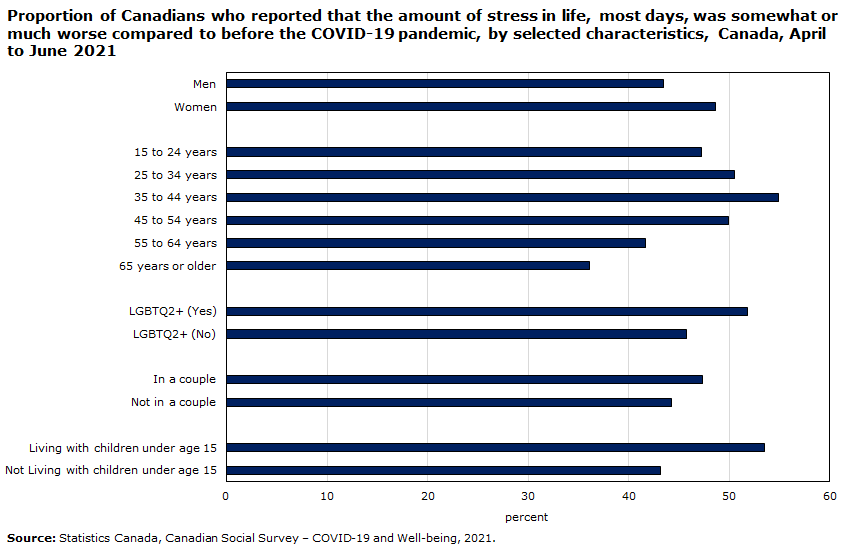
Data table
| Somewhat or much worse now | |
|---|---|
| percent | |
| Men | 43.5 |
| Women | 48.6 |
| 15 to 24 years | 47.2 |
| 25 to 34 years | 50.5 |
| 35 to 44 years | 54.9 |
| 45 to 54 years | 49.9 |
| 55 to 64 years | 41.7 |
| 65 years or older | 36.1 |
| LGBTQ2+ (Yes) | 51.8 |
| LGBTQ2+ (No) | 45.7 |
| In a couple | 47.3 |
| Not in a couple | 44.3 |
| Living with children under age 15 | 53.5 |
| Not Living with children under age 15 | 43.2 |
| Source: Statistics Canada. Canadian Social Survey – COVID-19 and Well-being, 2021. | |
Despite the impacts of the pandemic, many Canadians are optimistic for the future
- Between March and April 2021, 42% of Canadians aged 15 and older reported that they think their life will improve in the next year
- Rates were highest among…
- those 15 to 24 years of age (64%)
- males (45%) compared with females (38%)
- visible minority groups (49%) compared with non-visible minority groups (39%)
- Almost half (48%) think their life will remain the same — highest rate among those 65 years of age (61%)
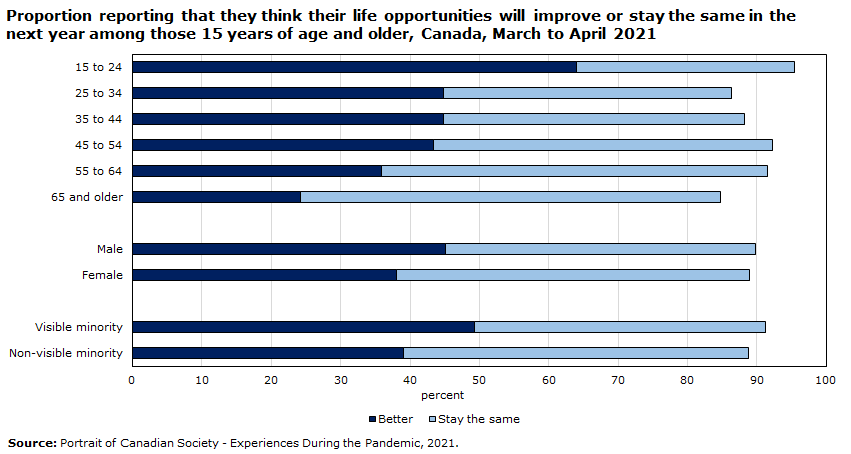
Data table
| Better | Stay the same | |
|---|---|---|
| percent | ||
| 15 to 24 | 64.1 | 31.4 |
| 25 to 34 | 44.8 | 41.5 |
| 35 to 44 | 44.8 | 43.5 |
| 45 to 54 | 43.4 | 48.8 |
| 55 to 64 | 35.8 | 55.7 |
| 65 and older | 24.2 | 60.5 |
| Male | 45.1 | 44.7 |
| Female | 38.0 | 50.9 |
| Visible minority | 49.3 | 41.9 |
| Non-visible minority | 39.0 | 49.8 |
| Source: Portrait of Canadian Society - Experiences During the Pandemic, 2021. | ||
Social cohesion during the pandemic: Selected crime and calls for police service are up in the second quarter of 2021 compared with 2020
- Selected crime was up 7% in the second quarter of 2021 compared with the same period a year earlier. Both violent and non-violent crimes contributed to the increase. Crime levels throughout the pandemic remain lower than pre-pandemic levels from 2019.
- Selected calls for service were 3% higher in the second quarter of 2021 compared with 2020, particularly responding to overdoses (+25%), general wellness checks (+17%), and mental health-related calls such as a person in emotional crisis or an attempted suicide (+8%). Since the start of the pandemic period, monthly counts of calls for police service have been higher in comparison to pre-pandemic levels reported in 2019.

Data table
| Total selected criminal incidents | Total selected calls for service | |
|---|---|---|
| number | ||
| 2020 | ||
| January | 72,489 | 22,664 |
| February | 68,322 | 21,353 |
| March | 65,720 | 23,426 |
| April | 54,245 | 23,051 |
| May | 56,493 | 25,633 |
| June | 63,343 | 26,320 |
| July | 70,452 | 27,288 |
| August | 67,438 | 26,883 |
| September | 64,515 | 24,568 |
| October | 63,447 | 24,753 |
| November | 58,574 | 23,418 |
| December | 54,873 | 23,892 |
| 2021 | ||
| January | 58,243 | 24,795 |
| February | 50,596 | 21,920 |
| March | 55,095 | 25,414 |
| April | 58,237 | 24,405 |
| May | 64,516 | 26,706 |
| June | 63,885 | 26,471 |
|
Notes: Information presented in this chart represents data reported by a sample of 19 police services across Canada. Calls for service information was reported by 14 of these police services, as at the time of this release, the Montréal Police Serivce, Sûreté du Québec, Royal Canadian Mounted Police, Edmonton Police Service and the Winnipeg Police Service were unable to provide calls for service data. Due to incomplete coverage, only data up to and including June 2021 were available. Data for this project continue to be collected on a monthly basis and released regularly. Source: Statistics Canada, Special police-reported crime statistics - Special COVID-19 report to Statistics Canada. |
||
April 2020 is the first full pandemic month. The first box represents Q2 2020 ranging from April 2020 – June 2020. The second box represents Q2 2021 ranging from April 2021 – June 2021.
Looking forward…
- Canadians will continue to have to contend with COVID-19 with the introduction of the new omicron variant with increased transmissibility which may lead to new restrictions as case counts increase.
- Continued efforts are required to increase vaccination rates and the uptake of booster shots.
- Pressures on healthcare systems and healthcare workers due to COVID-19 will likely continue resulting in reduced capacity and access to other healthcare services including cancer care. Modelling results are predicting increases in cancer rates and mortality for colorectal and breast cancer.
- While the direct impacts of COVID-19 remain front and centre, strategies are also required to support those facing indirect impacts including mental health and substance use and abuse.
Impact on Demographic trends
Demographic changes due the pandemic will have implications for Canada’s society and economy
- Canada, like other developed countries, is experiencing demographic changes due to the pandemic.
- Population growth in 2020 fell to levels not seen in 75 years.
- Annual population growth in 2020 was 0.4% (+149,461):
- Lowest growth since 1945 (in number) and 1916 (in percent)
- Only one-quarter of the growth that occurred in 2019 (+575,038).
- Deaths in 2020 surpassed 300,000 (309,893) for the first time in Canadian history, up 7% from 2019:
- Natural increase (births minus deaths) fell to its lowest level since at least 1922.
- The Public Health Agency of Canada reported 15,651 COVID-19 related deaths.
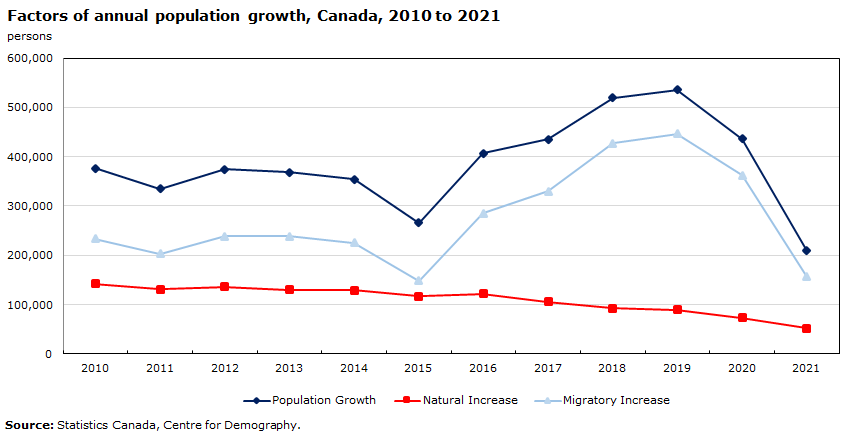
Data table
| Population Growth | Natural Increase | Migratory Increase | |
|---|---|---|---|
| persons | |||
| 2010 | 375,994 | 142,235 | 233,759 |
| 2011 | 334,439 | 131,456 | 202,983 |
| 2012 | 374,894 | 136,430 | 238,464 |
| 2013 | 368,732 | 129,951 | 238,781 |
| 2014 | 354,481 | 129,229 | 225,252 |
| 2015 | 265,473 | 117,154 | 148,319 |
| 2016 | 406,579 | 121,492 | 285,087 |
| 2017 | 435,749 | 105,643 | 330,106 |
| 2018 | 519,848 | 92,990 | 426,858 |
| 2019 | 536,146 | 89,977 | 446,169 |
| 2020 | 435,974 | 73,416 | 362,558 |
| 2021 | 208,904 | 52,401 | 156,503 |
|
Source: Statistics Canada, Centre for Demography. |
|||
Low levels of immigration during the pandemic will have implications for employment
- The contribution of international migration to population growth fell to 58% in 2020.
- It had accounted for three quarters of growth since 2016.
- The pandemic’s largest impact on population growth in 2020 reflected lower international migration, specifically, net non-permanent residents.
- In 2020, immigration was at just over half (184,624) of of Immigration, Refugees and Citizenship Canada’s pre-pandemic target of 341,000.
- Canada experienced the largest net loss of non-permanent residents (NPR) since at least 1972 (-86,535), due mostly to declines in student and work permit holders.
- Canada also saw the lowest level of net emigration (11,462) since comparable records have been available.
- Immigration numbers in 2021 are recovering to pre-pandemic levels.

Data table
| Immigrants | Net non-permanent residents | |
|---|---|---|
| 2019 | ||
| Q1 | 65,957 | 30,488 |
| Q2 | 94,281 | 65,112 |
| Q3 | 103,719 | 79,995 |
| Q4 | 77,235 | 15,052 |
| 2020 | ||
| Q1 | 69,133 | 6,187 |
| Q2 | 34,070 | -24,885 |
| Q3 | 40,116 | -66,762 |
| Q4 | 41,267 | -3,441 |
| 2021 | ||
| Q1 | 70,467 | 14,760 |
| Q2 | 74,353 | 12,559 |
|
Source: Demographic Estimates Program, Centre for Demography. |
||
The pandemic has affected Canadians' intentions to have children which will have longer lasting fertility impacts
- Nearly 20% of Canadians aged 25 to 44 want to have children later as a result of the pandemic — 23% among those who were not married or in a common-law relationship compared with 15% of those in a couple.
- 14% reported wanting fewer children than before — 18% among those not in a couple compared with 12% of those who were married.
- Some Canadians reported the opposite — 7% of Canadians aged 25 to 44 now want to have children sooner, while 4% want to have more children than prior to the pandemic.
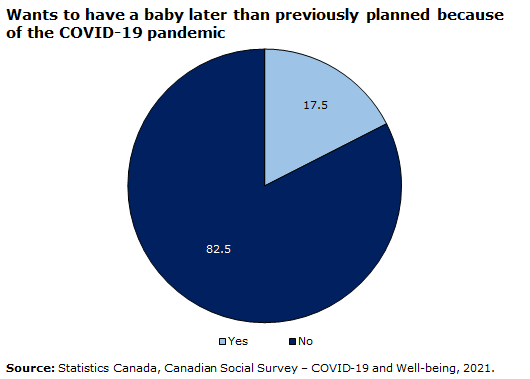
Data table
| Percent | |
|---|---|
| Yes | 17.5 |
| No | 82.5 |
| Source: Statistics Canada, Canadian Social Survey – COVID-19 and Well-being, 2021. | |

Data table
| Percent | |
|---|---|
| Yes | 13.6 |
| No | 86.4 |
| Source: Statistics Canada, Canadian Social Survey – COVID-19 and Well-being, 2021. | |
Strong interprovincial migration toward British Columbia and Atlantic Canada – which will have social and economic implications for these regions
- Interprovincial migration has also begun to return to pre-pandemic levels.
- British Columbia saw the largest increase in interprovincial migration (+34,277) nationally in 2020/2021. This was also the largest increase since 1993/1994.
- Conversely, Ontario reported the largest net loss (-17,085) in interprovincial migration.

Data table
| 2019/2020 | 2020/2021 | |
|---|---|---|
| Growth rate (%) | ||
| Canada | 1.2 | 0.55 |
| Newfoundland and Labrador | -0.4 | -0.16 |
| Prince Edward Island | 2.5 | 1.84 |
| Nova Scotia | 1.2 | 1.03 |
| New Brunswick | 0.8 | 0.77 |
| Quebec | 0.9 | 0.30 |
| Ontario | 1.4 | 0.54 |
| Manitoba | 0.8 | 0.23 |
| Saskatchewan | 0.6 | 0.05 |
| Alberta | 1.3 | 0.52 |
| British Columbia | 1.3 | 1.08 |
| Yukon | 1.9 | 1.91 |
| Northwest Territories | 0.7 | 0.29 |
| Nunavut | 1.5 | 0.63 |
| Source: Statistics Canada, Table 17-10-0009-01. | ||
Looking forward...
- Short-term, COVID-19 will have implications on labour shortages, supply of goods and services, housing, and downtowns.
- The significant drop in the net immigration level will have implications for population growth, labour, since most new immigrants are concentrated in the working age population, and regional distribution of the population since most live in large urban areas.
- Before the pandemic, immigrants and temporary foreign workers (TFW) filled gaps in Canada’s labour force helping employers respond to vacancies in various sectors including agriculture, accommodation and food services and professional, scientific and technical services sectors. With the cut by half in inflows of new immigrants and TFWs during the pandemic, those sectors are likely aligned with where labour shortages are more acute.
- Fertility was already at record low levels in 2020—1.4 children per woman—and in some parts of the country such as the Atlantic, natural increase is already at a negative. This means that for so many regions of the country, positive population growth can only be generated through immigration.
- Longer-term, while harder to predict, we may see higher population growth in the Atlantic, which can be seen to some extent as the “winners”, and slower population growth in the Prairies, in particular in Alberta with the slowdown related to oil.
Assessing the economic recovery
Overall economic activity remains below pre-pandemic levels
- Real gross domestic product rose 1.3% in the third quarter, but remained 1.4% below pre-pandemic levels.
- Spurred by strong demand and higher incomes, household spending fueled output growth along with rebounding exports.
- Non-residential business investment remained subdued, and was almost 11% below pre-pandemic levels.
- Despite declines in recent quarters, outlays on housing remained elevated compared to pre-COVID levels.

Data table
| Percent | |
|---|---|
| Household final consumption expenditure | -0.2 |
| Investment in housing | 11.0 |
| Non-residential business investment | -10.9 |
| Goods exports | -6.3 |
| Goods imports | 0.5 |
| Real gross domestic product at market prices | -1.4 |
| Source: Statistics Canada, Table 36-10-0104-01. | |
As economy-wide output continues to recover, employment rebounded to pre-COVID levels in the wake of third wave restrictions
- Economy-wide output strengthened as third wave restrictions eased and consumers spent more on out-of-the-home purchases.
- Employment growth during the late spring and summer months was led by gains in accommodation and food services as activity levels in hard-to-distance sectors rallied.
- Total employment recovered to pre-pandemic levels in September, while full-time employment among both core-age men and women had recovered by October.
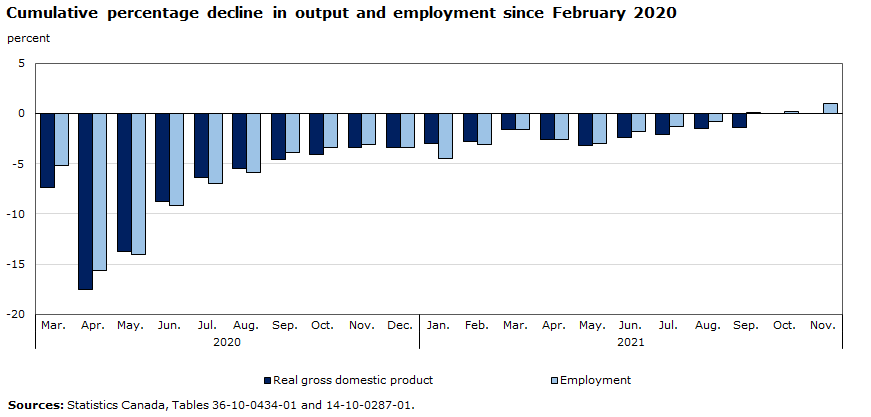
Data table
| Real gross domestic product | Employment | |
|---|---|---|
| percent | ||
| 2020 | ||
| March | -7.4 | -5.2 |
| April | -17.5 | -15.6 |
| May | -13.8 | -14.0 |
| June | -8.8 | -9.1 |
| July | -6.4 | -6.9 |
| August | -5.5 | -5.8 |
| September | -4.6 | -3.9 |
| October | -4.1 | -3.4 |
| November | -3.4 | -3.1 |
| December | -3.4 | -3.4 |
| 2021 | ||
| January | -2.9 | -4.5 |
| February | -2.8 | -3.1 |
| March | -1.6 | -1.5 |
| April | -2.6 | -2.6 |
| May | -3.1 | -3.0 |
| June | -2.4 | -1.8 |
| July | -2.0 | -1.3 |
| August | -1.5 | -0.8 |
| September | -1.4 | 0.0 |
| October | Note ..: not available for a specific reference period | 0.2 |
| November | Note ..: not available for a specific reference period | 1.0 |
|
.. not available for a specific reference period Sources: Statistics Canada, Tables 36-10-0434-01 and 14-10-0287-01. |
||
The recovery remains uneven across industrial sectors as supply disruptions impact activity
- After the initial stages of the pandemic, economic losses became increasingly concentrated in lower-wage, high contact services.
- Professional services with high degrees of telework capacity recovered quickly, while supply disruptions continue to weigh on factory output.
- As of September 2021, output levels in accommodation and food services remained 12% below pre-pandemic levels, while output in arts, entertainment and recreation industries remained about one third below.
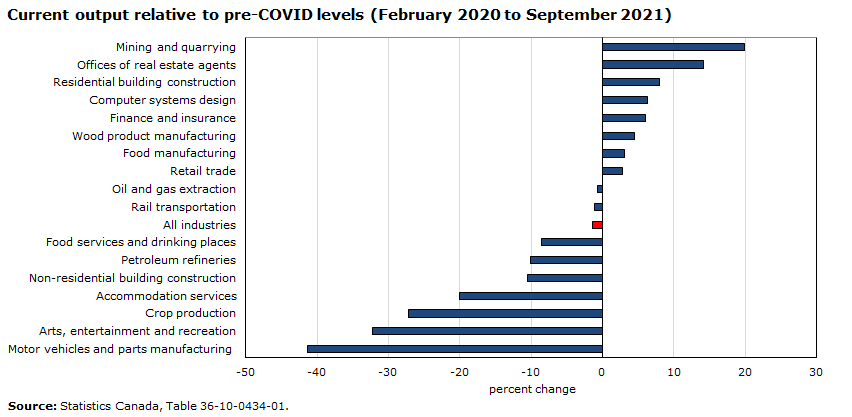
Data table
| Industry | Percent change |
|---|---|
| Mining and quarrying | 19.9 |
| Offices of real estate agents | 14.2 |
| Residential building construction | 8.1 |
| Computer systems design | 6.3 |
| Finance and insurance | 6.0 |
| Wood product manufacturing | 4.6 |
| Food manufacturing | 3.1 |
| Retail trade | 2.8 |
| Oil and gas extraction | -0.6 |
| Rail transportation | -1.2 |
| All industries | -1.4 |
| Food services and drinking places | -8.6 |
| Petroleum refineries | -10.1 |
| Non-residential building construction | -10.6 |
| Accommodation services | -20.0 |
| Crop production | -27.1 |
| Arts, entertainment and recreation | -32.2 |
| Motor vehicles and parts manufacturing | -41.4 |
| Source: Statistics Canada, Table 36-10-0434-01. | |
Employment recovery varies markedly across industrial sectors
- Employment growth strengthened in the wake of third wave restrictions in the spring. All of the cumulative gains from May to August were in service industries, over half of which reflected higher employment in accommodation and food services.
- Over half the net employment increase during this three-month period reflected higher employment among 15 to 24 year-olds, led by gains among young women. By August, the employment rate among youth had essentially returned to pre-pandemic levels.
- Total employment returned to pre-pandemic levels in September and, as of November, was one percent above levels reported in February 2020 (+186,000). Substantial differences continue to persist across sectors. As of November, net employment losses in accommodation and food services since the start of the pandemic were 202,000, while employment in professional, scientific and technical services has risen by 190,000.
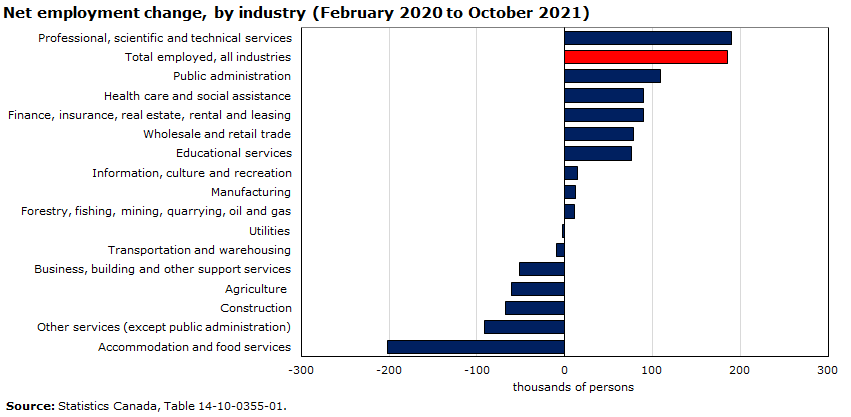
Data table
| Thousands of persons | |
|---|---|
| Professional, scientific and technical services | 189.5 |
| Total employed, all industries | 185.8 |
| Public administration | 109.2 |
| Health care and social assistance | 90.0 |
| Finance, insurance, real estate, rental and leasing | 89.2 |
| Wholesale and retail trade | 78.5 |
| Educational services | 75.8 |
| Information, culture and recreation | 14.2 |
| Manufacturing | 12.7 |
| Forestry, fishing, mining, quarrying, oil and gas | 11.0 |
| Utilities | -2.6 |
| Transportation and warehousing | -8.9 |
| Business, building and other support services | -51.0 |
| Agriculture | -60.7 |
| Construction | -67.9 |
| Other services (except public administration) | -90.9 |
| Accommodation and food services | -202.1 |
|
Source: Statistics Canada, Table 14-10-0355-01. |
|
Financial conditions in the household sector continue to be impacted by COVID
- Household wealth has risen by $2.8 trillion (+23.1%) during the pandemic, bolstered by gains in equities and housing. The household saving rate has been in double-digit territory for six consecutive quarters, while financial risk ratios, including those for low-income and younger households, remain below pre-pandemic levels.
- Lower-wealth household and young families have seen disproportionately large increases in their income and wealth.
- The winding down of emergency support programs may put strains on the inclusiveness of the recovery. Workers in the population groups designated as visible minorities were hit harder by the social, economic and health impacts of the pandemic, were more likely to receive Canada Emergency Response Benefit (CERB) payments, and are more financially vulnerable as income supports wind down.
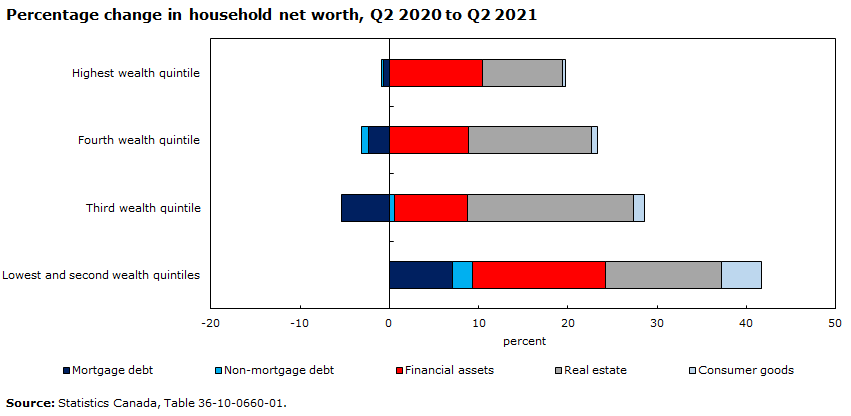
Data table
| Mortgage debt | Non-mortgage debt | Financial assets | Real estate | Consumer goods | |
|---|---|---|---|---|---|
| percent | |||||
| Highest wealth quintile | -0.7 | -0.2 | 10.4 | 9.0 | 0.3 |
| Fourth wealth quintile | -2.3 | -0.8 | 8.9 | 13.8 | 0.6 |
| Third wealth quintile | -5.4 | 0.6 | 8.1 | 18.7 | 1.2 |
| Lowest and second wealth quintiles | 7.1 | 2.2 | 14.9 | 13.0 | 4.5 |
| Source: Statistics Canada, Table 36-10-0660-01. | |||||
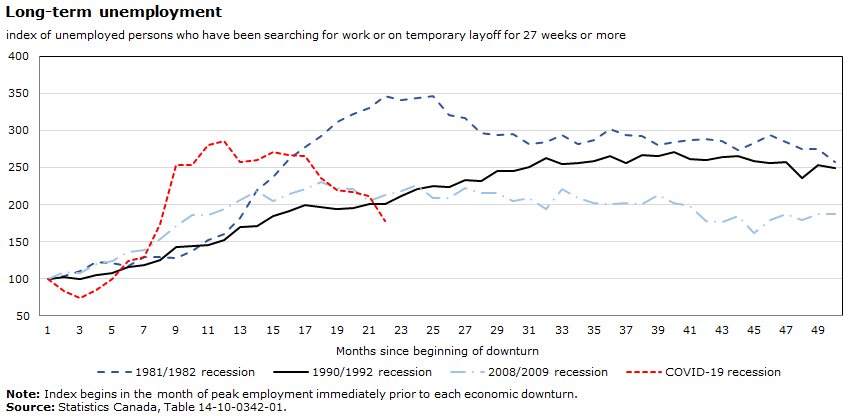
The number of workers experiencing long-term unemployment remains above pre-COVID levels
- As of November 2021, long-term unemployment was about three quarters above levels reported prior to the pandemic.
- 318,000 Canadians have been searching for work or on temporary layoff for 27 weeks or more.
- In November, workers experiencing long-term unemployment accounted for 25.6% of all unemployed persons, up from 15.6% prior to the pandemic.
- Over half of the net increase in long-term unemployment reflects higher unemployment among core-aged workers, led by increases among core-age men.
Data table
| Months since beginning of downturn | 1981/1982 recession | 1990/1992 recession | 2008/2009 recession | COVID-19 recession |
|---|---|---|---|---|
| Index of unemployed persons who have been searching for work or on temporary layoff for 27 weeks or more | ||||
| 1 | 100.0 | 100.0 | 100.0 | 100.0 |
| 2 | 103.3 | 102.7 | 109.6 | 84.0 |
| 3 | 109.9 | 100.2 | 107.8 | 73.4 |
| 4 | 123.2 | 105.6 | 119.9 | 84.2 |
| 5 | 121.4 | 107.9 | 123.6 | 99.6 |
| 6 | 117.2 | 115.8 | 135.5 | 123.6 |
| 7 | 128.8 | 118.7 | 138.8 | 129.0 |
| 8 | 129.8 | 124.7 | 154.0 | 173.9 |
| 9 | 128.5 | 143.5 | 170.8 | 252.8 |
| 10 | 137.7 | 143.9 | 186.3 | 253.3 |
| 11 | 152.2 | 145.0 | 185.8 | 280.4 |
| 12 | 159.8 | 152.7 | 194.1 | 285.4 |
| 13 | 182.4 | 169.2 | 206.6 | 257.9 |
| 14 | 219.4 | 170.5 | 219.0 | 259.5 |
| 15 | 236.8 | 185.2 | 205.2 | 271.3 |
| 16 | 260.9 | 191.9 | 213.9 | 266.8 |
| 17 | 277.9 | 199.1 | 220.7 | 266.0 |
| 18 | 292.5 | 196.3 | 230.7 | 235.9 |
| 19 | 311.8 | 193.8 | 222.4 | 220.0 |
| 20 | 322.3 | 195.6 | 220.4 | 217.0 |
| 21 | 330.1 | 200.6 | 205.5 | 211.9 |
| 22 | 346.7 | 200.4 | 212.9 | 177.5 |
| 23 | 341.6 | 211.0 | 218.2 | Note ..: not available for a specific reference period |
| 24 | 343.6 | 221.1 | 225.8 | Note ..: not available for a specific reference period |
| 25 | 346.8 | 224.9 | 208.2 | Note ..: not available for a specific reference period |
| 26 | 321.2 | 223.4 | 209.2 | Note ..: not available for a specific reference period |
| 27 | 316.4 | 232.5 | 221.9 | Note ..: not available for a specific reference period |
| 28 | 296.0 | 231.9 | 215.0 | Note ..: not available for a specific reference period |
| 29 | 293.5 | 245.3 | 216.0 | Note ..: not available for a specific reference period |
| 30 | 294.9 | 245.5 | 204.9 | Note ..: not available for a specific reference period |
| 31 | 281.7 | 251.1 | 208.6 | Note ..: not available for a specific reference period |
| 32 | 285.0 | 262.9 | 194.0 | Note ..: not available for a specific reference period |
| 33 | 293.5 | 254.4 | 221.4 | Note ..: not available for a specific reference period |
| 34 | 281.4 | 256.0 | 208.4 | Note ..: not available for a specific reference period |
| 35 | 286.9 | 259.3 | 202.7 | Note ..: not available for a specific reference period |
| 36 | 301.4 | 265.6 | 200.5 | Note ..: not available for a specific reference period |
| 37 | 294.2 | 256.1 | 202.1 | Note ..: not available for a specific reference period |
| 38 | 292.7 | 266.2 | 200.5 | Note ..: not available for a specific reference period |
| 39 | 280.2 | 265.1 | 212.9 | Note ..: not available for a specific reference period |
| 40 | 284.5 | 271.3 | 201.6 | Note ..: not available for a specific reference period |
| 41 | 287.7 | 261.5 | 197.9 | Note ..: not available for a specific reference period |
| 42 | 288.8 | 259.9 | 177.7 | Note ..: not available for a specific reference period |
| 43 | 285.2 | 264.4 | 176.4 | Note ..: not available for a specific reference period |
| 44 | 273.0 | 265.1 | 185.2 | Note ..: not available for a specific reference period |
| 45 | 283.0 | 258.4 | 162.1 | Note ..: not available for a specific reference period |
| 46 | 294.2 | 255.7 | 179.7 | Note ..: not available for a specific reference period |
| 47 | 283.8 | 257.9 | 187.6 | Note ..: not available for a specific reference period |
| 48 | 275.5 | 236.3 | 179.2 | Note ..: not available for a specific reference period |
| 49 | 274.7 | 252.9 | 187.0 | Note ..: not available for a specific reference period |
| 50 | 258.1 | 249.2 | 186.9 | Note ..: not available for a specific reference period |
|
.. not available for a specific reference period Note: Index begins in the month of peak employment immediately prior to each economic downturn. Source: Statistics Canada, Table 14-10-0342-01. |
||||
Current business conditions: Significant pressures related to rising input costs and mismatches between labour supply and demand cloud the business outlook
- Rising input costs related to labour, energy, capital or raw materials were identified as an obstacle in late 2021 by over 40% of businesses.
- One third of businesses expect labour shortages to be an obstacle, up from 30% and 24% in the previous two quarters.
- One quarter of businesses expect difficulty sourcing inputs domestically, with another one fifth anticipating difficulties internationally. In both cases, over one half of those businesses expect these challenges to persist for six months or more.

Data table
| Q2 2021 | Q3 2021 | Q4 2021 | |
|---|---|---|---|
| percent of businesses | |||
| Rising cost of inputs | 37.8 | 38.5 | 42.5 |
| Recruiting skilled employees | 27.8 | 34.6 | 35.4 |
| Shortage of labour force | 23.8 | 30.3 | 32.7 |
| Cost of insurance | 26.3 | 25.3 | 31.9 |
| Transportation costs | 22.8 | 22.8 | 30.9 |
| Retaining skilled employees | 22.1 | 24.5 | 26.1 |
| Fluctuations in consumer demand | 26.7 | 22.6 | 21.2 |
| Sources: Statistics Canada, Tables 33-10-0364-01, 33-10-0338-01 and 33-10-0400-1. | |||
Job vacancies remain elevated, highlighting potential mismatches between labour supply and demand
- While high job vacancies can be an indicator of growing employment, they can also be a signal of high turnover, labour shortages or mismatches between the characteristics of vacant positions and those of available workers.
- Job vacancies were at record levels in the second quarter and continued to rise into early fall. The job vacancy rate was 6.0% in September.
- Vacancies were highest in accommodation and food services, where employers were actively recruiting for 196,100 positions. By comparison, there were 76,600 vacancies in this sector during the third quarter of 2019.

Data table
| Job vacancies | Payroll employees | |
|---|---|---|
| number of job vacancies and payroll employees | ||
| Quarterly series 2021 | ||
| Q1 2021 | 56,590 | 1,300,610 |
| Q2 2021 | 77,540 | 1,313,735 |
| Q3 2021 | 76,605 | 1,398,200 |
| Q4 2021 | 61,725 | 1,364,650 |
| 2020 | ||
| October | 52,275 | 1,050,320 |
| November | 43,370 | 1,032,685 |
| December | 43,495 | 957,110 |
| 2021 | ||
| January | 33,015 | 924,815 |
| February | 40,275 | 844,875 |
| March | 71,570 | 856,235 |
| April | 64,510 | 900,345 |
| May | 78,365 | 921,880 |
| June | 123,700 | 891,265 |
| July | 132,800 | 1,008,410 |
| August | 156,755 | 1,120,270 |
| September | 196,050 | 1,165,225 |
|
Note: The data are not seasonally adjusted. Sources: Job Vacancy and Wage Survey (5217), tables 14-10-0371-01 and 14-10-0326-01. |
||
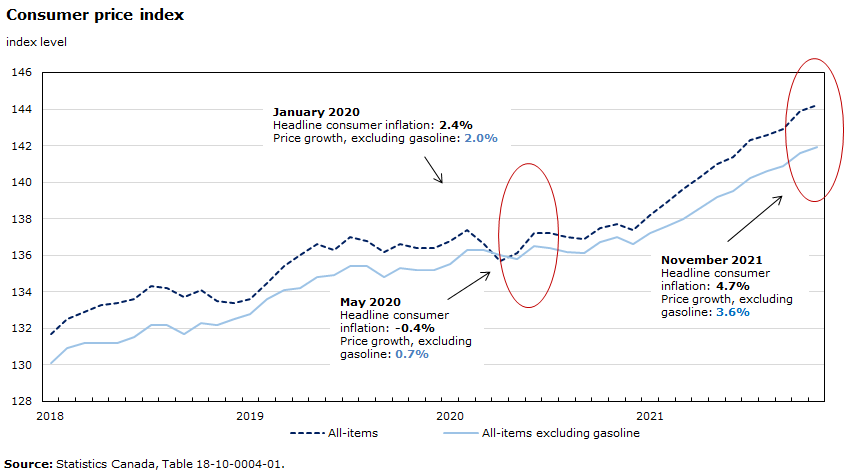
Consumer inflation accelerates at the fastest pace since 2003 as gasoline, shelter costs and consumer durables put upward pressure on the headline rate
- While base effects have impacted headline inflation in recent months, consumer prices, measured month-over-month, have steadily increased since the beginning of 2021.
- Higher prices for gasoline, shelter and consumer durables have all contributed to these recent increases as disruptions continue to impact supply chains in many sectors of the economy.
- Food prices have also risen in recent months, and were up 4.4%, year-over-year, in November.
Data table
| All-items | All-items excluding gasoline | |
|---|---|---|
| index level | ||
| 2018 | ||
| January | 131.7 | 130.1 |
| February | 132.5 | 130.9 |
| March | 132.9 | 131.2 |
| April | 133.3 | 131.2 |
| May | 133.4 | 131.2 |
| June | 133.6 | 131.5 |
| July | 134.3 | 132.2 |
| August | 134.2 | 132.2 |
| September | 133.7 | 131.7 |
| October | 134.1 | 132.3 |
| November | 133.5 | 132.2 |
| December | 133.4 | 132.5 |
| 2019 | ||
| January | 133.6 | 132.8 |
| February | 134.5 | 133.6 |
| March | 135.4 | 134.1 |
| April | 136.0 | 134.2 |
| May | 136.6 | 134.8 |
| June | 136.3 | 134.9 |
| July | 137.0 | 135.4 |
| August | 136.8 | 135.4 |
| September | 136.2 | 134.8 |
| October | 136.6 | 135.3 |
| November | 136.4 | 135.2 |
| December | 136.4 | 135.2 |
| 2020 | ||
| January | 136.8 | 135.5 |
| February | 137.4 | 136.3 |
| March | 136.6 | 136.3 |
| April | 135.7 | 136.0 |
| May | 136.1 | 135.8 |
| June | 137.2 | 136.5 |
| July | 137.2 | 136.4 |
| August | 137.0 | 136.2 |
| September | 136.9 | 136.1 |
| October | 137.5 | 136.7 |
| November | 137.7 | 137.0 |
| December | 137.4 | 136.6 |
| 2021 | ||
| January | 138.2 | 137.2 |
| February | 138.9 | 137.6 |
| March | 139.6 | 138.0 |
| April | 140.3 | 138.6 |
| May | 141.0 | 139.2 |
| June | 141.4 | 139.5 |
| July | 142.3 | 140.2 |
| August | 142.6 | 140.6 |
| September | 142.9 | 140.9 |
| October | 143.9 | 141.6 |
| November | 144.2 | 141.9 |
| Source: Statistics Canada, Table 18-10-0004-01. | ||
January 2020
Headline consumer inflation: 2.4%
Price growth, excluding gasoline: 2.0%
May 2020
Headline consumer inflation: -0.4%
Price growth, excluding gasoline: 0.7%
November 2021
Headline consumer inflation: 4.7%
Price growth, excluding gasoline: 3.6%
The first circle (April 2020 – August 2020) highlights the reversing trend where the consumer price index begins to rise again, and the second circle (August 2021 – November 2021) highlights the most recent consumer price index data.
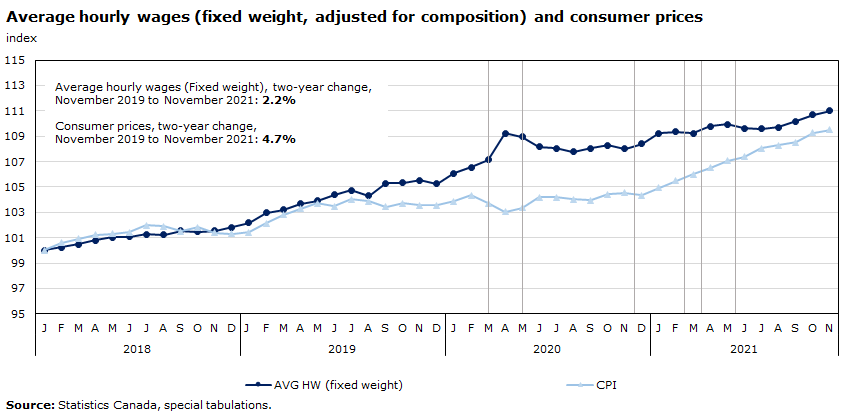
Consumer Inflation outpacing wage growth as supply disruptions contribute to rising prices
- The pace of wage growth in the economy, measured year-over-year, is running well behind the current rate of consumer inflation.
- Average hourly wages (adjusted for changes in workforce composition due to the pandemic) were up 2.8% in the twelve months to November, while headline inflation accelerated to 4.7%
Data table
| AVG HW (fixed weight) | CPI | |
|---|---|---|
| index | ||
| 2018 | ||
| January | 100.0 | 100.0 |
| February | 100.3 | 100.6 |
| March | 100.5 | 100.9 |
| April | 100.8 | 101.2 |
| May | 101.1 | 101.3 |
| June | 101.1 | 101.4 |
| July | 101.3 | 102.0 |
| August | 101.2 | 101.9 |
| September | 101.5 | 101.5 |
| October | 101.5 | 101.8 |
| November | 101.5 | 101.4 |
| December | 101.8 | 101.3 |
| 2019 | ||
| January | 102.2 | 101.4 |
| February | 103.0 | 102.1 |
| March | 103.2 | 102.8 |
| April | 103.7 | 103.3 |
| May | 103.9 | 103.7 |
| June | 104.4 | 103.5 |
| July | 104.7 | 104.0 |
| August | 104.3 | 103.9 |
| September | 105.3 | 103.4 |
| October | 105.3 | 103.7 |
| November | 105.5 | 103.6 |
| December | 105.3 | 103.6 |
| 2020 | ||
| January | 106.1 | 103.9 |
| February | 106.6 | 104.3 |
| March | 107.1 | 103.7 |
| April | 109.2 | 103.0 |
| May | 109.0 | 103.3 |
| June | 108.2 | 104.2 |
| July | 108.0 | 104.2 |
| August | 107.8 | 104.0 |
| September | 108.0 | 103.9 |
| October | 108.3 | 104.4 |
| November | 108.0 | 104.6 |
| December | 108.4 | 104.3 |
| 2021 | ||
| January | 109.2 | 104.9 |
| February | 109.3 | 105.5 |
| March | 109.2 | 106.0 |
| April | 109.8 | 106.5 |
| May | 109.9 | 107.1 |
| June | 109.6 | 107.4 |
| July | 109.6 | 108.0 |
| August | 109.7 | 108.3 |
| September | 110.2 | 108.5 |
| October | 110.7 | 109.3 |
| November | 111.0 | 109.5 |
| Source: Statistics Canada, special tabulations. | ||
Average hourly wages (Fixed weight), two-year change,
November 2019 to November 2021: 2.8%
Consumer prices, two-year change,
November 2019 to November 2021: 4.7%
Gray boxes loosely identify the tightening and loosening of public health measures in response to waves of COVID-19. Box one from March 2020 – May 2020. Box 2 from mid November 2020 – mid February 2021. Box 3 from mid March 2021 – mid June 2021.
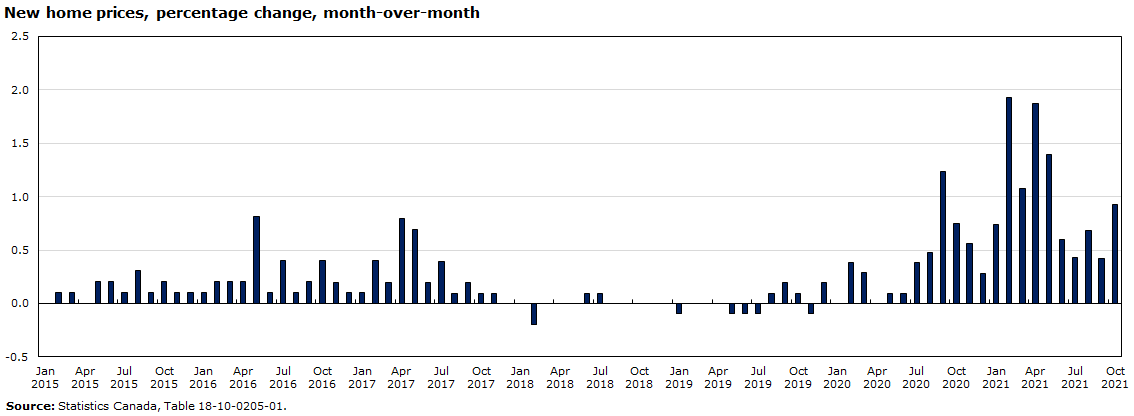
Sustained increases in new home prices reflect strong demand and rising input costs, putting pressures on affordability
- Nationally, new home prices rose 11.5% year over year in October.
- Prices were up in all 27 markets surveyed, with the largest annual increases in Kitchener–Cambridge–Waterloo (+29.2%), Ottawa (+24.8%) and Windsor (+21.9%).
- Strong demand, rising input costs, and limited housing supply has put upward pressure on home prices across the country.
- Many first-time homebuyers may face significant financial challenges, especially as borrowing and debt-servicing costs begin to rise, while other potential homeowners will be priced out of the housing market.
Data table
| Percentage change | |
|---|---|
| 2015 | |
| January | 0.0 |
| February | 0.1 |
| March | 0.1 |
| April | 0.0 |
| May | 0.2 |
| June | 0.2 |
| July | 0.1 |
| August | 0.3 |
| September | 0.1 |
| October | 0.2 |
| November | 0.1 |
| December | 0.1 |
| 2016 | |
| January | 0.1 |
| February | 0.2 |
| March | 0.2 |
| April | 0.2 |
| May | 0.8 |
| June | 0.1 |
| July | 0.4 |
| August | 0.1 |
| September | 0.2 |
| October | 0.4 |
| November | 0.2 |
| December | 0.1 |
| 2017 | |
| January | 0.1 |
| February | 0.4 |
| March | 0.2 |
| April | 0.8 |
| May | 0.7 |
| June | 0.2 |
| July | 0.4 |
| August | 0.1 |
| September | 0.2 |
| October | 0.1 |
| November | 0.1 |
| December | 0.0 |
| 2018 | |
| January | 0.0 |
| February | -0.2 |
| March | 0.0 |
| April | 0.0 |
| May | 0.0 |
| June | 0.1 |
| July | 0.1 |
| August | 0.0 |
| September | 0.0 |
| October | 0.0 |
| November | 0.0 |
| December | 0.0 |
| 2019 | |
| January | -0.1 |
| February | 0.0 |
| March | 0.0 |
| April | 0.0 |
| May | -0.1 |
| June | -0.1 |
| July | -0.1 |
| August | 0.1 |
| September | 0.2 |
| October | 0.1 |
| November | -0.1 |
| December | 0.2 |
| 2020 | |
| January | 0.0 |
| February | 0.4 |
| March | 0.3 |
| April | 0.0 |
| May | 0.1 |
| June | 0.1 |
| July | 0.4 |
| August | 0.5 |
| September | 1.2 |
| October | 0.8 |
| November | 0.6 |
| December | 0.3 |
| 2021 | |
| January | 0.7 |
| February | 1.9 |
| March | 1.1 |
| April | 1.9 |
| May | 1.4 |
| June | 0.6 |
| July | 0.4 |
| August | 0.7 |
| September | 0.4 |
| October | 0.9 |
| Source: Statistics Canada, Table 18-10-0205-01. | |
Labour market resilience: Job security will likely be higher among higher-paid and more educated workers, who often hold triple-protected jobs
- Of employees aged 25 to 64 who were in the top 10% of the wage distribution in 2019, 88% held triple-protected jobs (not temporary, low risk of automation, and resilient to pandemics).
- The corresponding percentage for their counterparts in the bottom 10% of the wage distribution was 14%.
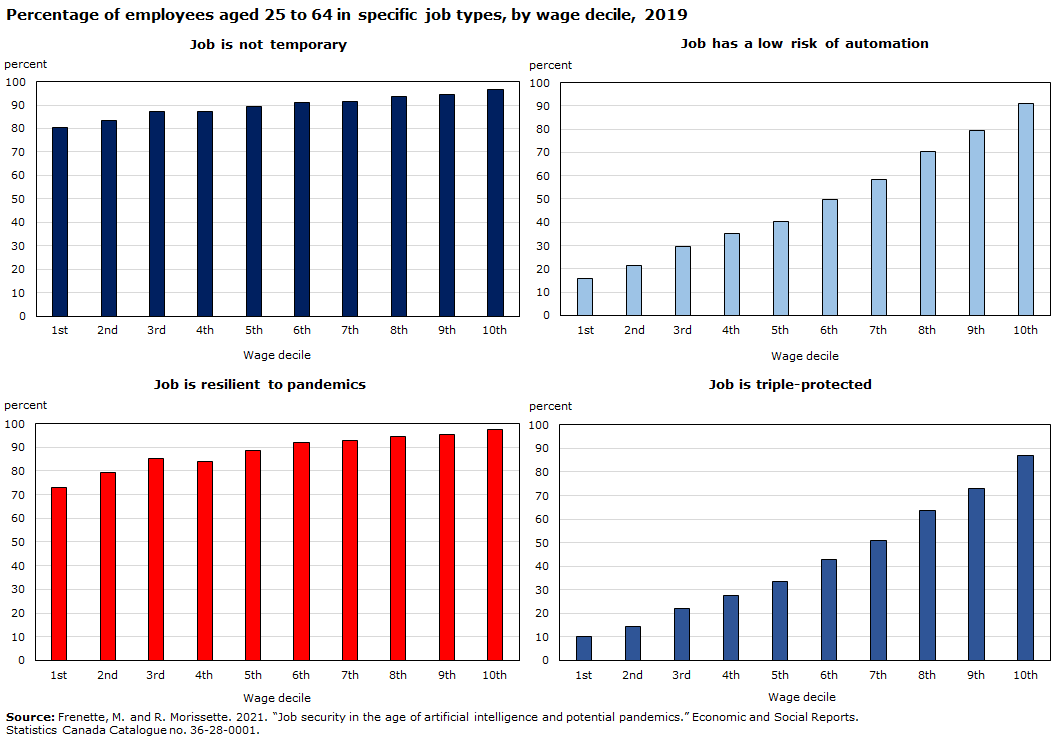
Data table
| Wage decile | Job is not temporary | Job has a low risk of automation | Job is resilient to pandemics | Job is triple-protected |
|---|---|---|---|---|
| percent | ||||
| 1st | 80.3 | 15.7 | 73.0 | 10.2 |
| 2nd | 83.3 | 21.6 | 79.3 | 14.3 |
| 3rd | 87.1 | 29.6 | 85.3 | 22.0 |
| 4th | 87.1 | 35.1 | 84.0 | 27.6 |
| 5th | 89.4 | 40.3 | 88.6 | 33.4 |
| 6th | 91.0 | 49.9 | 92.2 | 42.9 |
| 7th | 91.4 | 58.2 | 92.7 | 50.8 |
| 8th | 93.7 | 70.4 | 94.5 | 63.5 |
| 9th | 94.4 | 79.2 | 95.5 | 72.8 |
| 10th | 96.7 | 90.9 | 97.6 | 86.9 |
| Source: Frenette, M. and R. Morissette. 2021. “Job security in the age of artificial intelligence and potential pandemics.” Economic and Social Reports. Statistics Canada Catalogue no. 36-28-0001. | ||||
The interconnectedness of the environment, the economy and society is more apparent than ever, and will require policy makers to consider all three lenses to ensure effective decision-making
- Economic sectors like oil and gas extraction are major emitters, but so are final consumption activities from households, such as driving gasoline-powered vehicles.
- There are economic opportunities in responding to climate change: The environmental and clean technology sector contributed 3.3% of GDP in 2020. The composition of that sector’s workforce in 2019 was still predominantly male (64%), and Indigenous participation was focused in the 15 to 24 year age group.
- Expenditures on environmental protection increased by 15% between 2016 and 2018. Business innovation strategies are increasingly focused on environmental outcomes.

Data table
| Kilotonnes of CO2e | |
|---|---|
| Oil and gas extraction | 166,114 |
| Households: Motor fuels and lubricants |
85,383 |
| Crop and animal production (except cannabis) |
78,620 |
| Electric power generation, transmission and distribution |
70,652 |
| Households: Electricity and other fuels |
66,371 |
| Source: Statistics Canada, Table 38-10-0097-01. | |
Looking forward…
The initial stages of the pandemic coincided with sharp increases in business productivity as businesses invested in digital infrastructure while economic resources were transferred from lower productivity to higher productivity sectors. Productivity has trended down in recent quarters as lower-wage services rebound.
- Are the productivity impacts of the pandemic, especially those related to investments in digital technology, likely to be short-lived or long-lasting? How would a widespread shift to working from home, after most pandemic-related restrictions have eased, affect the competitiveness of Canadian businesses?
Business innovation is becoming more focused on environmental outcomes—nearly half of businesses reported that they experienced environmental benefits from innovating, with over one third indicating that the innovation had environmental benefits for the consumer or end user.
- To what extent will investments in clean energy, clean technology and environmental products supplant traditional investments in oil and gas? What are the implications of the clean energy transition for economic growth?
Housing prices have continued to rise steadily in recent months, while consumer inflation is at its highest level in over 18 years.
- How are emerging pressures related to affordability affecting the financial well-being of Canadian families? How will financial conditions in the household sector evolve in the near term as income support programs wind down?
A key feature of the pandemic has been its unevenness—evidenced by the disproportionate social, economic and health impacts on more vulnerable groups, including low wage workers, recent immigrants, young people and racialized communities.
- How will the pandemic affect job quality going forward—especially in lower paid sectors that were severely impacted by the pandemic? What does this imply for the unevenness of the recovery over the longer-term?
Statistics Canada – Areas of focus moving forward

- Disaggregated Data Action Plan: The Agency will further improve the quality and availability of disaggregated data in support of the Government’s commitment to evidence-based decision-making that takes into consideration the impacts of policies on all Canadians to address systemic socio-economic inequities.
- Census of the Environment: Provide a detailed picture of Canada’s natural assets that will enable informed decision-making regarding the impact of various interventions that aim to protect, rehabilitate, enhance or sustain the country’s natural environment.
- Quality of Life Framework: Working with Department of Finance to develop new indicators to monitor the quality of life of Canadians.
- Develop new partnerships and tools, as well as data-collection and analysis methods to monitor and report on trends in the well-being of Canadians, particularly as the country moves from pandemic response to recovery.
For more information and research from Statistics Canada on COVID-19 and other critical policy issues, check out the following…
COVID-19: A data perspective
Canadian Economic Dashboard and COVID-19
COVID-19 in Canada: A One-year Update on Social and Economic Impacts
Interactive data visualizations related to COVID-19
Selected analytical and research publications:
Health Reports
Economic and Social Reports
Insights on Canadian Society
- Date modified: