
Toronto – A data Story on Ethnocultural Diversity and Inclusion in Canada

Archived Content
Information identified as archived is provided for reference, research or recordkeeping purposes. It is not subject to the Government of Canada Web Standards and has not been altered or updated since it was archived. Please "contact us" to request a format other than those available.
A Data Story: A discussion with Statistics Canada
Anil Arora Chief Statistician of Canada
Toronto, April 29, 2019
Delivering insight through data for a better Canada.
Statistics Canada and measuring diversity and inclusion

Who are we?
Statistics Canada has two primary objectives:
- To provide statistical information and analysis about Canada's economic and social structure;
- To promote sound statistical practices and standards.
Forces at play in defining a measure on diversity and inclusion
Measuring diversity and inclusion
- Policies and programs
- Legislation
- Scientific
- Technological changes
- Interest groups, community organizations, sub-populations
- Public opinion, opinion leaders, media
- Demographic changes
Various data sources are used to measure and take into account the cultural, ethnic, linguistic and religious diversity and pluralism in Canada
- Census
- Thematic surveys
- General Social Survey (GSS)
- Canadian Community Health Survey (CCHS)
- Labour Force Survey (LFS)
- Program for the International Assessment of Adult Competencies (PIAAC)
- Longitudinal and International Study of Adults (LISA)
- Administrative databases
- Longitudinal Immigration Database (IMDB)
- Uniform Crime Reporting Survey
- Surveys of specific populations
- Survey on the Vitality of Official-Language Minorities (SVOLM)
- Aboriginal Peoples Survey (APS)
- Ethnic Diversity Survey (EDS)
- Longitudinal Survey of Immigrants to Canada (LSIC)
Evolution of ethnocultural questions in the Canadian census

Description for Figure 1 - Evolution of ethnocultural questions in the Canadian census
| 1871 | 1881 | 1891 | 1901 | 1911 | 1921 | 1931 | 1941 | 1951 | 1961 | 1971 | 1981 | 1986 | 1991 | 1996 | 2001 | 2006 | 2011 | 2016 | |
|---|---|---|---|---|---|---|---|---|---|---|---|---|---|---|---|---|---|---|---|
| Place of birth | X | X | X | X | X | X | X | X | X | X | X | X | X | X | X | X | X | X | X |
| Citizenship | X | X | X | X | X | X | X | X | X | X | X | X | X | X | X | X | |||
| Year of immigration | X | X | X | X | X | X | X | X | X | X | X | X | X | X | X | X | |||
| (Year of naturalization) | X | X | X | X | X | ||||||||||||||
| Immigrant status | X | X | X | X | X | X | |||||||||||||
| Place of birth of parents | X | X | X | X | X | X | X | X | |||||||||||
| (Colour) | X | ||||||||||||||||||
| Origin | X | X | X | X | X | X | X | X | X | X | X | X | X | X | X | X | X | X | |
| Population groups/visible minorities | X | X | X | X | X | ||||||||||||||
| Aboriginal groups (Aboriginal identity) | X | X | X | X | X | X | |||||||||||||
| Registered or Treaty Indian status | X | X | X | X | X | X | |||||||||||||
| Membership in a First Nation or Indian band | X | X | X | X | X | X | |||||||||||||
| (French Canadian) | X | ||||||||||||||||||
| Mother tongue | X | X | X | X | X | X | X | X | X | X | X | X | X | X | X | X | |||
| Knowledge of official languages | X | X | X | X | X | X | X | X | X | X | X | X | X | X | X | X | |||
| Knowledge of non-official languages | X | X | X | X | X | X | |||||||||||||
| Language spoken most often at home | X | X | X | X | X | X | X | X | X | ||||||||||
| Language spoken regularly at home | X | X | X | X | |||||||||||||||
| Language used most often at work | X | X | X | X | |||||||||||||||
| Language used regularly at work | X | X | X | X | |||||||||||||||
| Religion | X | X | X | X | X | X | X | X | X | X | X | X | X | X | X | ||||
| Sources: Statistics Canada, Census of Population, 1871 to 2001, 2016; National Household Survey, 2011. | |||||||||||||||||||
Key concepts in immigration and ethnocultural diversity in Canada: 2016 Census
- Place of birth
- Place of birth of person
- Place of birth of parents
- Generation status
- Immigration
- Landed immigrants/permanent residents
- Year of immigration
- Admission category
- Non-permanent residents
- Landed immigrants/permanent residents
- Citizenship
- Canadian citizenship by birth or naturalization; Country of citizenship
- Religion
- Religious affiliation
- Ethnic origins
- Aboriginal peoples (First Nations, Métis and Inuit)
- Aboriginal ancestry
- Aboriginal identity
- Registered or Treaty Indian Status
- Member of a First Nation or Indian band
- Population group/visible Minorities
- Language
- Mother tongue
- Language spoken at home, language used at work
- Knowledge of official languages and non-official languages
- First official language spoken
For more information, please refer to the 2016 Census dictionary.
Key concepts in immigration and ethnocultural diversity in Canada: Road to the 2021 Census
- Place of birth
- Place of birth of person
- Place of birth of parents (2019 Census Test: modified version)
- Generation status
- Immigration
- (2019 Census Test: modified version and could be replaced by administrative data)
- Landed immigrants/permanent residents
- Year of immigration
- Admission category
- Non-permanent residents
- Citizenship
- Canadian citizenship by birth or naturalization; Country of citizenship (2019 Census Test: modified version)
- Religion
- Religious affiliation (2019 Census Test: modified version)
- Ethnic origins
- (2019 Census Test: modified version)
- Indigenous peoples (First Nations, Métis and Inuit)
- Aboriginal ancestry
- Aboriginal identity (2019 Census Test: modified version)
- Registered or Treaty Indian Status
- Member of a First Nation or Indian band
- Métis (2019 Census Test: new question)
- Inuit (2019 Census Test: new question)
- Population group/visible minorities
- (2019 Census Test: modified version)
- Language
- Mother tongue (2019 Census Test: modified version)
- Language spoken at home, language used at work (2019 Census Test: modified version)
- Knowledge of official languages and non-official languages
- First official language spoken
- Language rights-holders (2019 Census Test: new questions)
For more information on the road to the 2021 Census, please refer to The road to the 2021 Census.
Portrait of ethnocultural diversity in Ontario and Toronto
Net international migration is the main driver of population growth in Ontario

Description for Chart 1 - Sources of population growth in Ontario, 1971-1972 to 2017-2018
| Natural increase | Net international migration | Net interprovincial migration | |
|---|---|---|---|
| 1971-1972 | 68,683 | 50,894 | 14,462 |
| 1972-1973 | 65,320 | 66,064 | 940 |
| 1973-1974 | 61,746 | 96,679 | -9,802 |
| 1974-1975 | 66,026 | 97,582 | -28,194 |
| 1975-1976 | 63,082 | 69,424 | -18,932 |
| 1976-1977 | 62,074 | 50,158 | -6,402 |
| 1977-1978 | 59,711 | 33,371 | 8,510 |
| 1978-1979 | 61,471 | 30,327 | -4,325 |
| 1979-1980 | 59,117 | 62,741 | -22,362 |
| 1980-1981 | 60,519 | 53,349 | -33,247 |
| 1981-1982 | 60,173 | 53,642 | -5,665 |
| 1982-1983 | 61,946 | 33,892 | 23,585 |
| 1983-1984 | 63,922 | 27,746 | 36,400 |
| 1984-1985 | 65,448 | 27,988 | 33,885 |
| 1985-1986 | 66,332 | 42,774 | 33,562 |
| 1986-1987 | 67,519 | 88,256 | 42,601 |
| 1987-1988 | 65,424 | 97,819 | 35,215 |
| 1988-1989 | 71,151 | 181,584 | 9,739 |
| 1989-1990 | 78,813 | 117,464 | -5,961 |
| 1990-1991 | 79,123 | 66,832 | -11,627 |
| 1991-1992 | 78,454 | 85,561 | -11,045 |
| 1992-1993 | 74,101 | 69,969 | -14,189 |
| 1993-1994 | 69,845 | 80,731 | -9,420 |
| 1994-1995 | 69,082 | 76,780 | -2,841 |
| 1995-1996 | 65,353 | 81,047 | -2,822 |
| 1996-1997 | 55,911 | 89,115 | 1,977 |
| 1997-1998 | 53,094 | 78,180 | 9,231 |
| 1998-1999 | 50,524 | 73,883 | 16,706 |
| 1999-2000 | 49,938 | 108,485 | 22,369 |
| 2000-2001 | 46,623 | 151,383 | 18,623 |
| 2001-2002 | 47,958 | 146,586 | 5,354 |
| 2002-2003 | 45,846 | 107,641 | 637 |
| 2003-2004 | 48,719 | 107,865 | -6,935 |
| 2004-2005 | 47,513 | 104,160 | -11,172 |
| 2005-2006 | 50,023 | 106,292 | -17,501 |
| 2006-2007 | 50,169 | 94,635 | -20,047 |
| 2007-2008 | 53,045 | 102,371 | -14,750 |
| 2008-2009 | 51,967 | 100,225 | -15,601 |
| 2009-2010 | 52,169 | 111,755 | -4,662 |
| 2010-2011 | 48,272 | 101,784 | -4,007 |
| 2011-2012 | 52,071 | 99,948 | -10,611 |
| 2012-2013 | 47,538 | 98,635 | -13,901 |
| 2013-2014 | 45,841 | 87,618 | -14,564 |
| 2014-2015 | 42,318 | 68,066 | -8,695 |
| 2015-2016 | 42,761 | 126,867 | 9,077 |
| 2016-2017 | 40,834 | 141,835 | 13,382 |
| 2017-2018 | 40,747 | 192,679 | 17,886 |
In 2016, immigrants represented nearly 29% of the total population in Ontario, compared with 28% in British Columbia, 21% in Alberta and 14% in Quebec.
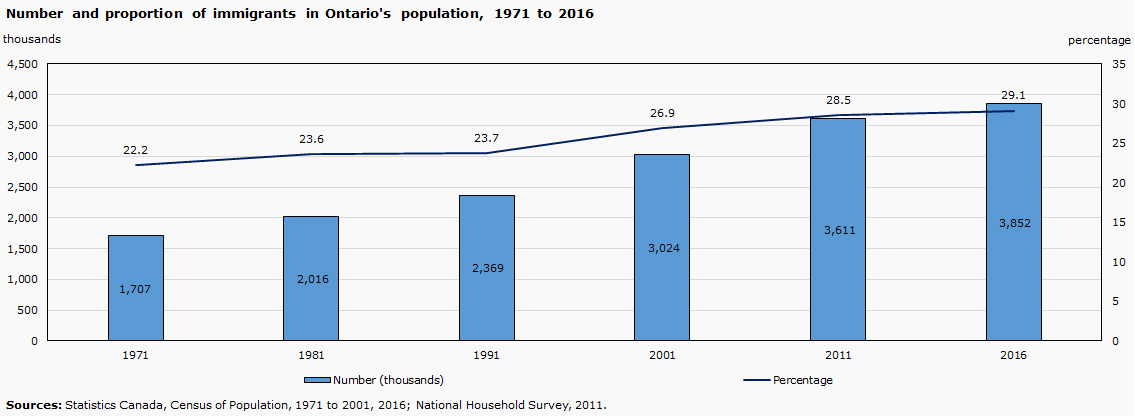
Description for Chart 2 - Number and proportion of immigrants in Ontario population, 1971 to 2016
| Number | Percentage | |
|---|---|---|
| 1971 | 1,707,395 | 22.2 |
| 1981 | 2,015,700 | 23.6 |
| 1991 | 2,369,175 | 23.7 |
| 2001 | 3,024,375 | 26.9 |
| 2011 | 3,611,365 | 28.5 |
| 2016 | 3,852,145 | 29.1 |
| Sources: Statistics Canada, Census of Population, 1971 to 2001, 2016; National Household Survey, 2011. | ||
In Ontario, the highest proportion of immigrants is in the census metropolitan area of Toronto
| Number of immigrants | Proportion (%) | |
|---|---|---|
| Toronto | 2,705,550 | 46.1 |
| Hamilton | 177,070 | 24.1 |
| Kitchener-Cambridge-Waterloo | 118,610 | 23.0 |
| Windsor | 74,495 | 22.9 |
| Ottawa-Gatineau (Ontario part) | 219,705 | 22.6 |
| Guelph | 30,885 | 20.6 |
| London | 94,690 | 19.5 |
| Oshawa | 67,570 | 18.0 |
| St. Catherines-Niagara | 67,190 | 16.9 |
| Other CMAs | 98,290 | 10.0 |
| Outside CMA | 198,090 | 8.1 |
| Source: Statistics Canada, Census of Population, 2016. | ||

Description for Map 1 - Number and proportion of immigrants in Ontario, by census subdivision, 2016
| Geography | Immigrants | Weight |
|---|---|---|
| Pickering | 31,155 | 34.2 |
| Ajax | 46,340 | 38.9 |
| Uxbridge | 2,665 | 12.7 |
| Vaughan | 140,960 | 46.3 |
| Markham | 192,220 | 58.7 |
| Richmond Hill | 111,225 | 57.4 |
| Whitchurch-Stouffville | 14,740 | 32.5 |
| Aurora | 16,510 | 30.2 |
| Newmarket | 23,235 | 28.1 |
| King | 5,985 | 24.6 |
| East Gwillimbury | 4,335 | 18.5 |
| Georgina | 6,010 | 13.4 |
| Chippewas of Georgina Island First Nation | 0 | 0.0 |
| Toronto | 1,266,000 | 47.0 |
| Mississauga | 381,730 | 53.4 |
| Brampton | 308,790 | 52.3 |
| Caledon | 16,310 | 24.6 |
| Mono | 1,660 | 19.4 |
| Orangeville | 3,510 | 12.4 |
| Oakville | 68,850 | 35.9 |
| Milton | 39,105 | 35.9 |
| Halton Hills | 9,745 | 16.2 |
| New Tecumseth | 4,835 | 14.3 |
| Bradford West Gwillimbury | 9,625 | 27.5 |
Source of countries for immigration in Ontario have changed a lot over time

Description for Chart 3 - Region of birth of recent immigrants in Ontario, 1971 to 2016
| 1971 | 1981 | 1991 | 2001 | 2011 | 2016 | |
|---|---|---|---|---|---|---|
| Oceania and others | 2.6 | 1.1 | 0.4 | 0.3 | 0.4 | 0.4 |
| Asia (including Middle East) | 10.5 | 35.8 | 46.5 | 61.0 | 63.1 | 68.8 |
| Africa | 2.0 | 4.8 | 6.7 | 6.3 | 8.2 | 8.3 |
| Caribbean, Bermuda, Central America, and South America | 10.9 | 17.7 | 17.7 | 9.7 | 12.3 | 9.8 |
| United States | 7.5 | 6.4 | 2.9 | 2.7 | 4.1 | 3.1 |
| Europe | 66.5 | 34.2 | 25.8 | 20.0 | 12.0 | 9.6 |
| Note: "Recent immigrants" are immigrants who received landed immigrant or permanent resident status in Canada for the first time in the five years preceding a given census. | ||||||
| Sources: Statistics Canada, Census of Population, 1971 to 2006, 2016; National Household Survey, 2011. | ||||||
Top country of birth reported by recent immigrants in Ontario, 2016
- India 69,330
- China 58,840
- Philippines 53,185
- Pakistan 25,435
- Iran 21,230
The share of immigrants from certain parts of the world could continue to grow, while those from earlier waves of immigration could continue to decline
2016
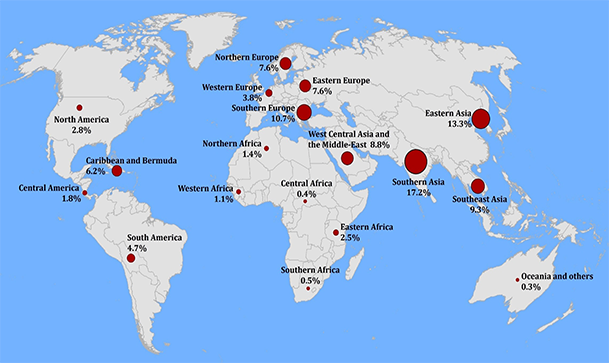
Description for Map 2 - Distribution (as a percentage) of immigrants living in Ontario, by region of birth, 2016
| Percentage | |
|---|---|
| North America | 2.8 |
| Caribbean and Bermuda | 6.2 |
| Central America | 1.8 |
| South America | 4.7 |
| Northern Europe | 7.6 |
| Western Europe | 3.8 |
| Southern Europe | 10.7 |
| Eastern Europe | 7.6 |
| Northern Africa | 1.4 |
| Western Africa | 1.1 |
| Central Africa | 0.4 |
| Southern Africa | 0.5 |
| Eastern Africa | 2.5 |
| West Central Asia and Middle East | 8.8 |
| Southern Asia | 17.2 |
| Eastern Asia | 13.3 |
| Southeast Asia | 9.3 |
| Oceania and others | 0.3 |
| Source: Statistics Canada, Census of Population, 2016. | |
2036 - Projected
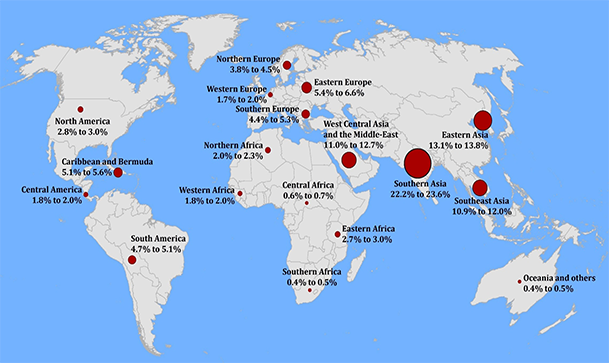
Description for Map 3 - Distribution (as a percentage) of immigrants living in Ontario, by region of birth, 2036 - Projected
| Percentage | |
|---|---|
| North America | 2.8 to 3.0 |
| Caribbean and Bermuda | 5.1 to 5.6 |
| Central America | 1.8 to 2.0 |
| South America | 4.7 to 5.1 |
| Northern Europe | 3.8 to 4.5 |
| Western Europe | 1.7 to 2.0 |
| Southern Europe | 4.4 to 5.3 |
| Eastern Europe | 5.4 to 6.6 |
| Northern Africa | 2.0 to 2.3 |
| Western Africa | 1.8 to 2.0 |
| Central Africa | 0.6 to 0.7 |
| Southern Africa | 0.4 to 0.5 |
| Eastern Africa | 2.7 to 3.0 |
| West Central Asia and Middle East | 11.0 to 12.7 |
| Southern Asia | 22.2 to 23.6 |
| Eastern Asia | 13.1 to 13.8 |
| Southeast Asia | 10.9 to 12.0 |
| Oceania and others | 0.4 to 0.5 |
| Source: Statistics Canada, Immigration and Diversity: Population Projections for Canada and its Regions, 2011 and 2036, Statistics Canada Catalogue no. 91-551. (Based on six scenarios). | |
Although the diversity of the Ontario population has primarily been driven by various waves of international immigration, the population of people born in Canada to at least one immigrant parent is growing.

Description for Chart 4 - Proportion of immigrants and second-generation individuals in Ontario, 2016 (census) and 2036 (projected based on six scenarios)
| 2016 | 2036 (projected) | |
|---|---|---|
| Immigrants | 29.1 | 33.0 |
| Second generation | 23.0 | 24.5 |
| Source: Statistics Canada, Census of Population, 2016; Immigration and Diversity: Population Projections for Canada and its Regions, 2011 and 2036, Statistics Canada Catalogue no. 91-551. | ||
In the Toronto CMA, immigrants and second generation individuals represented 75% of the population in 2016.
This proportion could rise to between 77% and 81% by 2036.
Linguistic diversity in Toronto: more than 160 languages1
Mother tongue of the Toronto population (CMA)
- 55.5% English
- 1.2% French
- 42.9% Other language only
- 0.4% English-French
Mother tongue of immigrants in Toronto (CMA)
- 26.0% English
- 0.8% French
- 73.0% Other language only
- 0.2% English-French
1Including Indigenous and immigrant languages.
Source: Statistics Canada, Census of Population, 2016.
Relative proportion of the Toronto CMA population who reported a language other than English or French as their mother tongue, 2016
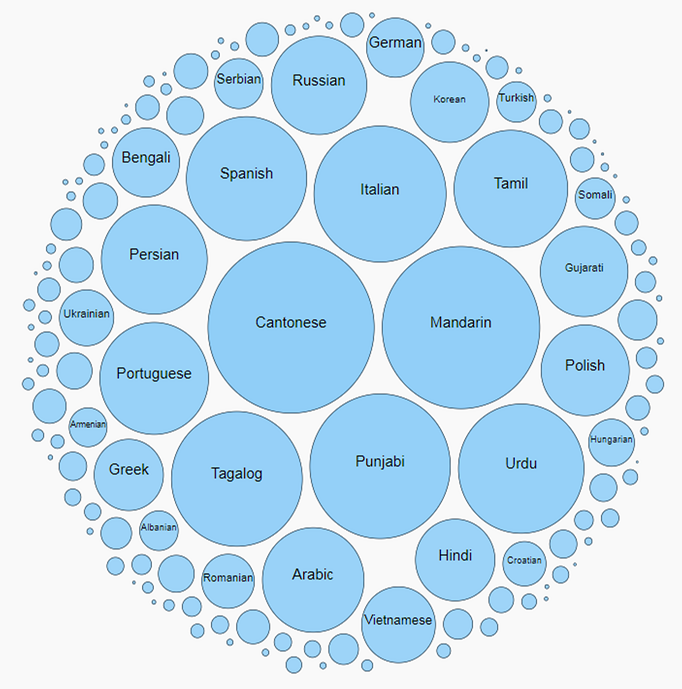
Description for Figure 2 - Relative proportion of the Toronto CMA population who reported a language other than English or French as their mother tongue, 2016
| Total number of people | Percentage in category | Percentage of the total population | |
|---|---|---|---|
| Total | 5,883,670 | ||
| Immigrant languages | 2,738,800 | 46.5 | |
| Cantonese | 260,355 | 9.5 | 4.4 |
| Mandarin | 233,885 | 8.5 | 4.0 |
| Punjabi (Panjabi) | 186,030 | 6.8 | 3.2 |
| Italian | 164,510 | 6.0 | 2.8 |
| Tagalog (Pilipino, Filipino) | 161,510 | 5.9 | 2.7 |
| Urdu | 148,630 | 5.4 | 2.5 |
| Spanish | 136,460 | 5.0 | 2.3 |
| Tamil | 121,785 | 4.4 | 2.1 |
| Portuguese | 111,445 | 4.1 | 1.9 |
| Persian (Farsi) | 105,815 | 3.9 | 1.8 |
| Arabic | 97,320 | 3.6 | 1.7 |
| Russian | 85,945 | 3.1 | 1.5 |
| Polish | 73,315 | 2.7 | 1.2 |
| Gujarati | 72,315 | 2.6 | 1.2 |
| Hindi | 59,475 | 2.2 | 1.0 |
| Korean | 57,590 | 2.1 | 1.0 |
| Vietnamese | 51,240 | 1.9 | 0.9 |
| Greek | 45,215 | 1.7 | 0.8 |
| Bengali | 42,465 | 1.6 | 0.7 |
| German | 31,230 | 1.1 | 0.5 |
| Ukrainian | 27,875 | 1.0 | 0.5 |
| Romanian | 26,040 | 1.0 | 0.4 |
| Serbian | 22,365 | 0.8 | 0.4 |
| Hungarian | 19,800 | 0.7 | 0.3 |
| Croatian | 17,555 | 0.6 | 0.3 |
| Somali | 14,955 | 0.5 | 0.3 |
| Turkish | 14,545 | 0.5 | 0.2 |
| Malayalam | 14,280 | 0.5 | 0.2 |
| Albanian | 14,015 | 0.5 | 0.2 |
| Armenian | 13,510 | 0.5 | 0.2 |
| Macedonian | 12,865 | 0.5 | 0.2 |
| Min Nan (Chaochow, Teochow, Fukien, Taiwanese) | 12,150 | 0.4 | 0.2 |
| Chinese, n.o.s. | 11,800 | 0.4 | 0.2 |
| Hebrew | 11,345 | 0.4 | 0.2 |
| Assyrian Neo-Aramaic | 11,000 | 0.4 | 0.2 |
| Telugu | 10,885 | 0.4 | 0.2 |
| Japanese | 10,430 | 0.4 | 0.2 |
| Ilocano | 10,265 | 0.4 | 0.2 |
| Akan (Twi) | 10,115 | 0.4 | 0.2 |
| Dutch | 9,070 | 0.3 | 0.2 |
| Sinhala (Sinhalese) | 8,865 | 0.3 | 0.2 |
| Pashto | 8,360 | 0.3 | 0.1 |
| Amharic | 8,035 | 0.3 | 0.1 |
| Bulgarian | 7,220 | 0.3 | 0.1 |
| Hakka | 7,020 | 0.3 | 0.1 |
| Sindhi | 6,815 | 0.2 | 0.1 |
| Cebuano | 5,800 | 0.2 | < 0.1 |
| Slovak | 5,440 | 0.2 | < 0.1 |
| Wu (Shanghainese) | 5,405 | 0.2 | < 0.1 |
| Marathi | 5,315 | 0.2 | < 0.1 |
| Tibetan | 5,305 | 0.2 | < 0.1 |
| Tigrigna | 5,040 | 0.2 | < 0.1 |
| Czech | 5,040 | 0.2 | < 0.1 |
| Nepali | 5,015 | 0.2 | < 0.1 |
| Creole, n.o.s. | 4,960 | 0.2 | < 0.1 |
| Malay | 4,775 | 0.2 | < 0.1 |
| Yoruba | 4,495 | 0.2 | < 0.1 |
| Maltese | 4,025 | 0.1 | < 0.1 |
| Swahili | 4,000 | 0.1 | < 0.1 |
| Slovene (Slovenian) | 3,920 | 0.1 | < 0.1 |
| Yiddish | 3,730 | 0.1 | < 0.1 |
| Niger-Congo languages, n.i.e. | 3,575 | 0.1 | < 0.1 |
| Khmer (Cambodian) | 3,395 | 0.1 | < 0.1 |
| Lithuanian | 3,305 | 0.1 | < 0.1 |
| Kurdish | 2,930 | 0.1 | < 0.1 |
| Bosnian | 2,860 | 0.1 | < 0.1 |
| Estonian | 2,815 | 0.1 | < 0.1 |
| Konkani | 2,810 | 0.1 | < 0.1 |
| Creole languages, n.i.e. | 2,805 | 0.1 | < 0.1 |
| Finnish | 2,705 | < 0.1 | < 0.1 |
| Lao | 2,530 | < 0.1 | < 0.1 |
| Hiligaynon | 2,515 | < 0.1 | < 0.1 |
| Serbo-Croatian | 2,500 | < 0.1 | < 0.1 |
| Kannada | 2,470 | < 0.1 | < 0.1 |
| Latvian | 2,345 | < 0.1 | < 0.1 |
| Indo-Iranian languages, n.i.e. | 2,075 | < 0.1 | < 0.1 |
| Igbo | 2,025 | < 0.1 | < 0.1 |
| Chaldean Neo-Aramaic | 2,000 | < 0.1 | < 0.1 |
| Thai | 1,775 | < 0.1 | < 0.1 |
| Danish | 1,665 | < 0.1 | < 0.1 |
| Azerbaijani | 1,645 | < 0.1 | < 0.1 |
| Pampangan (Kapampangan, Pampango) | 1,460 | < 0.1 | < 0.1 |
| Afrikaans | 1,280 | < 0.1 | < 0.1 |
| Edo | 1,260 | < 0.1 | < 0.1 |
| Swedish | 1,230 | < 0.1 | < 0.1 |
| Other languages, n.i.e. | 1,160 | < 0.1 | < 0.1 |
| Georgian | 1,155 | < 0.1 | < 0.1 |
| Oromo | 1,090 | < 0.1 | < 0.1 |
| Austronesian languages, n.i.e. | 1,090 | < 0.1 | < 0.1 |
| Burmese | 1,085 | < 0.1 | < 0.1 |
| Harari | 1,040 | < 0.1 | < 0.1 |
| Semitic languages, n.i.e. | 970 | < 0.1 | < 0.1 |
| Shona | 825 | < 0.1 | < 0.1 |
| Min Dong | 775 | < 0.1 | < 0.1 |
| Oriya (Odia) | 690 | < 0.1 | < 0.1 |
| Uzbek | 625 | < 0.1 | < 0.1 |
| Lingala | 605 | < 0.1 | < 0.1 |
| Ganda | 595 | < 0.1 | < 0.1 |
| Ga | 550 | < 0.1 | < 0.1 |
| Slavic languages, n.i.e. | 545 | < 0.1 | < 0.1 |
| Bikol | 510 | < 0.1 | < 0.1 |
| Pangasinan | 490 | < 0.1 | < 0.1 |
| Kinyarwanda (Rwanda) | 445 | < 0.1 | < 0.1 |
| Ewe | 435 | < 0.1 | < 0.1 |
| Rundi (Kirundi) | 430 | < 0.1 | < 0.1 |
| Turkic languages, n.i.e. | 430 | < 0.1 | < 0.1 |
| Afro-Asiatic languages, n.i.e. | 420 | < 0.1 | < 0.1 |
| Norwegian | 415 | < 0.1 | < 0.1 |
| Uyghur | 410 | < 0.1 | < 0.1 |
| Belarusan | 365 | < 0.1 | < 0.1 |
| Mongolian | 355 | < 0.1 | < 0.1 |
| Nilo-Saharan languages, n.i.e. | 350 | < 0.1 | < 0.1 |
| Tibeto-Burman languages, n.i.e. | 350 | < 0.1 | < 0.1 |
| Dravidian languages, n.i.e. | 345 | < 0.1 | < 0.1 |
| Waray-Waray | 330 | < 0.1 | < 0.1 |
| Vlaams (Flemish) | 310 | < 0.1 | < 0.1 |
| Kashmiri | 300 | < 0.1 | < 0.1 |
| Fulah (Pular, Pulaar, Fulfulde) | 285 | < 0.1 | < 0.1 |
| Karenic languages | 285 | < 0.1 | < 0.1 |
| Haitian Creole | 270 | < 0.1 | < 0.1 |
| Scottish Gaelic | 245 | < 0.1 | < 0.1 |
| Italic (Romance) languages, n.i.e. | 245 | < 0.1 | < 0.1 |
| Wolof | 225 | < 0.1 | < 0.1 |
| Celtic languages, n.i.e. | 205 | < 0.1 | < 0.1 |
| Chinese languages, n.i.e. | 195 | < 0.1 | < 0.1 |
| Welsh | 185 | < 0.1 | < 0.1 |
| Catalan | 185 | < 0.1 | < 0.1 |
| Berber languages, n.i.e. | 140 | < 0.1 | < 0.1 |
| Frisian | 140 | < 0.1 | < 0.1 |
| Kabyle | 120 | < 0.1 | < 0.1 |
| Icelandic | 90 | < 0.1 | < 0.1 |
| Bamanankan | 90 | < 0.1 | < 0.1 |
| Bilen | 80 | < 0.1 | < 0.1 |
| Cushitic languages, n.i.e. | 70 | < 0.1 | < 0.1 |
| Austro-Asiatic languages, n.i.e. | 70 | < 0.1 | < 0.1 |
| Fijian | 65 | < 0.1 | < 0.1 |
| Germanic languages, n.i.e. | 60 | < 0.1 | < 0.1 |
| Dinka | 55 | < 0.1 | < 0.1 |
| Malagasy | 45 | < 0.1 | < 0.1 |
| Hmong-Mien languages | 25 | < 0.1 | < 0.1 |
| Tai-Kadai languages, n.i.e. | 25 | < 0.1 | < 0.1 |
| Note: The category 'Total' is a total population count. The sum of the languages in this table is greater than the total population count because a person may report more than one language in the census. | |||
| Source: Statistics Canada, Census of Population, 2016. See interactive bubble chart. | |||
Growing multilingualism in the home
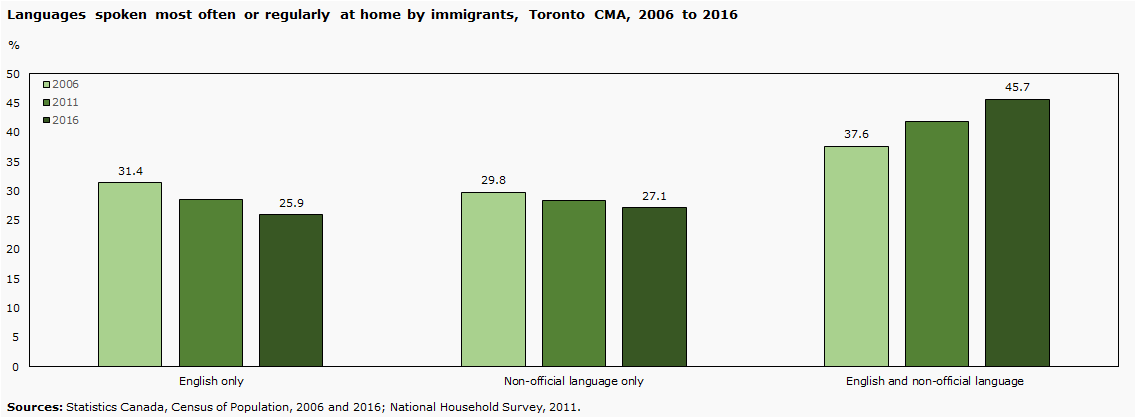
Description for Chart 5 – Languages spoken most often and regularly at home, Toronto CMA, 2006 to 2016
| English only (%) | Non-official language only (%) | English and non-official language (%) | |
|---|---|---|---|
| 2006 | 31.4 | 29.8 | 37.6 |
| 2011 | 28.5 | 28.4 | 41.9 |
| 2016 | 25.9 | 27.1 | 45.7 |
| Sources: Statistics Canada, Census of Population, 2006 and 2016; National Household Survey, 2011. | |||
In 2016, 1.4% (or 37,625) of immigrants in Toronto CMA spoke French at home (alone or in combination with other languages).
Sources: Statistics Canada, Census of Population, 2006 and 2016; National Household Survey, 2011.
More than 250 ethnic or cultural origins were reported by the population of Ontario
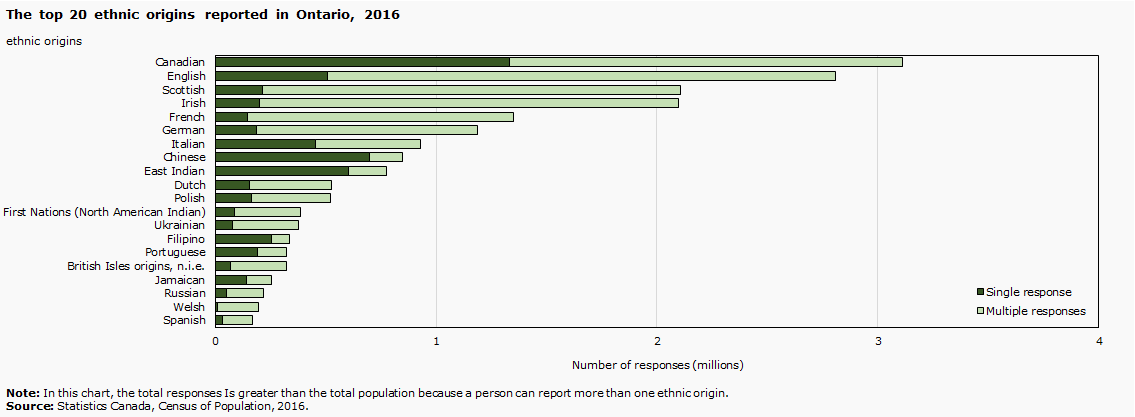
Description for Chart 6 - Top 20 ethnic origins reported in Ontario, 2016
| Single responses | Multiple responses | |
|---|---|---|
| Spanish | 32,070 | 139,075 |
| Welsh | 11,020 | 187,460 |
| Russian | 53,175 | 167,675 |
| Jamaican | 140,265 | 116,800 |
| British Isles origins, n.i.e. | 70,960 | 252,225 |
| Portuguese | 191,740 | 133,190 |
| Filipino | 255,710 | 82,050 |
| Ukrainian | 79,900 | 296,540 |
| First Nations (North American Indian) | 89,170 | 296,335 |
| Polish | 166,840 | 356,650 |
| Dutch | 155,585 | 372,165 |
| East Indian | 602,005 | 172,495 |
| Chinese | 698,420 | 150,920 |
| Italian | 453,205 | 478,605 |
| German | 186,780 | 1,002,890 |
| French | 147,055 | 1,202,205 |
| Irish | 198,930 | 1,896,535 |
| Scottish | 216,095 | 1,891,200 |
| English | 510,985 | 2,297,820 |
| Canadian | 1,330,280 | 1,779,485 |
| Note: In this chart, the total responses is greater than the total population because a person can report more than one ethnic origin. | ||
| Source: Statistics Canada, Census of Population, 2016. | ||
In 2016, 43% of the population of Ontario reported more than one origin in the census.
The share of Toronto's population who report being Catholic or Protestant may continue to decrease, while the share of those with no religious affiliation could increase…
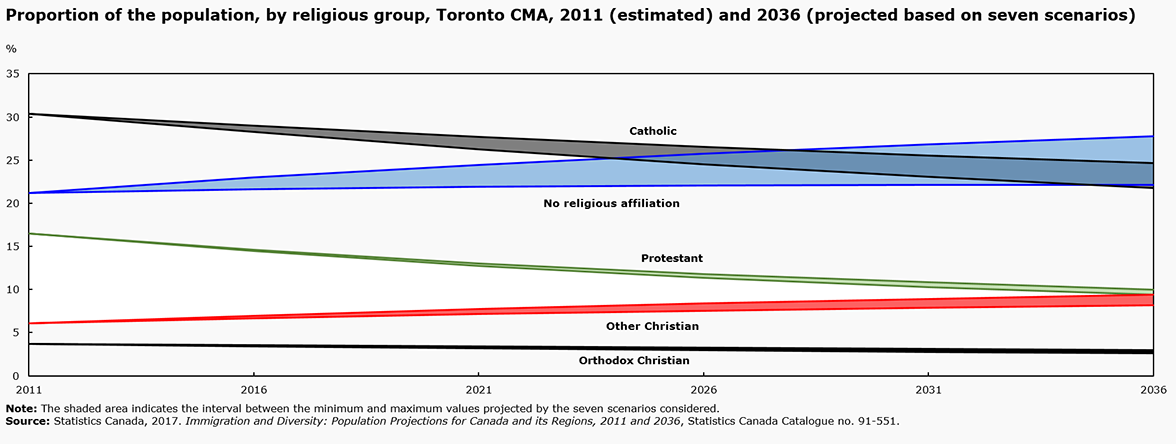
Description for Chart 7a - Proportion of the population, by religious group, Toronto CMA, 2011 (estimated) and 2036 (projected based on seven scenarios)
| 2011 | 2016 | 2021 | 2026 | 2031 | 2036 | ||
|---|---|---|---|---|---|---|---|
| No religious affiliation | Maximum | 21.2 | 23.0 | 24.4 | 25.7 | 26.8 | 27.8 |
| Minimum | 21.2 | 21.6 | 21.9 | 22.1 | 22.1 | 22.1 | |
| Catholic | Maximum | 30.4 | 29.0 | 27.7 | 26.6 | 25.6 | 24.6 |
| Minimum | 30.4 | 28.2 | 26.3 | 24.5 | 23.0 | 21.7 | |
| Protestant | Maximum | 16.5 | 14.6 | 13.0 | 11.8 | 10.8 | 10.0 |
| Minimum | 16.5 | 14.5 | 12.7 | 11.4 | 10.3 | 9.4 | |
| Orthodox Christian | Maximum | 3.7 | 3.5 | 3.4 | 3.2 | 3.1 | 3.0 |
| Minimum | 3.7 | 3.4 | 3.2 | 3.0 | 2.8 | 2.6 | |
| Other Christian | Maximum | 6.0 | 7.0 | 7.7 | 8.4 | 8.9 | 9.4 |
| Minimum | 6.0 | 6.7 | 7.1 | 7.5 | 7.9 | 8.1 | |
| Note: The shaded area indicates the interval between the minimum and maximum values projected by the seven scenarios considered. | |||||||
| Source: Statistics Canada, 2017. Immigration and Diversity: Population Projections for Canada and its Regions, 2011 and 2036, Statistics Canada Catalogue no. 91-551. | |||||||
… and the share of some non-Christian religions could increase
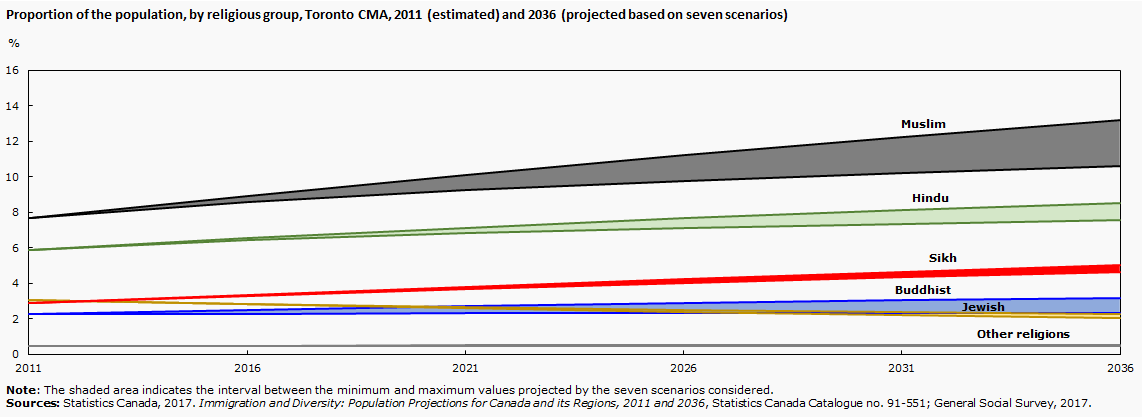
Description for Chart 7b - Proportion of the population, by religious group, Toronto CMA, 2011 (estimated) and 2036 (projected based on seven scenarios)
| 2011 | 2016 | 2021 | 2026 | 2031 | 2036 | ||
|---|---|---|---|---|---|---|---|
| Buddhist | Maximum | 2.2 | 2.5 | 2.7 | 2.9 | 3.1 | 3.2 |
| Minimum | 2.2 | 2.3 | 2.3 | 2.3 | 2.3 | 2.3 | |
| Hindu | Maximum | 5.9 | 6.5 | 7.1 | 7.7 | 8.1 | 8.5 |
| Minimum | 5.9 | 6.4 | 6.8 | 7.1 | 7.3 | 7.6 | |
| Jewish | Maximum | 3.0 | 2.8 | 2.7 | 2.5 | 2.4 | 2.2 |
| Minimum | 3.0 | 2.8 | 2.6 | 2.4 | 2.2 | 2.1 | |
| Muslim | Maximum | 7.7 | 8.9 | 10.1 | 11.2 | 12.2 | 13.2 |
| Minimum | 7.7 | 8.6 | 9.3 | 9.8 | 10.2 | 10.6 | |
| Sikh | Maximum | 2.9 | 3.3 | 3.8 | 4.3 | 4.7 | 5.0 |
| Minimum | 2.9 | 3.3 | 3.7 | 4.0 | 4.3 | 4.6 | |
| Other religions | Maximum | 0.5 | 0.5 | 0.5 | 0.5 | 0.5 | 0.5 |
| Minimum | 0.5 | 0.5 | 0.5 | 0.5 | 0.5 | 0.5 | |
| Note: The shaded area indicates the interval between the minimum and maximum values projected by the seven scenarios considered. | |||||||
| Source: Statistics Canada, 2011 National Household Survey (adjusted) and Demosim 2017. | |||||||
In 2017, 55% of Toronto's population who reported a religious affiliation attended religious ceremonies at least 3 times a year.
In Ontario, the three largest visible minority groups as defined under the Employment Equity Act are South Asian, Chinese and Black.
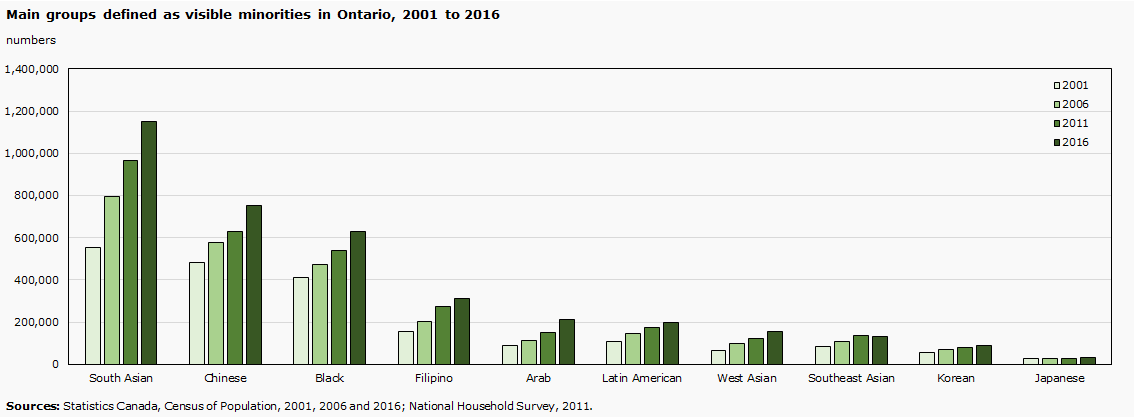
Description for Chart 8 - Main groups defined as visible minorities in Ontario, 2001 to 2016
| 2001 | 2006 | 2011 | 2016 | |
|---|---|---|---|---|
| South Asian | 554,870 | 794,170 | 965,990 | 1,150,415 |
| Chinese | 481,505 | 576,980 | 629,140 | 754,545 |
| Black | 411,095 | 473,760 | 539,205 | 627,715 |
| Filipino | 156,515 | 203,220 | 275,380 | 311,675 |
| Arab | 88,540 | 111,405 | 151,645 | 210,440 |
| Latin American | 106,835 | 147,135 | 172,560 | 195,950 |
| West Asian | 67,100 | 96,615 | 122,530 | 154,670 |
| Southeast Asian | 86,410 | 110,045 | 137,875 | 133,860 |
| Korean | 53,955 | 69,540 | 78,295 | 88,935 |
| Japanese | 24,925 | 28,080 | 29,085 | 30,830 |
| Source: Statistics Canada, Census of Population, 2001, 2006 and 2016; National Household Survey, 2011. | ||||
Inclusion and equity: Challenges and issues
Context of admission and living arrangements among recent immigrants in Toronto
Three broad admission categories for recent immigrants:
- Economic immigrants (54%)
- Immigrants sponsored by family (32%)
- Refugees (13%)
- Other immigrants (2%)
| Living arrangements in the household | Non-Immigrants (%) | Recent Immigrants (%) |
|---|---|---|
| In a couple without children | 12.4 | 10.6 |
| In a couple with children | 48.3 | 46.9 |
| In a lone-parent family | 10.9 | 5.8 |
| Persons in multigenerational households | 9.6 | 14.1 |
| Living with others (relatives or non-relatives) | 9.7 | 18.7 |
| Living alone | 9.0 | 3.9 |
| Note: "Recent immigrants" are immigrants who received landed immigrant status or permanent resident status in Canada for the first time in the five years preceding the Census year. | ||
| Source: Statistics Canada, Census of Population, 2016. | ||
Between 2006 and 2017, about 3 in 10 immigrants who intended to live in the CMA of Toronto were not able to conduct a conversation in English or French at the time of their admission in the country.
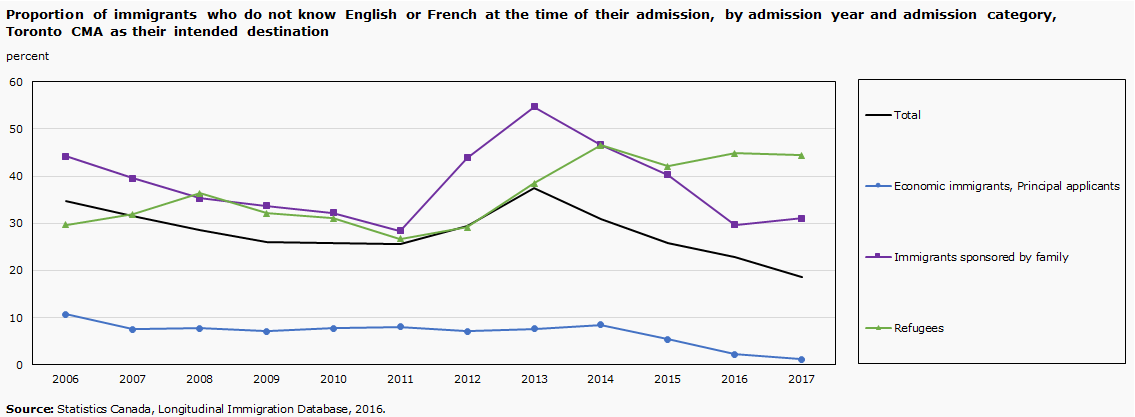
Description for Chart 9 - Proportion of immigrants who do not know English or French at the time of their admission, by admission year, Toronto CMA as their intended destination
| Total | Economic immigrants, Principal applicants | Immigrants sponsored by family | Refugees | |
|---|---|---|---|---|
| 2006 | 34.7 | 10.7 | 44.2 | 29.7 |
| 2007 | 31.6 | 7.5 | 39.5 | 31.9 |
| 2008 | 28.5 | 7.8 | 35.3 | 36.4 |
| 2009 | 26.0 | 7.1 | 33.7 | 32.1 |
| 2010 | 25.8 | 7.8 | 32.2 | 31.1 |
| 2011 | 25.7 | 8.1 | 28.4 | 26.7 |
| 2012 | 29.5 | 7.1 | 43.9 | 29.2 |
| 2013 | 37.4 | 7.7 | 54.7 | 38.5 |
| 2014 | 30.9 | 8.5 | 46.6 | 46.5 |
| 2015 | 25.9 | 5.4 | 40.3 | 42.1 |
| 2016 | 22.8 | 2.3 | 29.7 | 44.8 |
| 2017 | 18.7 | 1.2 | 31.1 | 44.4 |
| Source: Statistics Canada, Longitudinal Immigration Database, 2016. | ||||
In 2016, 29% of Toronto's recent immigrants with a mother tongue other than English or French used a non-official language at work.
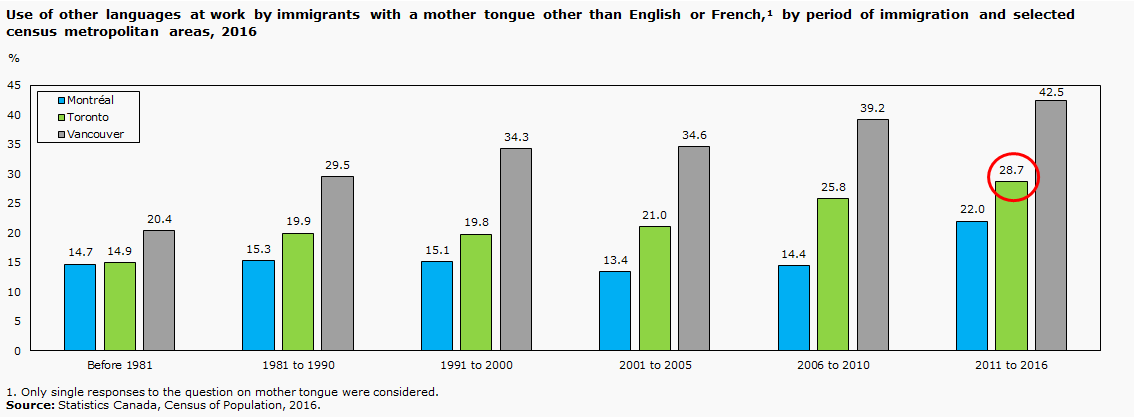
Description for Chart 10 - Use of other languages at work by immigrants with a mother tongue other than English or French, by period of immigration and selected census metropolitan areas, 2016
| Before 1981 (%) | 1981 to 1990 (%) | 1991 to 2000 (%) | 2001 to 2005 (%) | 2006 to 2010 (%) | 2011 to 2016 (%) | |
|---|---|---|---|---|---|---|
| Montréal | 14.7 | 15.3 | 15.1 | 13.4 | 14.4 | 22.0 |
| Toronto | 14.9 | 19.9 | 19.8 | 21.0 | 25.8 | 28.7 |
| Vancouver | 20.4 | 29.5 | 34.3 | 34.6 | 39.2 | 42.5 |
| 1 Only single responses to the question on mother tongue were considered. | ||||||
| Source: Statistics Canada, Census of Population, 2006 and 2016. | ||||||
In Toronto, the employment rate for immigrant men is now similar to that of Canadian-born men, but a gap persists for immigrant women.
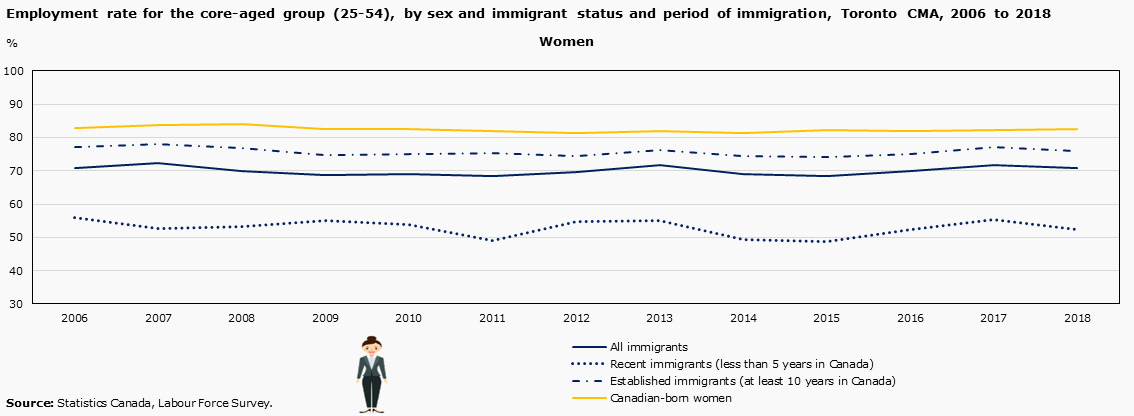
Description for Chart 11a - Employment rate for the core-aged group women (25 to 54), immigrant status and immigration period, Toronto CMA, 2006 to 2018
| All immigrants | Recent immigrants (less than 5 years in Canada) | Established immigrants (at least 10 years in Canada) | Canadian-born women | |
|---|---|---|---|---|
| 2006 | 70.7 | 56.0 | 77.2 | 83.0 |
| 2007 | 72.2 | 52.6 | 78.1 | 83.9 |
| 2008 | 70.0 | 53.3 | 76.7 | 84.1 |
| 2009 | 68.8 | 55.0 | 74.7 | 82.5 |
| 2010 | 69.0 | 53.9 | 75.0 | 82.7 |
| 2011 | 68.5 | 49.2 | 75.2 | 81.9 |
| 2012 | 69.5 | 54.7 | 74.5 | 81.4 |
| 2013 | 71.6 | 55.0 | 76.3 | 81.8 |
| 2014 | 68.9 | 49.5 | 74.3 | 81.3 |
| 2015 | 68.4 | 48.9 | 74.0 | 82.2 |
| 2016 | 70.0 | 52.5 | 74.9 | 81.9 |
| 2017 | 71.7 | 55.4 | 77.1 | 82.3 |
| 2018 | 70.9 | 52.3 | 75.8 | 82.4 |
| Source: Statistics Canada, Labour Force Survey. | ||||

Description for Chart 11b - Employment rate for the core-aged group men (25 to 54), immigrant status and immigration period, Toronto CMA, 2006 to 2018
| All immigrants | Recent immigrants (less than 5 years in Canada) | Established immigrants (at least 10 years in Canada) | Canadian-born men | |
|---|---|---|---|---|
| 2006 | 87.1 | 81.5 | 88.2 | 88.3 |
| 2007 | 85.6 | 80.8 | 87.1 | 88.4 |
| 2008 | 85.8 | 83.7 | 86.6 | 89.9 |
| 2009 | 81.2 | 76.2 | 82.8 | 86.4 |
| 2010 | 82.1 | 74.2 | 83.2 | 86.7 |
| 2011 | 82.6 | 73.4 | 83.7 | 85.9 |
| 2012 | 84.2 | 77.7 | 85.2 | 84.7 |
| 2013 | 83.9 | 77.8 | 84.8 | 87.2 |
| 2014 | 83.6 | 77.3 | 84.5 | 86.9 |
| 2015 | 86.8 | 79.2 | 88.1 | 86.6 |
| 2016 | 86.3 | 80.5 | 87.6 | 87.6 |
| 2017 | 86.6 | 81.9 | 87.7 | 86.9 |
| 2018 | 87.0 | 85.6 | 87.4 | 86.1 |
| Source: Statistics Canada, Labour Force Survey. | ||||
The unemployment rate of immigrants is higher than for the Canadian-born. These gaps narrow when isolating the influence of key social and ethnocultural characteristics.
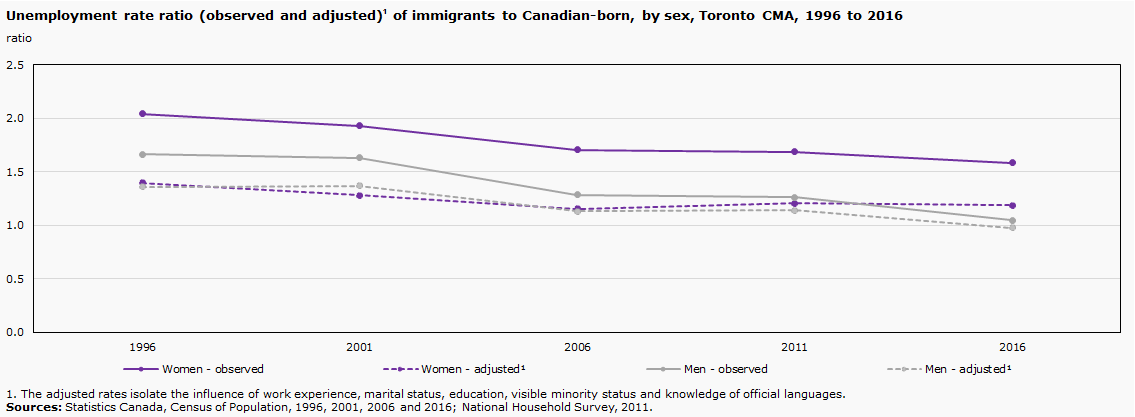
Description for Chart 12 - Unemployment rate ratio (observed and adjusted) of immigrants to Canadian-born, by sex, Toronto CMA, 1996 to 2016
| Women - observed | Women - adjusted1 | Men - observed | Men - adjusted1 | |
|---|---|---|---|---|
| 1996 | 2.0 | 1.4 | 1.7 | 1.4 |
| 2001 | 1.9 | 1.3 | 1.6 | 1.4 |
| 2006 | 1.7 | 1.2 | 1.3 | 1.1 |
| 2011 | 1.7 | 1.2 | 1.3 | 1.1 |
| 2016 | 1.6 | 1.2 | 1.0 | 1.0 |
| 1 The adjusted rates isolate the influence of work experience, marital status, education, visible minority status and knowledge of official languages. | ||||
| Sources: Statistics Canada, Census of Population, 1996, 2001, 2006 and 2016; National Household Survey, 2011. | ||||
| Women | Men | |||
|---|---|---|---|---|
| Non-immigrants | Immigrants | Non-immigrants | Immigrants | |
| 1996 | 5.7 | 11.6 | 5.1 | 8.6 |
| 2001 | 3.8 | 7.3 | 3.2 | 5.2 |
| 2006 | 4.6 | 7.8 | 3.9 | 5.0 |
| 2011 | 5.5 | 9.3 | 5.3 | 6.6 |
| 2016 | 5.1 | 8.1 | 5.4 | 5.6 |
| Sources: Statistics Canada, Census of Population, 1996, 2001, 2006 and 2016; National Household Survey, 2011. | ||||
Among women and men, the gap between the annual median salaries of immigrants and the Canadian-born is mostly due to a range of ethnocultural and socioeconomic characteristics and work experience
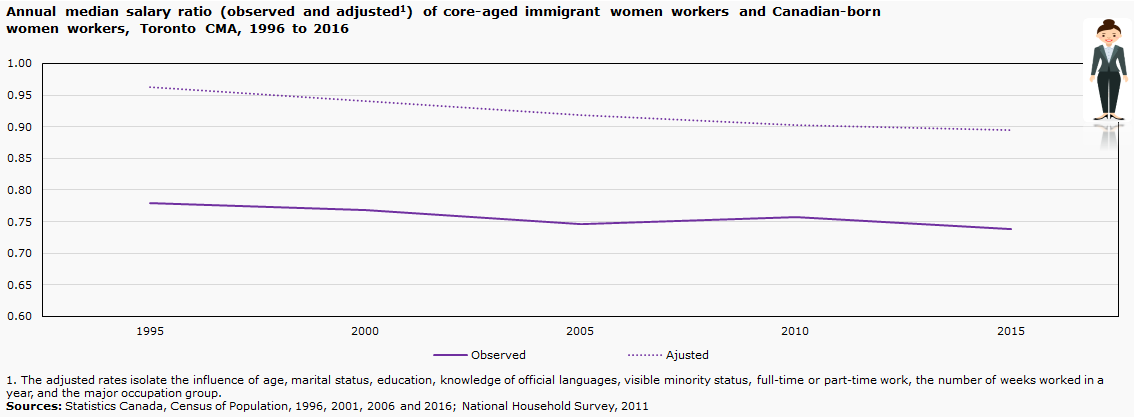
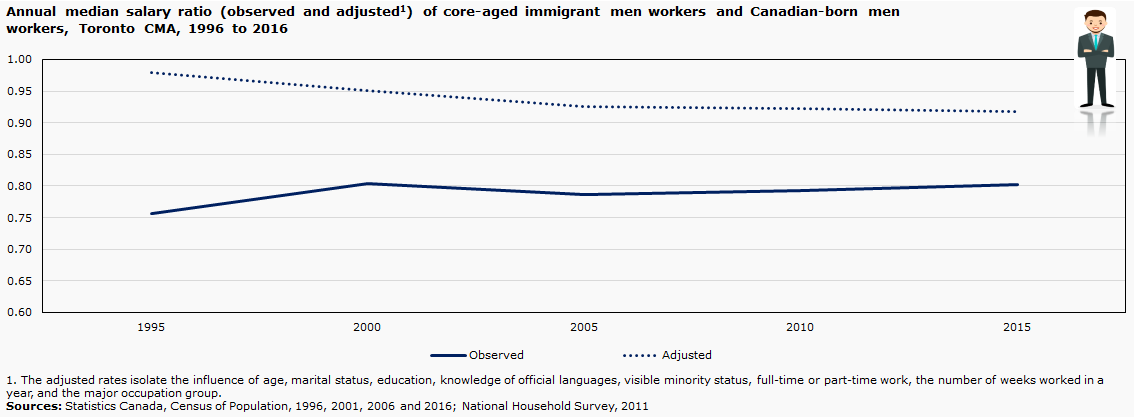
Description for Chart 13 and 14 - Annual median salary ratio (observed and adjusted1) of core-aged immigrant men and women workers and Canadian-born workers, Toronto CMA, 1996 to 2016
| Women | Men | |||
|---|---|---|---|---|
| Observed | Adjusted1 | Observed | Adjusted1 | |
| 1995 | 0.78 | 0.96 | 0.76 | 0.98 |
| 2000 | 0.77 | 0.94 | 0.80 | 0.95 |
| 2005 | 0.75 | 0.92 | 0.79 | 0.93 |
| 2010 | 0.76 | 0.90 | 0.79 | 0.92 |
| 2015 | 0.74 | 0.89 | 0.80 | 0.92 |
| 1 The adjusted rates isolate the influence of age, marital status, education, knowledge of official languages, visible minority status, full-time or part-time work, the number of weeks worked in a year, and the major occupation group. | ||||
| Sources: Statistics Canada, Census of Population, 1996, 2001, 2006 and 2016; National Household Survey, 2011. | ||||
Median wages of immigrants rise with the number of years since admission to Canada.
Statistics Canada, Longitudinal Immigration Database, 2016
The proportion of immigrants in a low-income situation is much higher than the proportion of Canadian-born.

Description for Chart 15 - Proportion of the population aged 25 to 54 years who were in a low-income situation based on the Market Basket Measure (MBM), by immigrant status, Toronto CMA, 2015
| Non-immigrants | Immigrants | |
|---|---|---|
| 10.2 | 19.7 | |
| Source: Statistics Canada, Census of Population, 2016; National Household Survey, 2011. | ||
The proportion of immigrants who earned a university degree outside Canada and the United States and who have a job that requires a high school diploma or less is much higher than the proportion of Canadian-born.


Description for Chart 16 and 17 - Overqualification rate among workers aged 25 years and over with university diploma, by field of study and immigrant status, CMA of Toronto, 2016
| Women | Men | |||
|---|---|---|---|---|
| Field of study | Canadian-Born | Immigrant with university degree from outside of Canada and the US | Canadian-Born | Immigrant with university degree from outside of Canada and the US |
| Science and science technology | 12.9 | 31.7 | 12.0 | 27.8 |
| Engineering and engineering technology | 5.1 | 23.9 | 4.4 | 21.2 |
| Mathematics and computer and information science | 8.1 | 24.5 | 6.0 | 13.9 |
| Business and administration | 11.0 | 40.5 | 9.8 | 30.4 |
| Arts and humanities | 16.2 | 43.1 | 16.2 | 42.0 |
| Social and behavioural sciences | 15.8 | 39.1 | 15.0 | 37.7 |
| Legal professions and studies | 4.9 | 27.0 | 3.0 | 33.0 |
| Health care | 5.0 | 30.3 | 4.2 | 25.7 |
| Education and teaching | 5.2 | 43.5 | 5.6 | 36.9 |
| Trades, services, natural resources and conservation | 9.7 | 32.3 | 10.2 | 33.5 |
| Source: Statistics Canada, Census of Population, 2016. | ||||
Housing conditions for immigrants residing in Toronto CMA in 2016
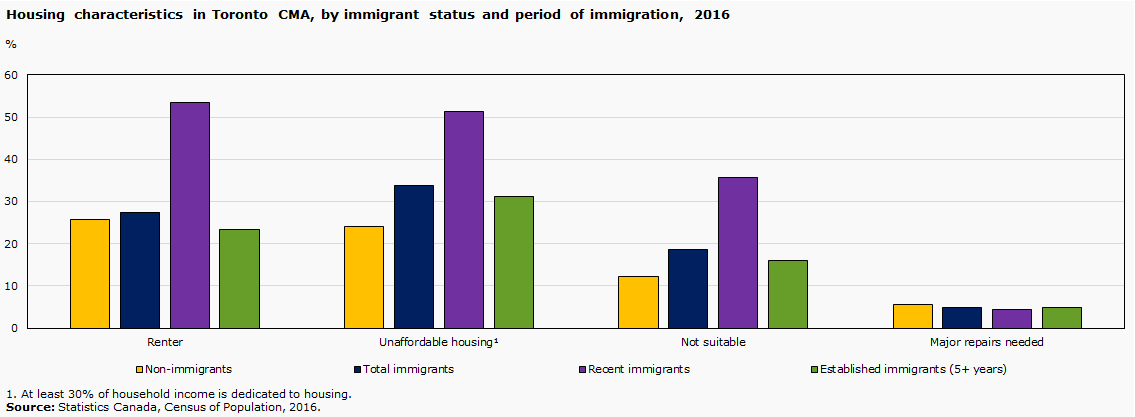
Description for Chart 18 - Housing characteristics in Toronto CMA, by immigrant status, 2016
| Non-immigrants (%) | Total immigrants (%) | Recent immigrants (%) | Established immigrants (5+ years) (%) | |
|---|---|---|---|---|
| Renter | 25.7 | 27.3 | 53.5 | 23.3 |
| Unaffordable housing1 | 24.1 | 33.8 | 51.2 | 31.1 |
| Not suitable | 12.2 | 18.6 | 35.7 | 16.0 |
| Major repairs needed | 5.7 | 4.8 | 4.5 | 4.9 |
| 1 At least 30% of household income is dedicated to housing. | ||||
| Source: Statistics Canada, Census of Population, 2016. | ||||
In Toronto, 1 in 6 immigrants reported experiencing discrimination or being treated unfairly in the last five years
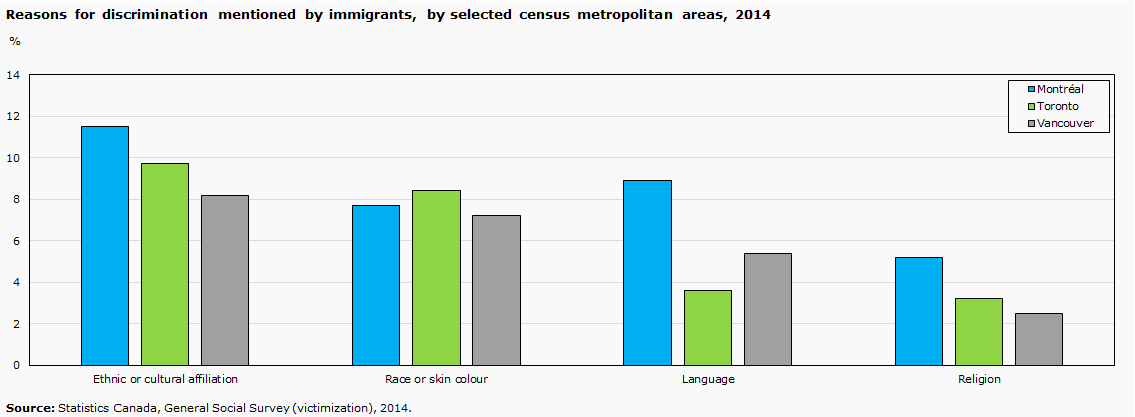
Description for Chart 19 - Reasons for discrimination mentioned by immigrants, by selected census metropolitan areas, 2014
| Montréal (%) | Toronto (%) | Vancouver (%) | |
|---|---|---|---|
| Ethnic or cultural affiliation | 11.5 | 9.7 | 8.2 |
| Race or skin colour | 7.7 | 8.4 | 7.2 |
| Language | 8.9 | 3.6 | 5.4 |
| Religion | 5.2 | 3.2 | 2.5 |
| Source: Statistics Canada, General Social Survey (victimization), 2014. | |||
| Toronto CMA | Immigrants | Second generation |
|---|---|---|
| Total | 16% | 19% |
| Ethnic or cultural affiliation | 10% | 8% |
| Race or skin colour | 8% | 10% |
| Source: Statistic Canada, General Social Survey (victimization), 2014. | ||
The number of police-reported hate crimes—particularly crimes motivated by hatred of religion, race or ethnic origin—has been on the rise since 2014
| 2014 | 2015 | 2016 | 2017 | |
|---|---|---|---|---|
| Number of police-reported hate crimes in Toronto CMA | 318 | 295 | 290 | 519 |

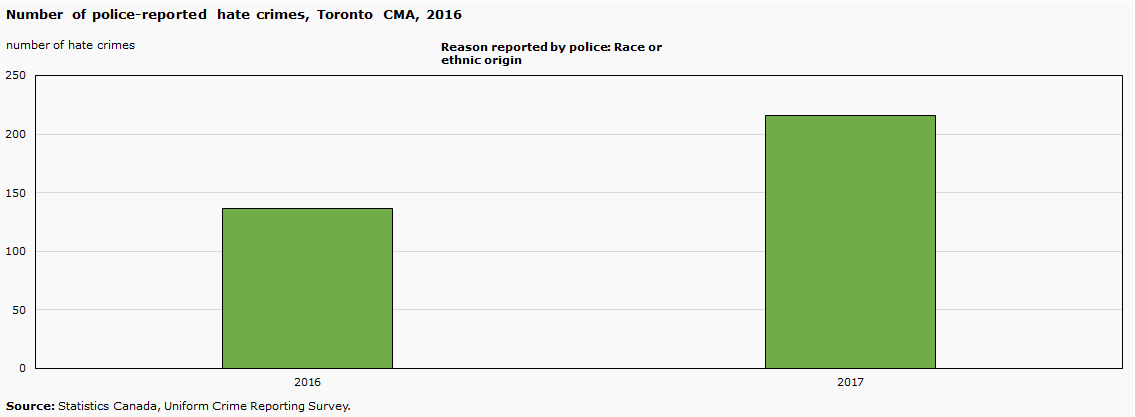
Description for Charts 22 and 23 - Number of police-reported hate crimes, Toronto CMA, 2016
| Reason | 2016 | 2017 |
|---|---|---|
| Religion | 107 | 238 |
| Race or ethnic origin | 136 | 216 |
| Source: Statistics Canada, Uniform Crime Reporting Survey. | ||
Number of police-reported hate crimes in Toronto CMA
Most recent analytical publications related to immigration, ethnocultural diversity and inclusion
- Census Program
- Immigration and Ethnocultural Diversity, 2016 Census of Population
- Children with an Immigrant Background: Bridging Cultures
- Ethnic and Cultural Origins of Canadians: Portrait of a Rich Heritage
- Linguistic integration of immigrants and official language populations in Canada
- Insights on Canadian Society
- The Labour Force in Canada and its Regions: Projection to 2036
- Results from the 2016 Census: Syrian Refugees who Resettled in Canada in 2015 and 2016
- Harassment in Canadian Workplaces
- Ethnicity, Language and Immigration Thematic Series
- Study on International Money Transfer, 2017
- Diversity of the Black Population in Canada: An Overview
- Immigration and Language in Canada, 2011 and 2016
- Analytical Studies Branch Research Paper Series
- The Wealth of Immigrant Families in Canada
- Labour Market Outcomes Among Refugees to Canada
- Intergenerational Education Mobility and Labour Market Outcomes: Among the Second Generation of Immigrants in Canada
- Economic Insights
- Immigrant Ownership of Residential Properties in Toronto and Vancouver
- The Immigrant Labour Force Analysis Series
- The Canadian Immigrant Labour Market: Recent Trends from 2006 to 2017
- Health Reports
- Healthy Immigrant Effect by Immigrant Category in Canada
- Tuberculosis-related Hospital Use Among Recent Immigrants to Canada
- Hospitalisation Rates Among Economic Immigrants to Canada
- Juristat
- Violent Victimization and Discrimination, by Religious Affiliation in Canada, 2014
- Violent Victimization and Discrimination among Visible Minority Populations, Canada, 2014
- Violent Victimization, Discrimination and Perception of Safety: an Immigrant Perspective, Canada, 2014
Multiple dimensions or facets of inclusion and equity
- Education
- Equity
- Culture
- Inequality
- Income
- Vulnerable groups
- Family
- Citizenship
- Exclusion
- Justice
- Human rights
- Health
- Discrimination
- Well-being
- Work
- Volunteering
- Living together
- Civic participation
Looking to the future
Ongoing identification of data needs
Ongoing consultation on:
- Concepts, measures and indicators
- Data sources
With:
- Governmental and community partners
- Academic experts
- Data users
How to measure diversity and inclusion?
How to take into account the fluidity and complexity of identities, ethnicities and multiple background of the population?
What are the current needs and emerging issues?
Developing and collecting new data and statistics
Census of the population
- 2019 Content Test (e.g., revision of ethnocultural content, new questions)
- Replacement of questions with administrative data (immigration)
Alternative collection methods
- Data integration
- Other approaches
New dissemination strategy of data
Dissemination of new data, analytical and reference products
- Access and availability of disaggregated data products
- Personalized products and services (population or interest groups, specific themes, etc.)
Development of visualization tools
New Centre for Gender, diversity and inclusion statistics
- Date modified: