
Indigenous-owned businesses in Canada, 2018
Release date: June 21, 2023
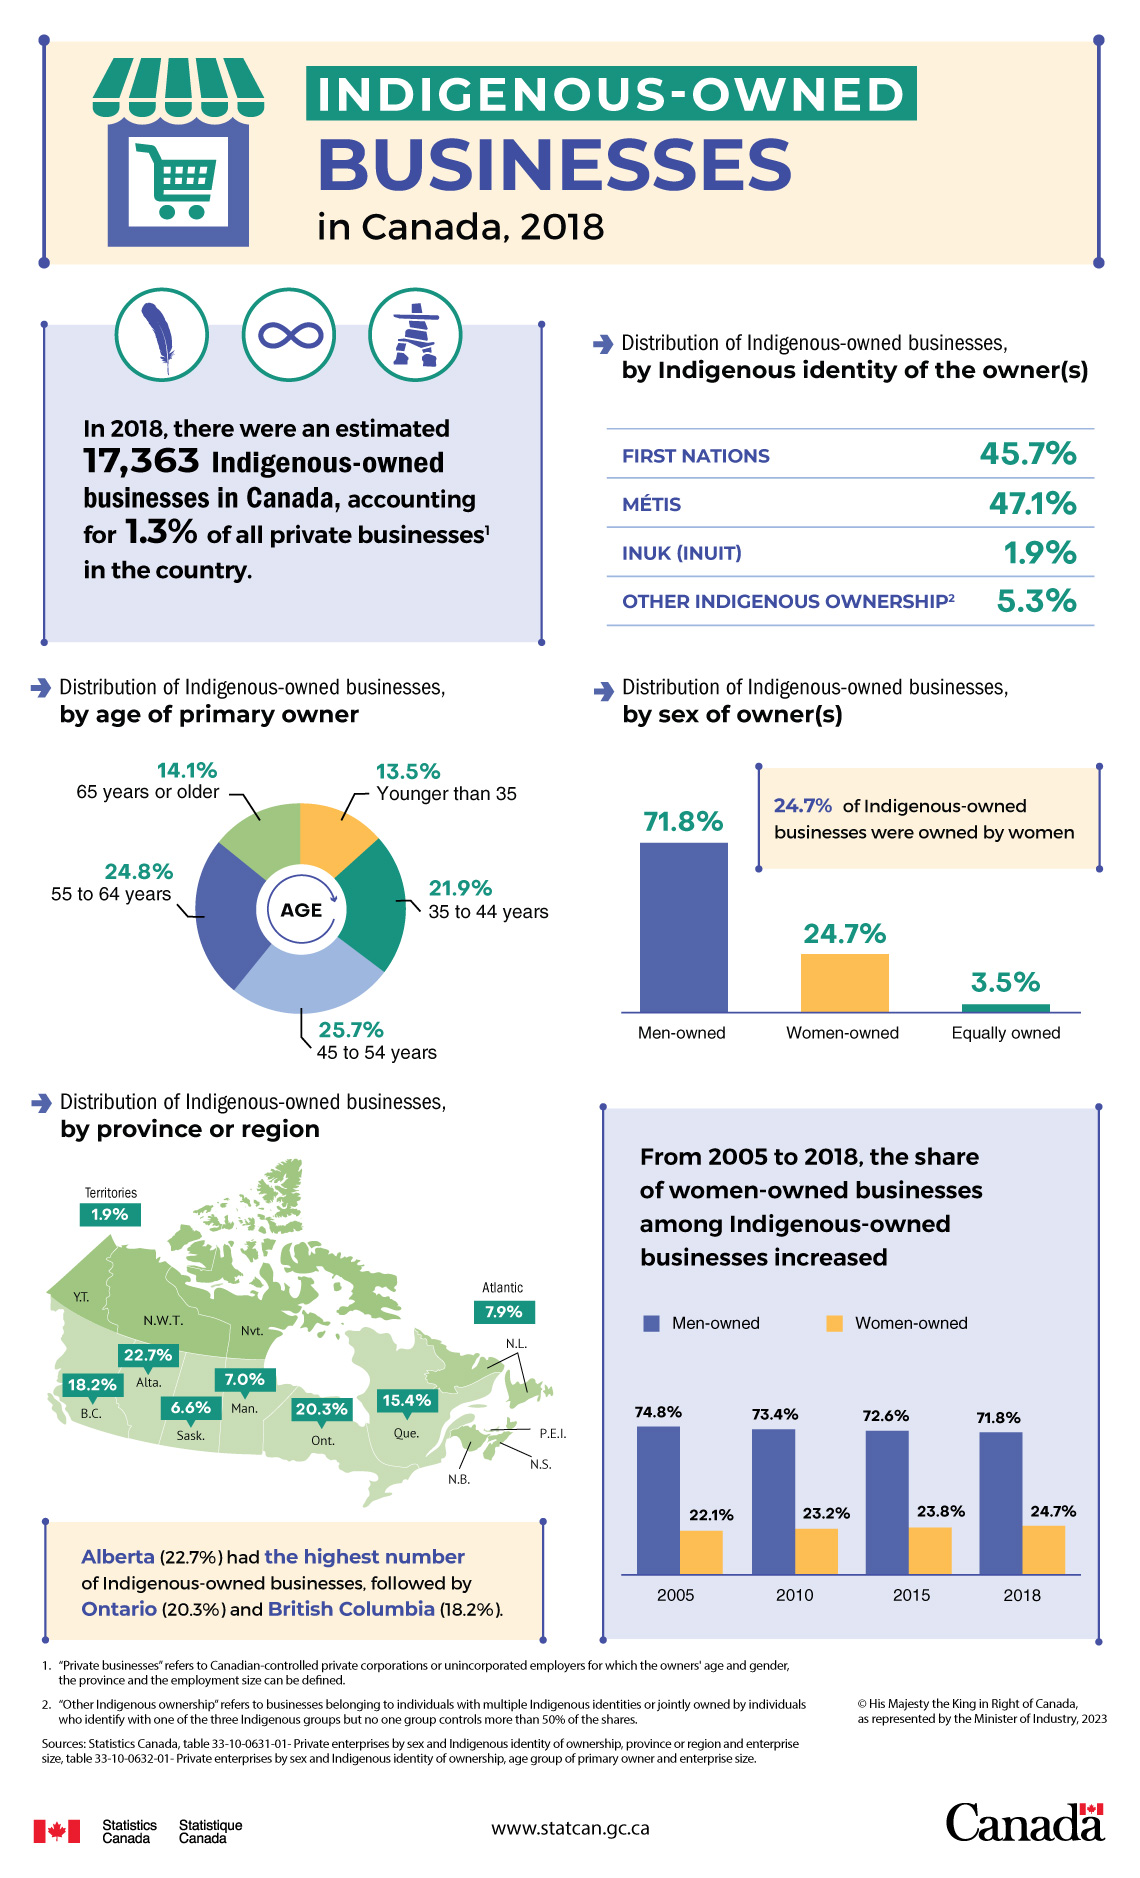
Description: Indigenous-owned businesses in Canada, 2018
In 2018, there were an estimated 17,363 Indigenous-owned businesses in Canada, accounting for 1.3% of all private businessesNote 1 in the country.
| Indigenous identity | Percent |
|---|---|
| First Nations | 45.7% |
| Métis | 47.1% |
| Inuk (Inuit) | 1.9% |
| Other Indigenous ownershipNote 2 | 5.3% |
| Age of primary owner | Percent |
|---|---|
| Younger than 35 | 13.5% |
| 35 to 44 years | 21.9% |
| 45 to 54 years | 25.7% |
| 55 to 64 years | 24.8% |
| 65 years or older | 14.1% |
| Sex of owner(s) | Percent |
|---|---|
| Men-owned | 71.8% |
| Women-owned | 24.7% |
| Equally owned | 3.5% |
24.7% of Indigenous-owned businesses were owned by women
| Province or region | Percent |
|---|---|
| Alberta | 22.7% |
| Ontario | 20.3% |
| British Columbia | 18.2% |
| Quebec | 15.4% |
| Atlantic | 7.9% |
| Manitoba | 7.0% |
| Saskatchewan | 6.6% |
| Territories | 1.9% |
Alberta (22.7%) had the highest number of Indigenous-owned businesses, followed by Ontario (20.3%) and British Columbia (18.2%).
| Men-owned | Women-owned | |
|---|---|---|
| 2005 | 74.8% | 22.1% |
| 2010 | 73.4% | 23.2% |
| 2015 | 72.6% | 23.8% |
| 2018 | 71.8% | 24.7% |
Sources: Statistics Canada, table 33-10-0631-01 - Private enterprises by sex and Indigenous identity of ownership, province or region and enterprise size, table 33-10-0632-01 - Private enterprises by sex and Indigenous identity of ownership, age group of primary owner and enterprise size.
- Date modified: