
Economic and Social Reports
Characteristics of Indigenous-owned businesses
DOI: https://doi.org/10.25318/36280001202201200004-eng
Skip to text
Text begins
In recent years, Statistics Canada has released data and analysis on business ownership by women and persons with disabilities. Furthermore, in an effort to continue to fill the information gap on business ownership by employment equity groups and better inform policy making, Statistics Canada has released, for the first time, time series on
Statistics Canada has released data on Indigenous-owned businesses in the past, but they were either recent and do not allow for analysis of trends (Canadian Survey on Business Conditions) or infrequent (Survey on Financing and Growth of Small and Medium Enterprises). Furthermore, those are surveys based on a sample that does not always allow for more granular analysis. A novel linkage of the Canadian Employer–Employee Dynamics Database (2005 to 2018) with the Census of Population (2001, 2006 and 2016) and the 2011 National Household Survey has made it possible to expand the content of the tables on business ownership by adding an indicator of Indigenous identity. These new linked data are the first to enable more disaggregated analysis of trends in Indigenous business ownership and potential microdata analysis including the intersection with other business and owner characteristics. For example, these data could be used to assess the level of participation of Indigenous-owned businesses in public policies and programs and to evaluate their impacts on these businesses over time.
Indigenous business owners and businesses are identified using a combination of administrative databases and surveys, and imputation techniques are applied to derive the aggregate statistics. Gueye, Lafrance-Cooke and Oyarzun (2022) provide detailed information on the methodology used to identify Indigenous-owned businesses. A business is considered Indigenous-owned if more than 50% of its shares are owned by Indigenous people—individuals who reported being First Nations (North American Indian), Métis or Inuk (Inuit); those who reported Registered or Treaty Indian status, registered under the Indian Act of Canada; or those who reported membership in a First Nation or Indian band.
In 2018, there were an estimated 37,000 Indigenous-owned businesses among the 2,537,000 Canadian-controlled private corporations and unincorporated businesses in Canada for which sex, Indigenous identity and age of ownership, as well as province and employment size, can be determined (Gueye, Lafrance-Cooke and Oyarzun, 2022). Similar to businesses owned by non-Indigenous individuals (66.6%), the majority of Indigenous-owned businesses (67.8%) did not have employees. Overall, 94.1% of Indigenous-owned businesses were controlled by First Nations people and Métis, who each owned about 47% of the businesses, while Inuit owned 1.6% of them. The remaining 4.3% were owned by individuals with other Indigenous identities.
Common Output Data Repository tables
The sample of the tables (33-10-0631-01 and 33-10-0632-01) released in the Common Output Data Repository (CODR) is limited to Canadian-controlled private corporations and unincorporated businesses for which sex, Indigenous identity and age of ownership, as well as province and employment size, can be determined. Businesses in the public administration industry and unincorporated businesses without employees are also excluded.
From 2005 to 2015, the number of Indigenous-owned businesses trended upward (+3.5% on average), although at a generally decreasing rate from year to year (Chart 1). Non-Indigenous-owned businesses also grew at a comparable rate over the same period (+3.3% on average). The number of Indigenous-owned businesses contracted in each of the subsequent years, whereas the number of non-Indigenous-owned businesses decreased only in 2018. With a generally comparable pace of growth between the two groups, the share of Indigenous-owned businesses remained stable between 1.3% and 1.4%.
More Indigenous-owned businesses in Alberta
From 2005 to 2018, Alberta was the province with the highest number of Indigenous-owned businesses (24.0% on average), followed by Ontario (20.1%) and British Columbia (17.4%) (CODR table 33-10-0631-01). According to the 2016 and 2021 censuses of population, these provinces also had the highest number of people who identify as Indigenous. The territoriesNote (1.9%) had the lowest number of Indigenous-owned businesses, followed by Saskatchewan (6.3%) and Manitoba (6.9%). By contrast, more than half of non-Indigenous-owned businesses were located in Ontario (37.1%) and Quebec (20.8%), followed by Alberta (16.5%).
The decrease in the number of Indigenous-owned businesses was largely driven by Alberta, where the number started declining in 2015. Although it is probably not the lone factor, the 2014 oil price shock may have caused the decline, since it would have affected more Indigenous-owned than non-Indigenous-owned businesses. Indeed, over the 2015-to-2018 period, the average growth in the number of businesses in Alberta was -0.3% and -2.4% for non-Indigenous-owned and Indigenous-owned businesses, respectively.
The Indigenous ownership share varied across provinces and territories. Unsurprisingly, the provinces with the highest number of non-Indigenous-owned businesses were associated with the lowest Indigenous ownership share. Ontario (0.7% on average) and Quebec (1.0%) had the lowest proportion of Indigenous-owned businesses from 2005 to 2018. The territories (13.9%) were the only jurisdiction to post a double-digit Indigenous ownership share. Alberta (2.0%), the province with the highest number of Indigenous-owned businesses, had an Indigenous ownership share higher than British Columbia (1.6%) but lower than the Atlantic regionNote (2.3%), Saskatchewan (2.6%) and Manitoba (3.6%).
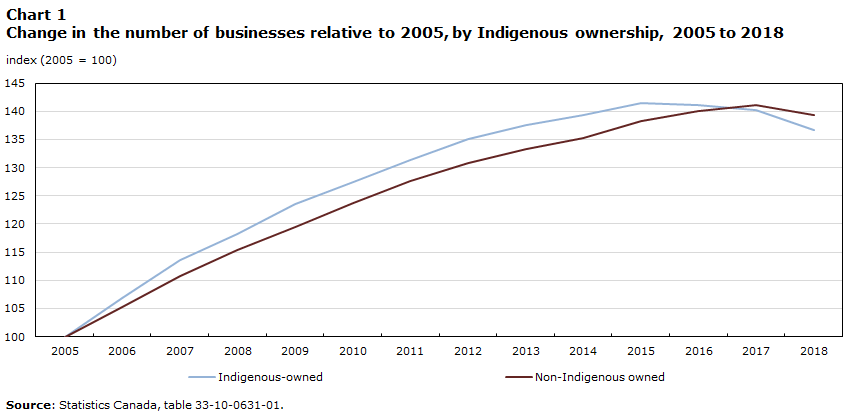
Data table for Chart 1
| Indigenous-owned | Non-Indigenous owned | |
|---|---|---|
| index (2005 = 100) | ||
| 2005 | 100.0 | 100.0 |
| 2006 | 106.8 | 105.3 |
| 2007 | 113.6 | 110.7 |
| 2008 | 118.2 | 115.4 |
| 2009 | 123.5 | 119.5 |
| 2010 | 127.4 | 123.7 |
| 2011 | 131.3 | 127.7 |
| 2012 | 135.1 | 130.9 |
| 2013 | 137.5 | 133.3 |
| 2014 | 139.3 | 135.2 |
| 2015 | 141.4 | 138.2 |
| 2016 | 141.1 | 140.0 |
| 2017 | 140.3 | 141.1 |
| 2018 | 136.7 | 139.4 |
|
Source: Statistics Canada, table 33-10-00-91-01 |
||
The number of women-ownedNote Indigenous businesses is growing faster than that of men-owned Indigenous businesses
The majority of Indigenous-owned businesses (73.4% on average) were held by men over the 2005-to-2018 period
Both the shares of men-owned and women-owned businesses among Indigenous-owned businesses were higher than for non-Indigenous-owned businesses. The share of men-owned businesses among Indigenous-owned businesses was on average 10 percentage points higher than that of men-owned businesses among non-Indigenous-owned businesses (64.6%). Furthermore, Indigenous-owned businesses (23.2%) were on average proportionally more likely to be held by women than non-Indigenous-owned businesses (19.5%). The proportion of equally owned businesses was about five times higher in non-Indigenous-owned than Indigenous-owned businesses.
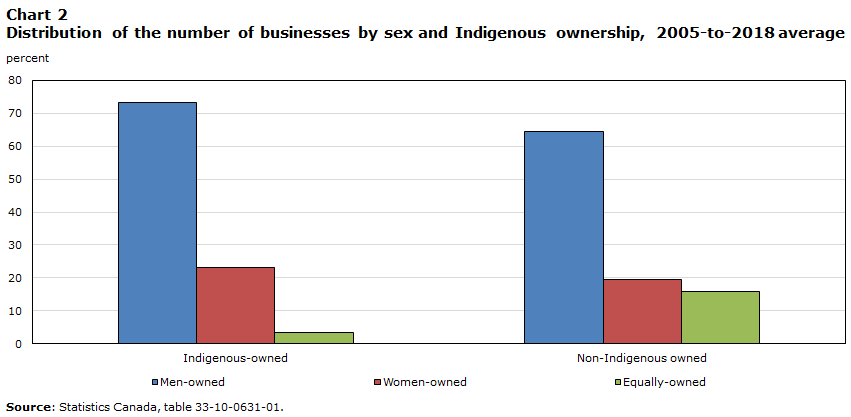
Data table for Chart 2
| Indigenous-owned | Non-Indigenous owned | |
|---|---|---|
| percent | ||
| Men-owned | 73.4 | 64.6 |
| Women-owned | 23.2 | 19.5 |
| Equally-owned | 3.4 | 15.9 |
| Source: Statistics Canada, table 33-10-0091-01 | ||
Indigenous-owned businesses are more likely to be held by young entrepreneurs than non-Indigenous-owned businesses
From 2005 to 2018, among both Indigenous-owned and non-Indigenous-owned businesses, those owned by individuals aged 45 to 54 accounted for the highest share (29% to 30% on average) (CODR table 33-10-0632-01). Furthermore, Indigenous-owned businesses were proportionally more likely to be owned by younger entrepreneurs (younger than 35 years; 14.1% versus 10.7%) and less likely to be held by older entrepreneurs (65 years and older; 10.9% versus 15.1%) than non-Indigenous-owned businesses. It is also important to note that the proportion of Indigenous-owned and non-Indigenous-owned businesses held by individuals in the age groups 35 to 44 years and 45 to 54 years has trended downward from 2005 to 2018 in favour of those owned by individuals in the age groups 55 to 64 years or 65 years and older.
Authors
Bassirou Gueye, Amélie Lafrance-Cooke and Javier Oyarzunare are with the Economic Analysis Division at Statistics Canada.
References
Gueye, B., A. Lafrance, J. Oyarzun. (2022). Identifying Indigenous business owners and Indigenous-owned businesses. Analytical Studies: Methods and References. Statistics Canada Catalogue no.11-633-X – No. 045. Ottawa: Statistics Canada.
Statistics Canada. Table 33-10-0631-01 Private enterprises by sex and Indigenous identity of ownership, province or region and enterprise size.
Statistics Canada. Table 33-10-0632-01 Private enterprises by sex and Indigenous identity of ownership, age group of primary owner and enterprise size.
- Date modified: