Job quality of racialized Canadians with a bachelor’s degree

Description: Job quality of racialized Canadians with a bachelor’s degree
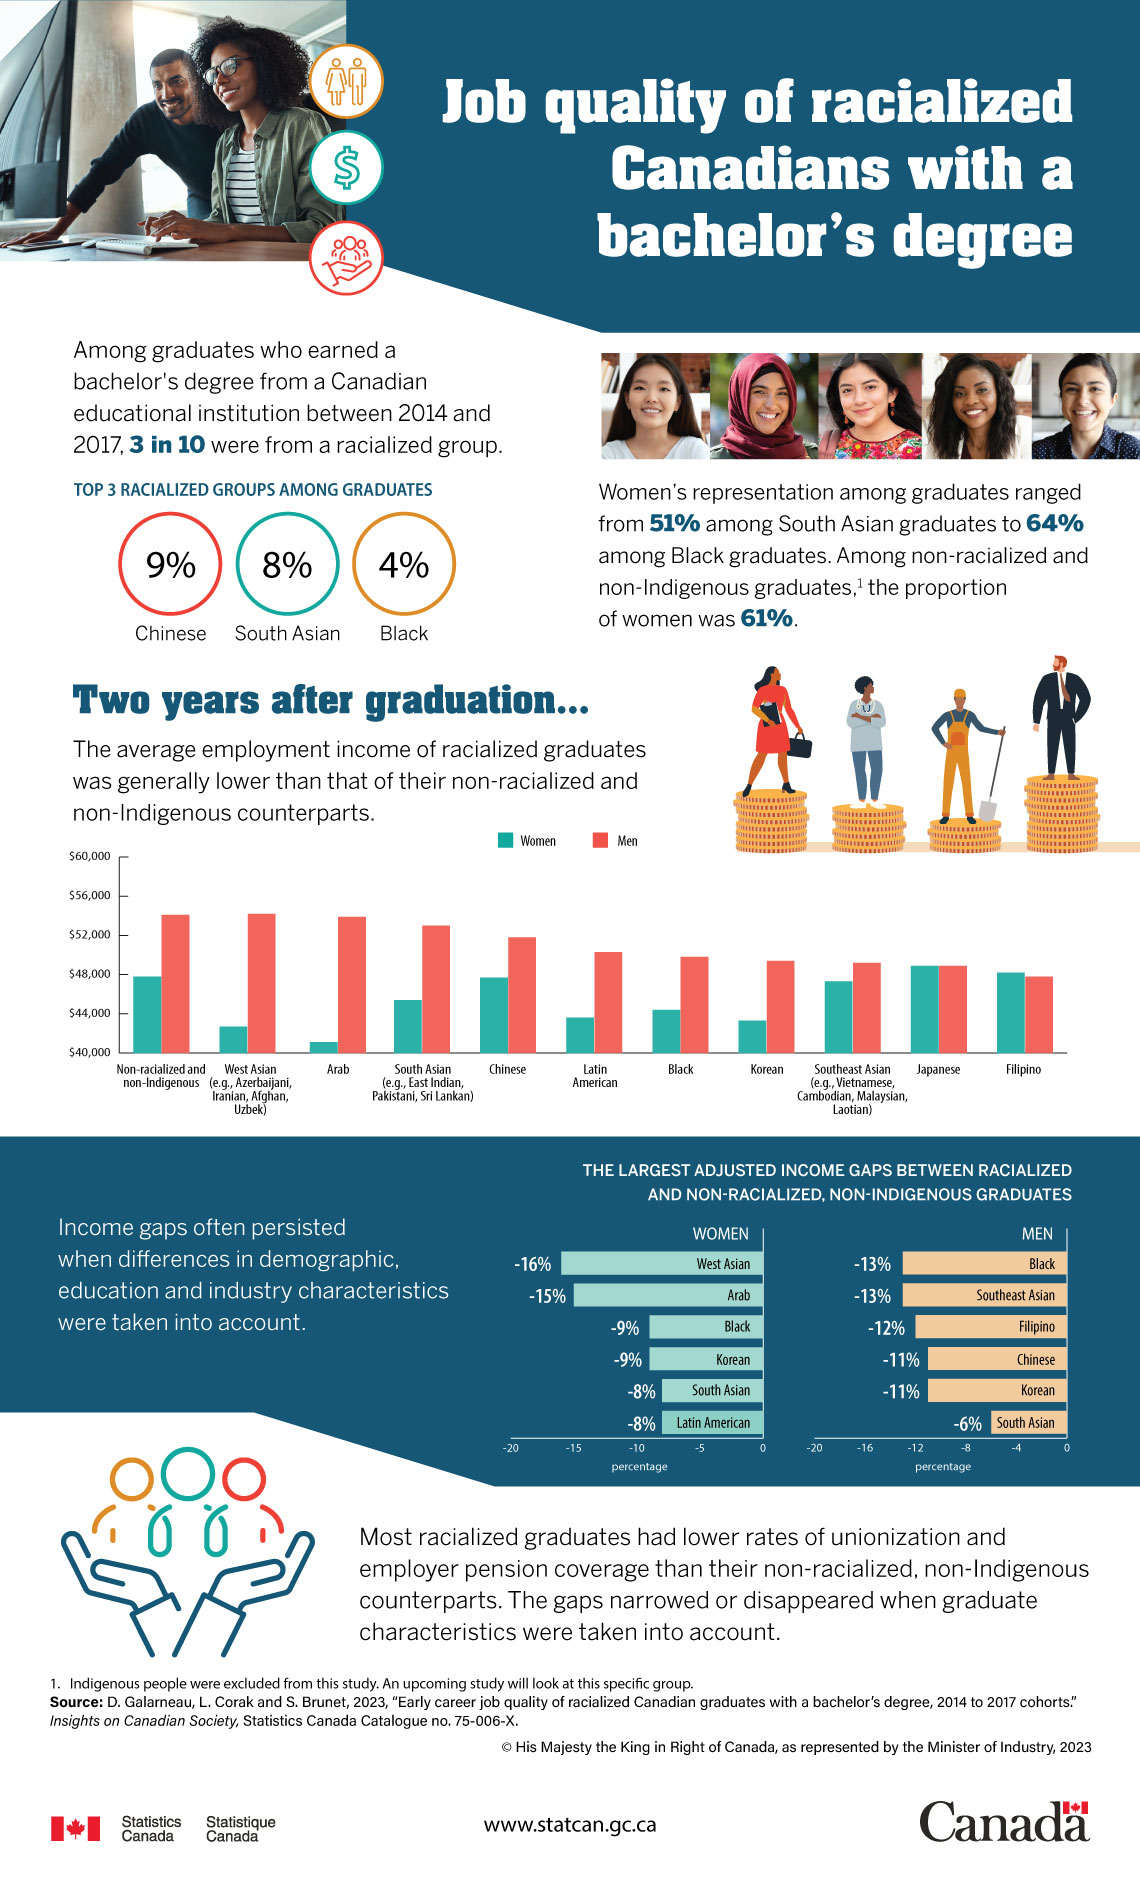
Among graduates who earned a bachelor’s degree from a Canadian educational institution between 2014 and 2017, 3 in 10 were from a racialized group.
Top 3 racialized groups among graduates
- Chinese, 9%
- South Asian, 8%
- Black, 4%
Women’s representation as graduates ranged from 51% among South Asian graduates to 64% among Black graduates. Among non-racialized and non-Indigenous graduates,Note 1 the proportion of women was 61%.
Two years after graduation…
The average employment income of racialized graduates was generally lower than that of their non-racialized and non-Indigenous counterparts.
| Women | Men | |
|---|---|---|
| Non-racialized and non-Indigenous | $47,800 | $54,100 |
| West Asian (e.g., Azerbaijani, Iranian, Afghan, Uzbek) | $42,700 | $54,200 |
| Arab | $41,100 | $53,900 |
| South Asian (e.g., East Indian, Pakistani, Sri Lankan) | $45,400 | $53,000 |
| Chinese | $47,700 | $51,800 |
| Latin American | $43,600 | $50,300 |
| Black | $44,400 | $49,800 |
| Korean | $43,300 | $49,400 |
| Southeast Asian (e.g., Vietnamese, Cambodian, Malaysian, Laotian) | $47,300 | $49,200 |
| Japanese | $48,900 | $48,900 |
| Filipino | $48,200 | $47,800 |
Income gaps often persisted when differences in demographic, education and industry characteristics were taken into account.
The largest adjusted income gaps between racialized and non-racialized, non-Indigenous graduates
Women
- West Asian, -16%
- Arab, -15%
- Black, -9%
- Korean, -9%
- South Asian, -8%
- Latin American, -8%
Men
- Black, -13%
- Southeast Asian, -13%
- Filipino, - 12%
- Chinese, -11%
- Korean, -11%
- South Asian, -6%
Most racialized graduates had lower rates of unionization and employer pension coverage than their non-racialized, non-Indigenous counterparts. The gaps narrowed or disappeared when graduate characteristics were taken into account.
Source: D. Galarneau, L. Corak and S. Brunet. 2023, “Early career job quality of racialized Canadian graduates with a bachelor’s degree, 2014 to 2017 cohorts,” Insights on Canadian Society, Statistics Canada Catalogue no. 75-006-X.
- Date modified: