
Economic and Social Reports
The value of unpaid childcare and paid employment by gender: What are the impacts of the low-fee universal childcare program?
DOI: https://doi.org/10.25318/36280001202200700003-eng
Abstract
This paper presents an estimate of unpaid childcare, other unpaid household activities and paid employment over time in the Canadian provinces for the period from 1998 to 2015. The estimates are then used to assess the effects of the low-cost childcare launched in Quebec in 1997 on paid employment. They are also used to examine the contribution of unpaid childcare and other unpaid household activities to well-being and welfare in Canada. As in previous studies, the paper finds that low-fee childcare in Quebec is associated with an increase in the employment rate of women and an increase in the use of paid childcare in Quebec. In addition, new results show there is little difference in the impact of low-cost childcare on the employment rate and the hours worked of mothers between immigrants and native-born Canadians, and between low-income and high-income households. These findings suggest that these groups faced similar barriers to access. In addition, the study shows that the introduction of low-cost childcare in Quebec does not appear to have had an effect on the use of unpaid childcare. The hours spent on unpaid childcare increased in Quebec and the other provinces for the period from 1998 to 2015, and the increase was similar in Quebec and the other provinces. The paper also finds that women accounted for about 60% of hours spent on unpaid childcare and other household activities in 2015, while men accounted for 40% of hours spent on these activities. However, the share of women in unpaid childcare and other unpaid household activities declined over time, and this is related to the increase in female labour force participation over that period. The value of unpaid childcare and the value of other unpaid household production were each estimated to be about 15% of the gross domestic product in Canada for 2015 and changed little over the period from 1998 to 2015.
Author
Wulong Gu is with the Economic Analysis Division at Statistics Canada.
Acknowledgments
Thank you to Sandy Besporstov and Amanda Sinclair for providing assistance and sharing the programs that were modified for the estimation in this paper. Thank you to Brenda Bugge, Leanne Findlay, Stacie Kerr, Danny Leung, Ryan Macdonald and two anonymous reviewers for helpful comments.
Introduction
Quebec’s low-fee childcare program was launched in 1997, and it initially targeted 4- and 5-year-olds. It was expanded to include all children aged 5 to 12 in 1998. The program was later expanded to include all preschool-aged children aged 0 to 4 years in 2000. This low-fee childcare program had a major impact on the labour force participation of women, and it increased the use of paid childcare in Quebec (Baker et al., 2008; Fortin et al., 2012; Lefebvre et al., 2009).Note
While the evidence on paid employment and the use of childcare is well documented, there is little evidence on the effect of low-cost childcare models on unpaid childcare. It is hypothesized that low-cost childcare may lead to a substitution of paid childcare for unpaid childcare, which allows parents to increase paid employment. Some recent work has started to construct a measure of household production that includes childcare, which can be used to examine the trend in unpaid childcare. Besporstov and Sinclair (2022) constructed a benchmark estimate of unpaid childcare and other household production at the national and regional levels for one year, which was then used to derive a time series estimate of unpaid childcare and other unpaid household production. This paper expands on the work of Besporstov and Sinclair (2022) by constructing a time series estimate of unpaid childcare and other unpaid household activities by province over time.
Household production and the expanded accounts provide a measure of unpaid childcare and other unpaid household production, which can be used to examine the contribution of unpaid childcare to well-being and quality of life in Canada (Gee, 2015; Statistics Canada, 1995). Because women account for most of the unpaid childcare and other unpaid household production, the expanded account provides a more adequate measure of the contribution of women to well-being and quality of life than the measure of the gross domestic product (GDP) found in the national accounts, which captures market production, but excludes unpaid household production activities.
Estimates in this paper are used to infer the effect of low-cost childcare in Quebec on the labour force participation of parents. It focuses on women in Quebec, with a comparison of unpaid childcare, other unpaid household production and paid employment between Quebec and the other provinces. A comparison of the trend in unpaid childcare and paid employment between Quebec (which has adopted low-cost childcare) and the other provinces (which have not adopted low-cost childcare) provides an inference on the effect of low-cost childcare on these changes. The estimated effects of low-cost childcare in Quebec shed light on the potential impact of the move towards a model of universal childcare that is more affordable and accessible. The universal childcare program being implemented by the Government of Canada (Department of Finance, 2021), which is similar to the low-fee universal childcare program in Quebec, is expected to increase paid employment since it will lead to increased use of childcare and will provide individuals, especially women, with opportunities to participate in paid employment.
This paper has three main objectives. First, it presents estimates of childcare provided by parents, together with other unpaid household activities and paid employment over time in the Canadian provinces. Second, using these estimates, the study estimates the impact of low-cost childcare in Quebec on the employment rate of parents and unpaid childcare provided by parents in Quebec, especially mothers. It also examines the difference in the impact between immigrants and native-born Canadians, as well as low-income and high-income households. Third, the paper uses estimates of unpaid childcare and other unpaid household production to provide a more comprehensive estimate of the contribution of women and unpaid childcare to well-being and quality of life in Canada.
The main data source for the paper is the General Social Survey (GSS) – Time Use, which is used to estimate the hours of unpaid childcare, other unpaid household activities and paid employment.
The rest of the paper is organized as follows: Section 2 presents an empirical framework, Section 3 shares the data sources used for this paper, Section 4 presents the estimates and main findings, and Section 5 provides a conclusion.
Empirical framework
The paper starts with the construction of a time series estimate of unpaid childcare and other unpaid household production, which can be compared with and added to the measures of paid work and the production activities in the national accounts. The expanded measure of production now includes market production and unpaid household production and forms an essential component of a household production satellite account (Landefeld et al., 2009; UNECE, 2007). This expanded measure of production and household production account have been developed by national statistical agencies, such as the U.S. Bureau of Economic Analysis and the United Kingdom’s Office for National Statistics, to provide a more comprehensive measure of welfare and to examine the contribution of unpaid production and women to welfare (Kanal and Kornegay [2019] for the United States and Payne and Vassilev [2018] for the United Kingdom).
The measures of unpaid childcare will be further disaggregated by immigration status and low- and high income households to examine the types of individuals and households that experienced the most significant changes in paid employment, unpaid childcare and other unpaid household production attributable to the introduction of low-cost childcare in Quebec. If there were significant barriers to accessing childcare by immigrants and low-income households, the low-cost childcare program is expected to have a large impact on those households in terms of increased labour force participation and use of paid childcare.
In the expanded accounts, the value of hours spent on unpaid childcare and other unpaid household activities must be imputed so it can be added to and compared with the value of paid employment and production activities taking place in the market. While the value of paid employment and production in the market is observed using the market valuation, such as the compensation to employed individuals, the value of unpaid childcare and other unpaid household production must be imputed since such values are not observed. There are two main options for the imputation: the opportunity cost and replacement cost approaches. The opportunity cost approach values the time of unpaid household production at the hourly compensation of the person performing the household production. The replacement cost approach values the time of unpaid household production at the hourly compensation of workers who can be hired on the market to perform similar household activities.
The replacement cost approach is recommended (Landefeld et al., 2009). It is adopted in the national accounts, which often use the observed market prices for goods and services to estimate the value of similar goods and services for which there are no markets. For example, the observed market rents are used to estimate the rent of all owner-occupied dwellings. Schreyer and Diewert (2014) also argue for a replacement cost approach. Their theoretical findings lent “support to giving preference to a replacement cost valuation, as long as the purpose is measuring the value of household production.”
For this paper, the replacement cost approach is used, and the average hourly compensation of workers in the personal services sector by province is used as the replacement cost.Note The workers in the sector perform various activities that are similar to unpaid household activities estimated in this paper and are therefore used as a proxy for the replacement wage that can be used to estimate the value of unpaid household activities. The replacement wage is estimated mainly from the Labour Force Survey and the Census of Population, which collect information on the labour market activities of the working-age population, as well as various other sources, and they can be obtained from the national accounts.
Once the time series estimate of hours worked and the value of unpaid childcare, other unpaid household production and paid employment by province over time is constructed, it is used to examine the impact of low-cost childcare in Quebec on the employment rates of parents and unpaid childcare provided by parents in Quebec—especially among mothers. It is also used to examine the contribution of women and unpaid childcare to an expanded measure of the value of goods and services that now include both GDP and those unpaid production activities which forms a comprehensive measure of economic welfare and quality of life in Canada. This paper’s empirical strategy for the effect of low-cost childcare in Quebec is to examine the difference in the trends in unpaid childcare, other unpaid household activities and paid employment between Quebec and the other provinces over time. The difference in the trends between Quebec and the other provinces will be attributed to the implementation of low-cost childcare in Quebec. While other factors may have contributed to the divergent trend in Quebec compared with the national average, these additional factors are assumed to be offsetting or to have little overall effect.
Data sources and estimations
The time series measures of hours worked and the value of various paid and unpaid activities by province are constructed for the period from 1998 to 2015. The selection of the periods was determined by the availability of the GSS data. The time use modules of the GSS are available for 1987, 1993, 1998, 2005, 2010 and 2015. The data from 1987 and 1993 are not entirely comparable with those from the more recent surveys starting in 1998. Therefore, the estimates in this paper focus on the period from 1998 to 2015. Nevertheless, the estimates for 1993 are used to provide an inference of difference in the trend in unpaid household production when appropriate, before and after the implementation of low-cost childcare in Quebec in 1997.
Estimates are derived for three main hour measures: unpaid hours in childcare, unpaid hours in other household production and hours in paid employment. The three hour measures are estimated for men and women separately. The measures are further cross-classified by employment status (employed vs. unemployed), presence of children (with children aged 0 to 14 years vs. without children), immigrant status, and income (low-income vs. high-income households).Note Estimates are provided for individual provinces to infer the impact of Quebec’s low-fee childcare program on time spent on unpaid childcare and paid employment.Note
The measures are derived from the GSS – Time Use. This survey has a diary component in which respondents record the duration and incidence of various activities in a 24-hour period. However, it also includes specific questions on hours spent on various main activities (unpaid childcare, unpaid household production and paid employment) during a week. These two related questions can be used to estimate hours of various activities. That is, the hours of unpaid childcare and other unpaid household activities can be derived from the questions on hours spent on those activities during a week. Alternatively, hours spent on household activities can be derived from the 24-hour diary that documents the incidence and duration of these activities.
For this paper, the questions on the hours spent on various activities during a week are used to provide comparable estimates of hours spent on three broad activities (unpaid childcare, other unpaid household activities and paid employment). If the diary were used, additional assumptions would have to be made on the number of days engaged in these activities in a week to derive the hours in a week and, ultimately, annual hours spent on these activities. A common assumption is that the activities are carried out every day of a year and the number of hours spent on these activities in a day is then multiplied by the number of days in a year (365 days) to derive the annual estimate. But this may not be appropriate if there is difference in hours between weekday and weekend activities, and the hours worked in a particular 24-hour window may not be representative of those activities in a week.Note
Besporstov and Sinclair (2022) used the diary portion of the survey to estimate the number of hours spent on various unpaid household activities. Their estimates are comparable with the estimates in this paper. The advantage of the estimation from the diary is that it provides more details on various household activities. Since the focus here is on unpaid childcare compared with paid work and estimations for broad categories, the questions on hours spent on paid and unpaid work during a reference week are sufficient for the purpose of this paper.Note
Hours of paid work, unpaid childcare and other unpaid household activities during a reference week are then used to derive annual estimates. The annual estimate of hours of paid work is derived by multiplying the hours of paid work in a week by the number of weeks worked, where the number of weeks worked is also from the GSS. Annual hours of unpaid childcare and other unpaid household activities are derived by multiplying the hours in a week by 52 weeks. An implicit assumption for this approach is that household activities need to be carried out every week of the year.Note
It is also worth noting that an individual may report 168 hours during a week of unpaid childcare or other unpaid household activities, that is, 24 hours a day and 7 days a week. For the final estimates presented in this paper, hours are capped at 105 hours a week (or 15 hours a day and 7 days a week.). The maximum of 15 hours a day is chosen for unpaid childcare and other unpaid household activities to be comparable with the maximum of 15 hours of paid work a day that was capped for paid employment in the GSS. While this choice of an upper limit on unpaid household activities yields some difference in the final estimates of unpaid childcare and other household activities, the difference is small.
Empirical results
To facilitate the interpretation of data in this section, hours worked are presented as average hours per week. For example, it is relatively easy to comprehend the fact that a person spends an average of 40 hours a week on paid employment, 20 hours on unpaid childcare or 20 hours on other unpaid household work.Note
This section will present hours spent on unpaid childcare and other unpaid household production, as well as paid employment. It will then present the value of unpaid childcare and other household production using the replacement cost approach for imputation. In the last part of the section, the paper will provide a counter-factual analysis to estimate the potential impact of the low-fee childcare model in Quebec on paid and unpaid employment.
Hours of unpaid childcare, other unpaid household production and paid employment
In this section, the hours of paid employment, unpaid childcare and other unpaid household activities for individuals with children aged 0 to 14 years are presented. The focus is to identify provincial differences—especially between Quebec and the other provinces—in the level and trend of hours of paid work and hours of unpaid household activities so as to trace these differences to those in the provision of childcare between Quebec and the other provinces. While the estimates are available for all provinces, the presentation will focus on the difference between Quebec and the national total.
The rest of this section starts with hours of unpaid childcare and other unpaid household activities, followed by a discussion on hours of paid work. The hours of paid work are further decomposed into the employment rate by hours worked for employed individuals. The decomposition is necessary because previous studies have shown that the main effect of low-fee childcare in Quebec is on the labour force participation and the employment rate of women in Quebec, not on the hours worked.
Chart 1 start

Data table for Chart 1
| 1998 | 2005 | 2010 | 2015 | |
|---|---|---|---|---|
| hours | ||||
| Quebec women | 39.70 | 42.30 | 43.58 | 46.96 |
| Canadian average women | 43.13 | 49.82 | 50.13 | 51.94 |
| Quebec men | 21.86 | 22.18 | 25.28 | 32.27 |
| Canadian average men | 18.66 | 23.65 | 25.01 | 30.05 |
| Source: Author's tabulation from Statistics Canada's General Social Survey. | ||||
Chart 1 end
Hours of unpaid childcare
Chart 1 presents the total hours of unpaid childcare per week for individuals with children aged 0 to 14 years in Quebec and Canada. The estimates are presented separately for women and men.
Women spent more hours on unpaid childcare than men. For example, in 2015, at the national level, women spent 52 hours per week on unpaid childcare, while men spent 30 hours per week on unpaid childcare.
The hours spent on unpaid childcare increased over the period from 1998 to 2015 for both men and women at the national level. But the increase was faster for men than for women over that period. For women, time increased from 43 hours per week in 1998 to 52 hours per week in 2015, up about 1.0% per year during that period. For men, it rose from 19 hours per week in 1998 to 30 hours per week in 2015, an increase of about 2.8% per year during that period.
The hours spent on unpaid childcare by men were similar between Quebec and the other provinces. However, there was a large difference in hours spent on unpaid childcare by women between Quebec and the other provinces. Women spent considerably less time on unpaid childcare in Quebec than women in the other provinces. In 2015, women spent 47 hours per week on unpaid childcare in Quebec, which was 10% lower than the time spent on unpaid childcare by women at the national level (52 hours per week).
The trend towards a slow decline in unpaid childcare that was observed in other countries was not evident in Canada (Kanal and Karnegay [2019] for the United States). In fact, the hours spent on unpaid childcare by women increased both in Quebec and at the national level over time. The increase was slightly slower for women in Quebec compared with women at the national level. The trend towards increasing unpaid childcare may indicate that parents are now more involved with the care and learning of children.
The difference in unpaid hours spent on childcare between Quebec and the other provinces could be attributable to the presence of low-fee daycare in Quebec, which makes paid childcare more accessible. As a result of the relative low cost associated with paid childcare in Quebec, women in Quebec substituted low-fee paid childcare for unpaid childcare.Note
The exact sources of the factors behind the relatively fewer hours of unpaid childcare by women in Quebec must be examined. One method to examine the factors is to obtain estimates from the GSSs conducted before the implementation of low-cost childcare in Quebec. However, estimates from previous GSSs do not appear to be entirely consistent with those from the more recent GSSs used in this paper. For example, hours of paid employment appear to be overestimated in 1993 compared with more recent years. In fact, the estimates from the GSS show that the employment rates for both women and men were higher in 1993 than in 1998, contradicting the general trend towards rising employment and labour force participation rates for women. Therefore, the paper focuses only on the estimates from the 1998 GSS onwards.
Nevertheless, estimates of hours of unpaid childcare based on the time use module of the 1993 GSS were lower for Quebec women than for women at the national level. This finding shows that the number of hours of unpaid child was relatively lower in Quebec before the introduction of low-cost childcare in that province in 1997, suggesting that the relatively lower number of hours of unpaid childcare is not related to low-fee childcare in Quebec.
Hours of other unpaid household activities
While hours spent on unpaid childcare increased over time for both men and women at the national level, hours spent on other unpaid household activities were stable over time for both men and women at the national level, as shown in Chart 2.
Chart 2 start

Data table for Chart 2
| 1998 | 2005 | 2010 | 2015 | |
|---|---|---|---|---|
| hours | ||||
| Quebec women | 19.55 | 14.38 | 13.15 | 11.94 |
| Canadian average women | 18.27 | 16.95 | 19.00 | 17.58 |
| Quebec men | 10.43 | 8.97 | 8.91 | 8.53 |
| Canadian average men | 9.51 | 9.77 | 10.01 | 9.50 |
| Source: Author's tabulation from Statistics Canada's General Social Survey. | ||||
Chart 2 end
Women spent more hours on other unpaid household activities than men. For example, in 2015, at the national level, women spent 18 hours per week on other unpaid household activities, which was almost twice as high as the 10 hours that men spent per week on other unpaid household activities that year.
The hours spent on other unpaid household activities were similar between men in Quebec and in the other provinces. However, there was a large difference in the trend in hours spent on other unpaid household activities between women in Quebec and in the other provinces. In Quebec, women spent a similar amount of time on other unpaid household activities compared with women in the other provinces in 1998. But in 2015, women spent much less time on other unpaid household activities in Quebec than in the other provinces, since the hours of other unpaid household activities declined for women in Quebec, while they changed little for those in the other provinces.
The exact cause of this decline in hours spent on other unpaid household activities by women in Quebec remains to be determined. One factor for such a relative decline could be the increase in the labour force participation of women in Quebec, which has led to a decline in hours of other unpaid household activities by women.
Hours of paid work and employment rate
Chart 3 presents the hours of paid work per week by province for individuals with children aged 0 to 14 years. The average hours of paid employment in a week in Table 3 and Chart 3 are estimated by dividing the estimated annual hours of paid employment by 52 weeks. As a result, the average hours of paid work in a week can be compared with the average hours of unpaid childcare and other unpaid household activities in a week.
Chart 3 start

Data table for Chart 3
| 1998 | 2005 | 2010 | 2015 | |
|---|---|---|---|---|
| hours | ||||
| Quebec women | 15.17 | 18.82 | 20.64 | 23.27 |
| Canadian average women | 15.83 | 19.37 | 20.81 | 23.02 |
| Quebec men | 29.10 | 32.91 | 32.87 | 33.62 |
| Canadian average men | 30.15 | 35.35 | 33.92 | 34.88 |
| Source: Author's tabulation from Statistics Canada's General Social Survey. | ||||
Chart 3 end
Women spent fewer hours on paid work than men. For example, in 2015, at the national level, women spent 23 hours per week on paid work, while men spent 35 hours per week on paid work.
The hours spent on paid work increased from 1998 to 2015 for both men and women at the national level. However, the increase was faster for women with children than for men with children over that period. This is consistent with the overall trend in the relative increases in labour force participation of women during that period. For women with children, time spent on paid work increased from 16 hours per week in 1998 to 23 hours per week in 2015, an increase of about 2.2% per year during that period. For men with children, it increased from 30 hours per week in 1998 to 35 hours per week in 2015, an increase of about 0.9% per year during that period.
The level and trend of hours spent on paid work were similar for both men and women in Quebec and the other provinces, as shown in Chart 3. The hours worked by an individual are equal to the hours worked by the employed person times the employment rate. When these two components of hours worked are examined, the similarity in hours of paid work over time hides the difference in the trend in employment rate and hours worked of the employed individuals between Quebec and the other provinces, as shown in charts 4 and 5.
Chart 4 start
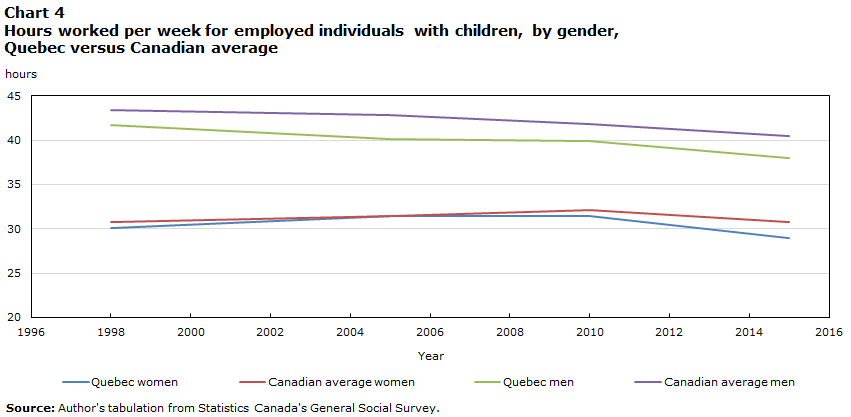
Data table for Chart 4
| 1998 | 2005 | 2010 | 2015 | |
|---|---|---|---|---|
| hours | ||||
| Quebec women | 30.11 | 31.43 | 31.49 | 29.00 |
| Canadian average women | 30.74 | 31.39 | 32.10 | 30.81 |
| Quebec men | 41.75 | 40.11 | 39.89 | 37.97 |
| Canadian average men | 43.43 | 42.81 | 41.85 | 40.50 |
| Source: Author's tabulation from Statistics Canada's General Social Survey. | ||||
Chart 4 end
Chart 5 start

Data table for Chart 5
| 1998 | 2005 | 2010 | 2015 | |
|---|---|---|---|---|
| percent | ||||
| Quebec women | 0.50 | 0.60 | 0.66 | 0.80 |
| Canadian average women | 0.52 | 0.62 | 0.65 | 0.75 |
| Quebec men | 0.70 | 0.82 | 0.82 | 0.89 |
| Canadian average men | 0.69 | 0.83 | 0.81 | 0.86 |
|
Source: Author's tabulation from Statistics Canada's General Social Survey. |
||||
Chart 5 end
The hours worked by employed people are similar in Quebec and the other provinces for both men and women. They declined slightly for men and changed little for women during the period from 1998 to 2015 in Quebec and the other provinces.
The employment rate increased for both men and women in Quebec and the other provinces. But the increase in the employment rate was faster in Quebec than in the other provinces, especially for women. In Quebec, the employment rate for women increased from 50% in 1998 to 80% in 2015 (or a 30-percentage-point increase), while it increased from 52% to 75% (or a 23-percentage-point increase) at the national level for that period. For men, the increase in the employment rate was slightly faster, but not significant, in Quebec compared with the national level.
The estimate of employment rates for 1993—before the introduction of low-fee childcare in Quebec, though not entirely comparable with the more recent estimates—suggests that employment rates for women with children were much lower in Quebec than in the other provinces.
Previous studies found that an increase in the employment rate of women in Quebec was attributable to the introduction of low-fee childcare in Quebec (Baker et al., 2008; Fortin et al., 2012). Their findings are used in the present paper to attribute the increase in the employment rate of women in Quebec, which is above the increase at the national level, to the effect of low-cost childcare in Quebec. Since the difference in the employment rate between men in Quebec and at the national level is not large, it is assumed that low-fee childcare did not have an effect on the employment rate of men.
Use of paid childcare
This section presents evidence on the use of paid childcare. It is expected that individuals living in Quebec are more likely to use paid childcare than those in the other provinces, as a result of low-fee childcare in Quebec.
The evidence on paid childcare supports this hypothesis. Information on paid childcare is available in the GSS for 2010 and 2015, but it is not available for other years. The share of households with children that paid for childcare was higher and increased faster in Quebec than at the national level. In Quebec, about 26% of parents with children paid for childcare in 2015 compared with 14% at the national level. In fact, the share of parents who paid for childcare in Quebec was the highest among the Canadian provinces in 2015 and was among the highest in 2010.Note
The contribution of women to unpaid childcare and other unpaid household activities
This section presents evidence on the share of unpaid childcare accounted for by women. For comparison, data on the share of other unpaid household activities and paid work accounted for by women are also presented.
As shown in Table 1, women accounted for most unpaid childcare and other household production, while they accounted for less than half of hours spent on paid work. In 2015, women accounted for about 60% of hours spent on childcare and other household activities, and they accounted for about 40% of hours spent on paid work. The share of their contribution to unpaid childcare was lowest in Quebec and in some Atlantic provinces, and this is consistent with the finding that women in Quebec spent relatively less time on unpaid childcare compared with the national average, while men in Quebec spent a similar amount of time on unpaid childcare compared with the national average.
The share of unpaid childcare and household production by women declined over time, while the share of paid employment increased over time.
| Year | ||||
|---|---|---|---|---|
| 1998 | 2005 | 2010 | 2015 | |
| ratio | ||||
| Unpaid child care | ||||
| Newfoundland and Labrador | 0.77 | 0.66 | 0.69 | 0.57 |
| Prince Edward Island | 0.74 | 0.65 | 0.61 | 0.67 |
| Nova Scotia | 0.74 | 0.61 | 0.68 | 0.69 |
| New Brunswick | 0.74 | 0.69 | 0.64 | 0.62 |
| Quebec | 0.66 | 0.67 | 0.65 | 0.62 |
| Ontario | 0.69 | 0.68 | 0.68 | 0.65 |
| Manitoba | 0.64 | 0.66 | 0.76 | 0.68 |
| Saskatchewan | 0.72 | 0.69 | 0.66 | 0.68 |
| Alberta | 0.76 | 0.73 | 0.69 | 0.66 |
| British Columbia | 0.73 | 0.69 | 0.69 | 0.65 |
| Canada | 0.70 | 0.68 | 0.68 | 0.65 |
| Other unpaid household activities | ||||
| Newfoundland and Labrador | 0.64 | 0.62 | 0.62 | 0.59 |
| Prince Edward Island | 0.67 | 0.63 | 0.65 | 0.58 |
| Nova Scotia | 0.67 | 0.59 | 0.60 | 0.61 |
| New Brunswick | 0.65 | 0.62 | 0.62 | 0.63 |
| Quebec | 0.64 | 0.61 | 0.60 | 0.61 |
| Ontario | 0.64 | 0.62 | 0.63 | 0.62 |
| Manitoba | 0.61 | 0.60 | 0.62 | 0.62 |
| Saskatchewan | 0.63 | 0.61 | 0.61 | 0.63 |
| Alberta | 0.65 | 0.62 | 0.63 | 0.65 |
| British Columbia | 0.64 | 0.63 | 0.61 | 0.60 |
| Canada | 0.64 | 0.62 | 0.62 | 0.62 |
| Paid work | ||||
| Newfoundland and Labrador | 0.36 | 0.43 | 0.47 | 0.43 |
| Prince Edward Island | 0.41 | 0.42 | 0.43 | 0.45 |
| Nova Scotia | 0.38 | 0.42 | 0.44 | 0.45 |
| New Brunswick | 0.39 | 0.41 | 0.43 | 0.43 |
| Quebec | 0.36 | 0.39 | 0.43 | 0.43 |
| Ontario | 0.39 | 0.41 | 0.43 | 0.43 |
| Manitoba | 0.39 | 0.40 | 0.41 | 0.41 |
| Saskatchewan | 0.35 | 0.39 | 0.42 | 0.40 |
| Alberta | 0.37 | 0.39 | 0.37 | 0.38 |
| British Columbia | 0.39 | 0.40 | 0.43 | 0.43 |
| Canada | 0.38 | 0.40 | 0.42 | 0.42 |
| Source: Author’s tabulation from Statistics Canada’s General Social Survey. | ||||
The value of unpaid childcare and other unpaid household activities
Tables 2 and 3 present the value of unpaid childcare and other unpaid household production, which is estimated by using the replacement cost approach. The replacement cost is proxied by the hourly compensation rate of workers in the personal services and private household sector by province obtained from the national accounts.
The value of unpaid childcare in Canada was about $284 billion in 2015, which was about 15% of the GDP in Canada. The value of other unpaid household production was similar, at $276 billion, or 15% of the GDP, in 2015.
| Year | ||||
|---|---|---|---|---|
| 1998 | 2005 | 2010 | 2015 | |
| $ millions | ||||
| Value of unpaid child care | ||||
| Newfoundland and Labrador | 2,423 | 3,263 | 3,765 | 4,673 |
| Prince Edward Island | 724 | 1,030 | 1,082 | 942 |
| Nova Scotia | 4,265 | 5,289 | 5,440 | 5,975 |
| New Brunswick | 3,393 | 4,560 | 4,945 | 4,895 |
| Quebec | 36,493 | 39,990 | 43,469 | 58,239 |
| Ontario | 51,309 | 83,264 | 99,820 | 100,441 |
| Manitoba | 5,767 | 8,063 | 11,043 | 12,299 |
| Saskatchewan | 5,014 | 5,398 | 7,397 | 10,393 |
| Alberta | 14,788 | 23,266 | 29,566 | 55,037 |
| British Columbia | 19,839 | 26,634 | 32,524 | 30,629 |
| Canada | 144,015 | 200,755 | 239,052 | 283,523 |
| Value of other unpaid household activities | ||||
| Newfoundland and Labrador | 2,852 | 3,642 | 4,919 | 5,827 |
| Prince Edward Island | 693 | 925 | 1,204 | 1,083 |
| Nova Scotia | 4,281 | 6,301 | 7,859 | 8,179 |
| New Brunswick | 4,030 | 5,079 | 6,144 | 5,589 |
| Quebec | 40,478 | 38,986 | 39,713 | 48,495 |
| Ontario | 48,863 | 79,598 | 99,025 | 108,048 |
| Manitoba | 5,227 | 7,723 | 9,642 | 11,350 |
| Saskatchewan | 4,290 | 6,054 | 7,385 | 10,061 |
| Alberta | 11,474 | 18,518 | 28,804 | 40,884 |
| British Columbia | 18,902 | 27,213 | 33,548 | 36,880 |
| Canada | 141,091 | 194,038 | 238,245 | 276,396 |
| Source: Author’s tabulation from Statistics Canada’s General Social Survey. | ||||
| Year | ||||
|---|---|---|---|---|
| 1998 | 2005 | 2010 | 2015 | |
| ratio | ||||
| Ratio of unpaid child care to GDP | ||||
| Newfoundland and Labrador | 0.21 | 0.15 | 0.13 | 0.15 |
| Prince Edward Island | 0.24 | 0.24 | 0.21 | 0.15 |
| Nova Scotia | 0.19 | 0.16 | 0.15 | 0.15 |
| New Brunswick | 0.19 | 0.18 | 0.16 | 0.15 |
| Quebec | 0.18 | 0.14 | 0.13 | 0.15 |
| Ontario | 0.13 | 0.15 | 0.16 | 0.13 |
| Manitoba | 0.18 | 0.19 | 0.21 | 0.19 |
| Saskatchewan | 0.17 | 0.12 | 0.12 | 0.13 |
| Alberta | 0.14 | 0.10 | 0.11 | 0.17 |
| British Columbia | 0.17 | 0.15 | 0.16 | 0.12 |
| Canada | 0.15 | 0.14 | 0.14 | 0.14 |
| Ratio of other unpaid household activities to GDP | ||||
| Newfoundland and Labrador | 0.25 | 0.16 | 0.17 | 0.19 |
| Prince Edward Island | 0.23 | 0.22 | 0.23 | 0.18 |
| Nova Scotia | 0.19 | 0.20 | 0.21 | 0.20 |
| New Brunswick | 0.22 | 0.20 | 0.20 | 0.17 |
| Quebec | 0.20 | 0.14 | 0.12 | 0.13 |
| Ontario | 0.13 | 0.14 | 0.16 | 0.14 |
| Manitoba | 0.16 | 0.18 | 0.18 | 0.17 |
| Saskatchewan | 0.14 | 0.13 | 0.12 | 0.13 |
| Alberta | 0.10 | 0.08 | 0.11 | 0.13 |
| British Columbia | 0.16 | 0.15 | 0.16 | 0.15 |
| Canada | 0.15 | 0.14 | 0.14 | 0.14 |
|
Note: GDP refers to gross domestic product. Source: Author’s tabulation from Statistics Canada’s General Social Survey. |
||||
The share of unpaid childcare and household production changed little over the period from 1998 to 2015. For this period, the value of unpaid childcare and that of other unpaid household production each amounted to about 14% to 15% of the GDP. The value of all unpaid household production (childcare and other household activities) was about 30% of the GDP in 2015. The ratio of unpaid childcare relative to the GDP was similar across the provinces for all the years. The ratio of other unpaid household production to the GDP was slightly higher in the four Atlantic provinces, although the difference may not be significant given the small sample size for those provinces.
The estimates in this paper are in line with previous estimates reported by Statistics Canada (1995). Statistics Canada (1995) estimated the value of unpaid household production at $234.5 billion in 1992 using the replacement cost approach, which was about 33% of the GDP that year. Harvey and Mukhopadhyay (2005) have also produced similar estimates for Canada (34% to 36% of the GDP in 1992).
The impact of Quebec’s low-cost childcare on women’s hours worked: A counter-factual analysis
The evidence above shows that low-cost childcare has led to an increase in the employment rate of women with children in Quebec, while its effect on the employment rate of men with children was negligible. This section presents an estimate of the impact of low-cost childcare on hours worked by women with children and on the imputed value of that increase in hours worked.
The assumption used for this paper is that an increase in the employment rate of women for the period from 1998 to 2015 in Quebec above the increase in the national average is attributable to the adoption of low-cost childcare in Quebec. That is, the counter-factual analysis adopted is if low-cost childcare in Quebec were not implemented, employment rates for women in Quebec would follow the trend at the national level. While there could be other factors that contributed to the divergent trend in employment rates in Quebec compared with the national average, they are assumed to have little overall effect. Empirical evidence by Baker et al. (2008) provided support for this hypothesis—they found that low-cost childcare led to the increase in the employment rate of women in Quebec.
Table 4 presents this paper’s estimates. If there had been no low-cost childcare and if the employment rate of women with children in Quebec followed the national trend, the employment rate would have been 74% in 2015. That year, the employment rate of women with children in Quebec was 80%, which represents a 7-percentage-point increase in the employment rate for this group. This increase in employment rate was attributed to the effect of low-cost childcare in Quebec. A similar increase in the employment rate of Quebec women was found in a number of previous studies (Baker et al., 2008; Lefebvre et al., 2009). Those studies found that low-fee childcare increased the employment rate of women by 7 to 9 percentage points (see Fortin et al. [2012] for a review of the evidence).
This increase in the employment rate translates to a 9% increase in annual hours worked for women with children in Quebec in 2015. When the average hourly compensation rate for women is used, this increase in hours worked is valued at $2.8 billion.
| Year | ||||
|---|---|---|---|---|
| 1998 | 2005 | 2010 | 2015 | |
| ratio | ||||
| Employment rate, actual | ||||
| Quebec | 0.50 | 0.60 | 0.66 | 0.80 |
| Canada | 0.52 | 0.62 | 0.65 | 0.75 |
| Employment rate in Quebec, without low-cost childcare | 0.50 | 0.61 | 0.64 | 0.74 |
| Increase in employment rate in Quebec attributable to low-cost childcare | Note ...: not applicable | -0.01 | 0.02 | 0.07 |
| number | ||||
| Number of Quebec women with children | 1,011 | 938 | 919 | 938 |
| Annual hours of paid jobs for Quebec women with children, actual, 000s | 796,993 | 918,106 | 986,149 | 1,134,741 |
| Annual hours of paid jobs for Quebec women with children, without low-cost childcare, 000s | 796,993 | 928,613 | 958,239 | 1,040,448 |
| Increase in hours of paid jobs in Quebec attributable to low-cost childcare, 000s | 0 | -10,507 | 27,910 | 94,293 |
| percent | ||||
| Increase in hours of paid jobs in Quebec attributable to low-cost childcare | 0.00 | -1.13 | 2.91 | 9.06 |
| Hourly compensation of Quebec, dollars per hour | 18.19 | 22.84 | 25.89 | 29.52 |
| number | ||||
| Increase in the value of paid jobs in Quebec attributable to low-cost childcare, dollars, 000s | Note ...: not applicable | -239,941 | 722,613 | 2,783,338 |
| GDP in Quebec, dollars, 000s | Note ...: not applicable | 258,485,995 | 305,484,665 | 357,758,778 |
| percent | ||||
| Increase in nominal GDP attributable to low-cost childcare | Note ...: not applicable | -0.09 | 0.24 | 0.78 |
|
... not applicable Note: GDP refers to gross domestic product. Source: Author’s tabulation from Statistics Canada’s General Social Survey. |
||||
Conclusion
This paper presented a time series estimate of hours on childcare provided by parents, together with other unpaid household activities and paid work in the Canadian provinces for the period from 1998 to 2015. These estimates were then used to infer the impact of low-cost childcare in Quebec on the employment rates of parents and on unpaid childcare provided by parents in Quebec—especially among mothers—and to assess the contribution of women and unpaid childcare to welfare and quality of life in Canada. The main findings of the paper are as follows.
First, the value of unpaid childcare in Canada was about $284 billion in 2015, which was about 15% of the country’s GDP that year. The value of other unpaid household production was similar, at $276 billion, or 15% of the GDP in 2015. The share of unpaid childcare and household production changed little over the period from 1998 to 2015, and the value of unpaid childcare and that of other unpaid household production each amounted to about 14% to 15% of the GDP. The value of all unpaid household production (including childcare and other household activities) was about 30% of the GDP in 2015.
Second, women accounted for a greater proportion of unpaid childcare and other household production than men. In 2015, women accounted for about 60% of hours spent on childcare and other household activities. The share of unpaid childcare and household production by women declined over time, while the share of paid employment rose over time.
Third, the study confirms previous findings that low-cost childcare in Quebec increased the employment rates of women and increased the use of paid childcare in Quebec. This paper finds that the employment rate of women with children increased faster in Quebec than in the other provinces after the implementation of the low-fee childcare system in Quebec. Estimates show that low-cost childcare increased the employment rate of women with children by 7 percentage points by 2015, which represents a 9% increase in the hours worked of women with children. That 9% increase in hours worked represents an additional $2.8 billion contribution to the GDP. There was also a higher use of childcare by parents in Quebec than in the other provinces, which is attributable to the low cost of childcare in Quebec.
Fourth, it could be or has been hypothesized that low-cost childcare may lead to a substitution of paid childcare for unpaid childcare provided by parents. This paper did not provide evidence in support of this hypothesis. While the number of hours of childcare provided by mothers in Quebec was lower than in the other provinces for the period from 1998 to 2015, that lower number of hours of unpaid childcare by Quebec mothers was also observed in 1993, before the implementation of the low-fee childcare system in Quebec. Furthermore, the trend in hours of unpaid childcare by mothers was similar in Quebec and the other provinces. They all increased at a similar rate.
There was little difference in the impact of low-cost childcare on employment rates and hours worked between immigrants and native-born Canadians, as well as between women in low-income and high-income households. That is, both immigrants and native-born Canadians, and low-income and high-income households saw higher employment rates after the adoption of low-cost childcare.
This paper shows the usefulness of the expanded measure of production that includes unpaid household production and a household production account. The expanded measure of production and the household production account provide a more comprehensive measure of welfare that can be used to examine the contribution of unpaid production and that from women to welfare. In addition, the household production account provides a framework that can be used to examine any potential shift in paid and unpaid production that may be related to family support programs, such as a childcare support program.
References
Baker, M., Gruber, J., & Milligan, K. (2008). Universal childcare, maternal labor supply and family well-being. Journal of Political Economy, 116(4), 709–745.
Besporstov, S., & Sinclair, A. (2022). Estimating the economic value of unpaid household work in Canada, 2015 to 2019 (Latest Developments in the Canadian Economic Accounts). Statistics Canada. https://www150.statcan.gc.ca/n1/pub/13-605-x/2022001/article/00001-eng.htm
Department of Finance. (2021). Budget 2021: A Canada-wide early learning and childcare plan.
Fortin, P. (2017). What have been the effects of Quebec’s universal childcare system on women’s economic security? Standing Committee on the Status of Women of the House of Commons.
Fortin, P., Godbout, L., & St-Cerny, S. (2012). Impact of Quebec’s universal low fee childcare program on female labour force participation, domestic income and government budgets [Unpublished paper].
Gee, K. F. (2015). Development of estimates for household production of non-market services in OECD countries for the index of economic well-being. Centre for the Study of Living Standards.
Harvey, A. S., & Mukhopadhyay, A. K. (2005). Household production in Canada: measuring and valuing outputs. In T. V. Hoa (Ed.), Advances in Household Economics, Consumer Behaviour and Economic Policy (pp. 70–84).
Kanal, D., & Kornegay, J. T. (2019). Accounting for household production in the National Accounts, an update, 1965–2017. Survey of Current Business. U.S. Bureau of Economic Analysis.
Kingsbury, M., & Findlay, L. (2021). Use of childcare before and after school in Canada. Statistics Canada. https://www150.statcan.gc.ca/n1/pub/36-28-0001/2021008/article/00004-eng.htm
Landefeld, J. S., Fraumeni, B. M., & Vojtech, C. M. (2009). Accounting for household production: A prototype satellite account using the American Time Use Survey. Review of Income and Wealth, 55(2), 205–225.
Lefebvre, P., Merrigan, P., & Verstraete, M. (2009). Dynamic labour supply effects of childcare subsidies: Evidence from a Canadian natural experiment on low-fee universal childcare. Labour Economics, 16(5), 490–502.
Moyser, M., & Milan, A. (2018). Fertility rates and labour force participation among women in Quebec and Ontario. Insights on Canadian Society. Statistics Canada. https://www150.statcan.gc.ca/n1/pub/75-006-x/2018001/article/54976-eng.htm
Payne, C., & Vassilev, G. (2018). Household satellite account, UK: 2015 and 2016. UK Office for National Statistics.
Schreyer, P., & Diewert, W. E. (2014). Household production, leisure, and living standards. In D. W. Jorgenson, J. S. Landefeld & P. Schreyer (Eds.), Measuring Economic Sustainability and Progress (pp. 89–114). University of Chicago Press.
Statistics Canada. (1995). Households’ unpaid work: measurement and valuation (Studies in National Accounting, No. 3).
UNECE. (2007). Guide on Valuing Unpaid Household Service Work.
- Date modified: