
Infographic: Homicide in Canada, 2020

Archived Content
Information identified as archived is provided for reference, research or recordkeeping purposes. It is not subject to the Government of Canada Web Standards and has not been altered or updated since it was archived. Please "contact us" to request a format other than those available.
Description: Infographic: Homicide in Canada, 2020
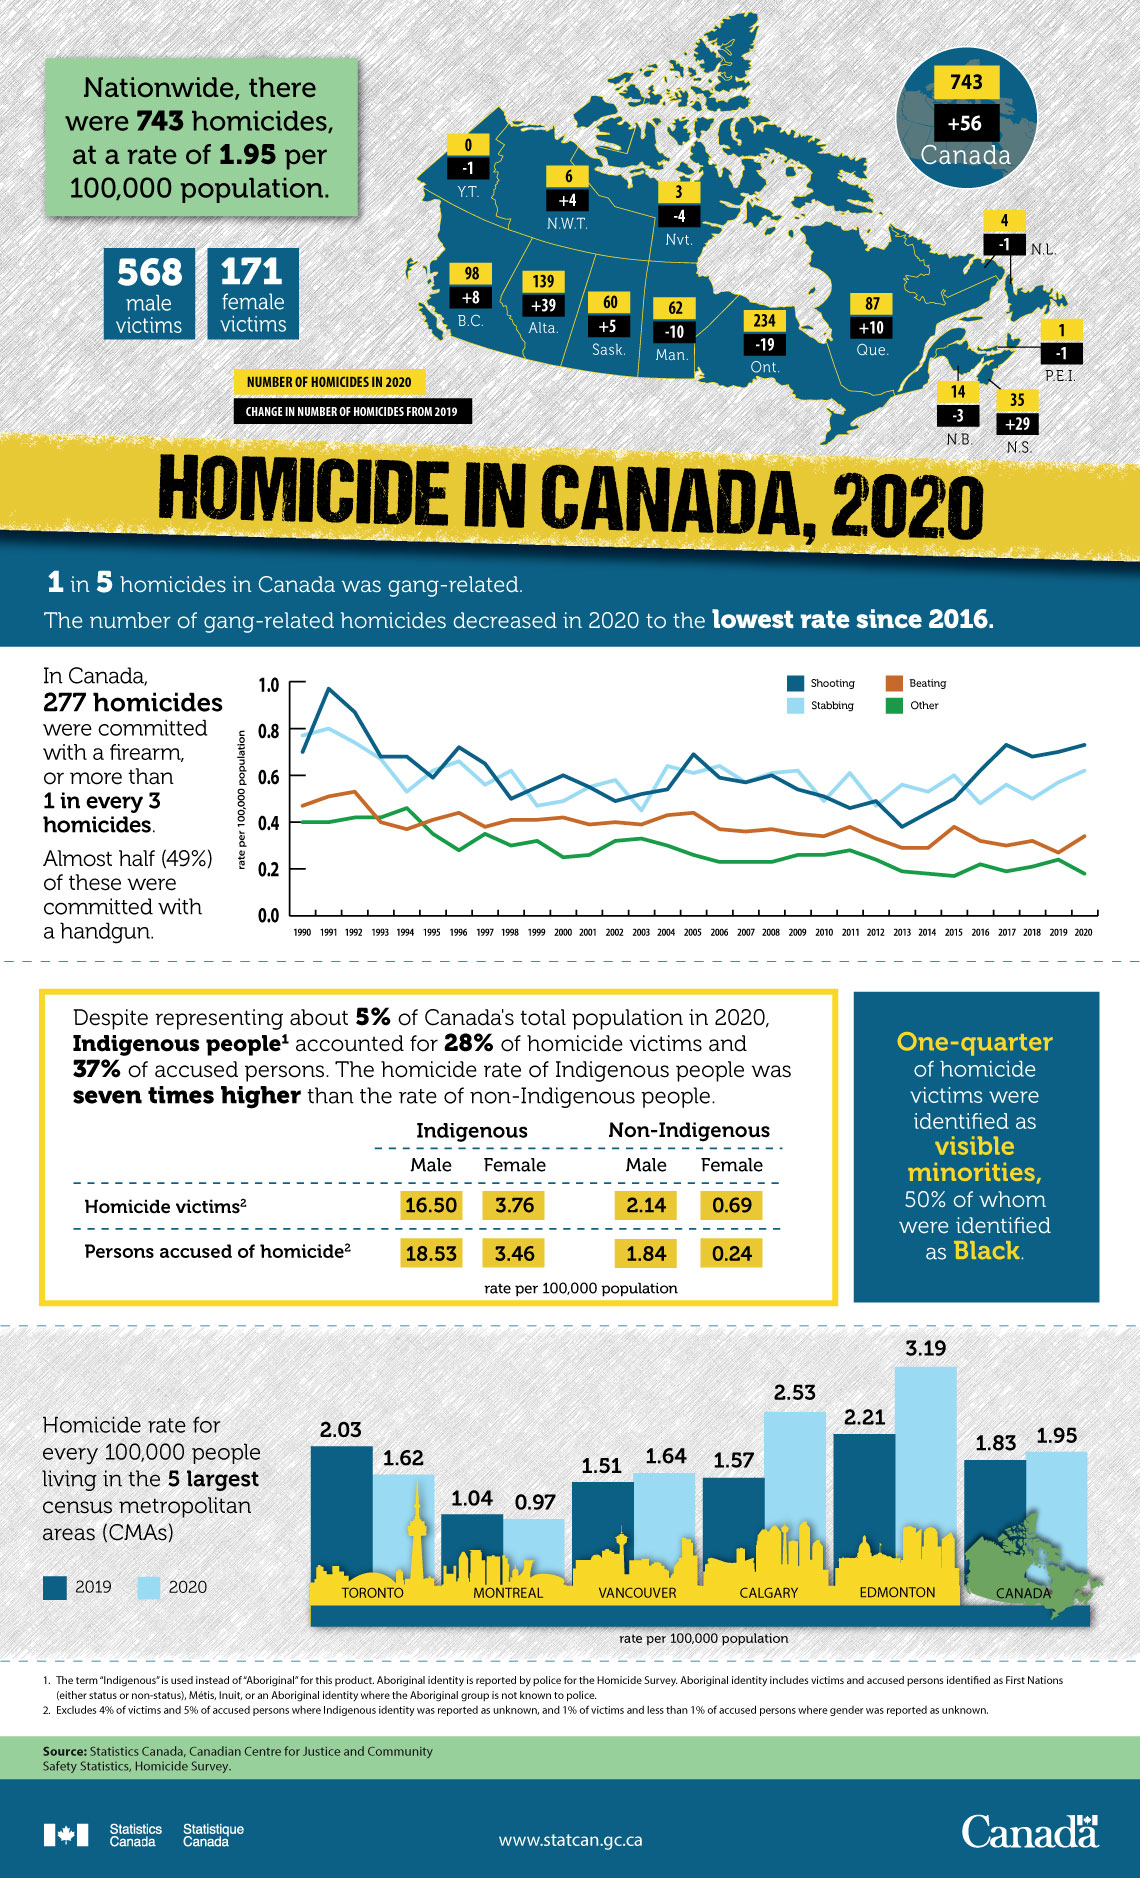
Nationwide, there were 743 homicides, at a rate of 1.95 per 100,000 population.
- 568 male victims
- 171 female victims
| Province or territory | Number of homicides in 2020 | Change in number of homicides from 2019 |
|---|---|---|
| Canada | 743 | 56 |
| Newfoundland and Labrador | 4 | -1 |
| Prince Edward Island | 1 | -1 |
| Nova Scotia | 35 | 29 |
| New Brunswick | 14 | -3 |
| Quebec | 87 | 10 |
| Ontario | 234 | -19 |
| Manitoba | 62 | -10 |
| Saskatchewan | 60 | 5 |
| Alberta | 139 | 39 |
| British Columbia | 98 | 8 |
| Yukon | 0 | -1 |
| Northwest Territories | 6 | 4 |
| Nunavut | 3 | -4 |
1 in 5 homicides in Canada was gang-related.
The number of gang-related homicides decreased in 2020 to the lowest rate since 2016.
In Canada, 277 homicides were committed with a firearm, or more than 1 in every 3 homicides. Almost half (49%) of these were committed with a handgun.
| Year | Method of death | |||
|---|---|---|---|---|
| Shooting | Stabbing | Beating | Other | |
| rate per 100, 000 population | ||||
| 1990 | 0.70 | 0.77 | 0.47 | 0.40 |
| 1991 | 0.97 | 0.80 | 0.51 | 0.40 |
| 1992 | 0.87 | 0.74 | 0.53 | 0.42 |
| 1993 | 0.68 | 0.67 | 0.40 | 0.42 |
| 1994 | 0.68 | 0.53 | 0.37 | 0.46 |
| 1995 | 0.59 | 0.62 | 0.41 | 0.35 |
| 1996 | 0.72 | 0.66 | 0.44 | 0.28 |
| 1997 | 0.65 | 0.56 | 0.38 | 0.35 |
| 1998 | 0.50 | 0.62 | 0.41 | 0.30 |
| 1999 | 0.55 | 0.47 | 0.41 | 0.32 |
| 2000 | 0.60 | 0.49 | 0.42 | 0.25 |
| 2001 | 0.55 | 0.55 | 0.39 | 0.26 |
| 2002 | 0.49 | 0.58 | 0.40 | 0.32 |
| 2003 | 0.52 | 0.45 | 0.39 | 0.33 |
| 2004 | 0.54 | 0.64 | 0.43 | 0.30 |
| 2005 | 0.69 | 0.61 | 0.44 | 0.26 |
| 2006 | 0.59 | 0.64 | 0.37 | 0.23 |
| 2007 | 0.57 | 0.57 | 0.36 | 0.23 |
| 2008 | 0.60 | 0.61 | 0.37 | 0.23 |
| 2009 | 0.54 | 0.62 | 0.35 | 0.26 |
| 2010 | 0.51 | 0.49 | 0.34 | 0.26 |
| 2011 | 0.46 | 0.61 | 0.38 | 0.28 |
| 2012 | 0.49 | 0.47 | 0.33 | 0.24 |
| 2013 | 0.38 | 0.56 | 0.29 | 0.19 |
| 2014 | 0.44 | 0.53 | 0.29 | 0.18 |
| 2015 | 0.50 | 0.60 | 0.38 | 0.17 |
| 2016 | 0.62 | 0.48 | 0.32 | 0.22 |
| 2017 | 0.73 | 0.56 | 0.30 | 0.19 |
| 2018 | 0.68 | 0.50 | 0.32 | 0.21 |
| 2019 | 0.70 | 0.57 | 0.27 | 0.24 |
| 2020 | 0.73 | 0.62 | 0.34 | 0.18 |
Despite representing about 5% of Canada’s total population in 2020, Indigenous peopleNote 1 accounted for 28% of homicide victims and 37% of accused persons. The homicide rate of Indigenous people was seven times higher than the rate of non-Indigenous people.
| Indigenous | Non-Indigenous | |||
|---|---|---|---|---|
| Male | Female | Male | Female | |
| rate per 100,000 population | ||||
| Homicide victimsNote 2 | 16.50 | 3.76 | 2.14 | 0.69 |
| Persons accused of homicideNote 2 | 18.53 | 3.46 | 1.84 | 0.24 |
One-quarter of homicide victims were identified as visible minorities, 50% of whom were identified as Black.
Homicide rate for every 100,000 people living in the 5 largest census metropolitan areas (CMAs)
| Census metropolitan area | Rate per 100,000 population – 2019 | Rate per 100,000 population – 2020 |
|---|---|---|
| Toronto | 2.03 | 1.62 |
| Montréal | 1.04 | 0.97 |
| Vancouver | 1.51 | 1.64 |
| Calgary | 1.57 | 2.53 |
| Edmonton | 2.21 | 3.19 |
| Canada | 1.83 | 1.95 |
Source: Statistics Canada, Canadian Centre for Justice and Community Safety Statistics, Homicide Survey.
- Date modified: