
Canadian farm operators: An educational portrait

Archived Content
Information identified as archived is provided for reference, research or recordkeeping purposes. It is not subject to the Government of Canada Web Standards and has not been altered or updated since it was archived. Please "contact us" to request a format other than those available.
Release date: November 27, 2018
Description: Canadian farm operators: An educational portrait
Canadian farm operators: An educational portrait
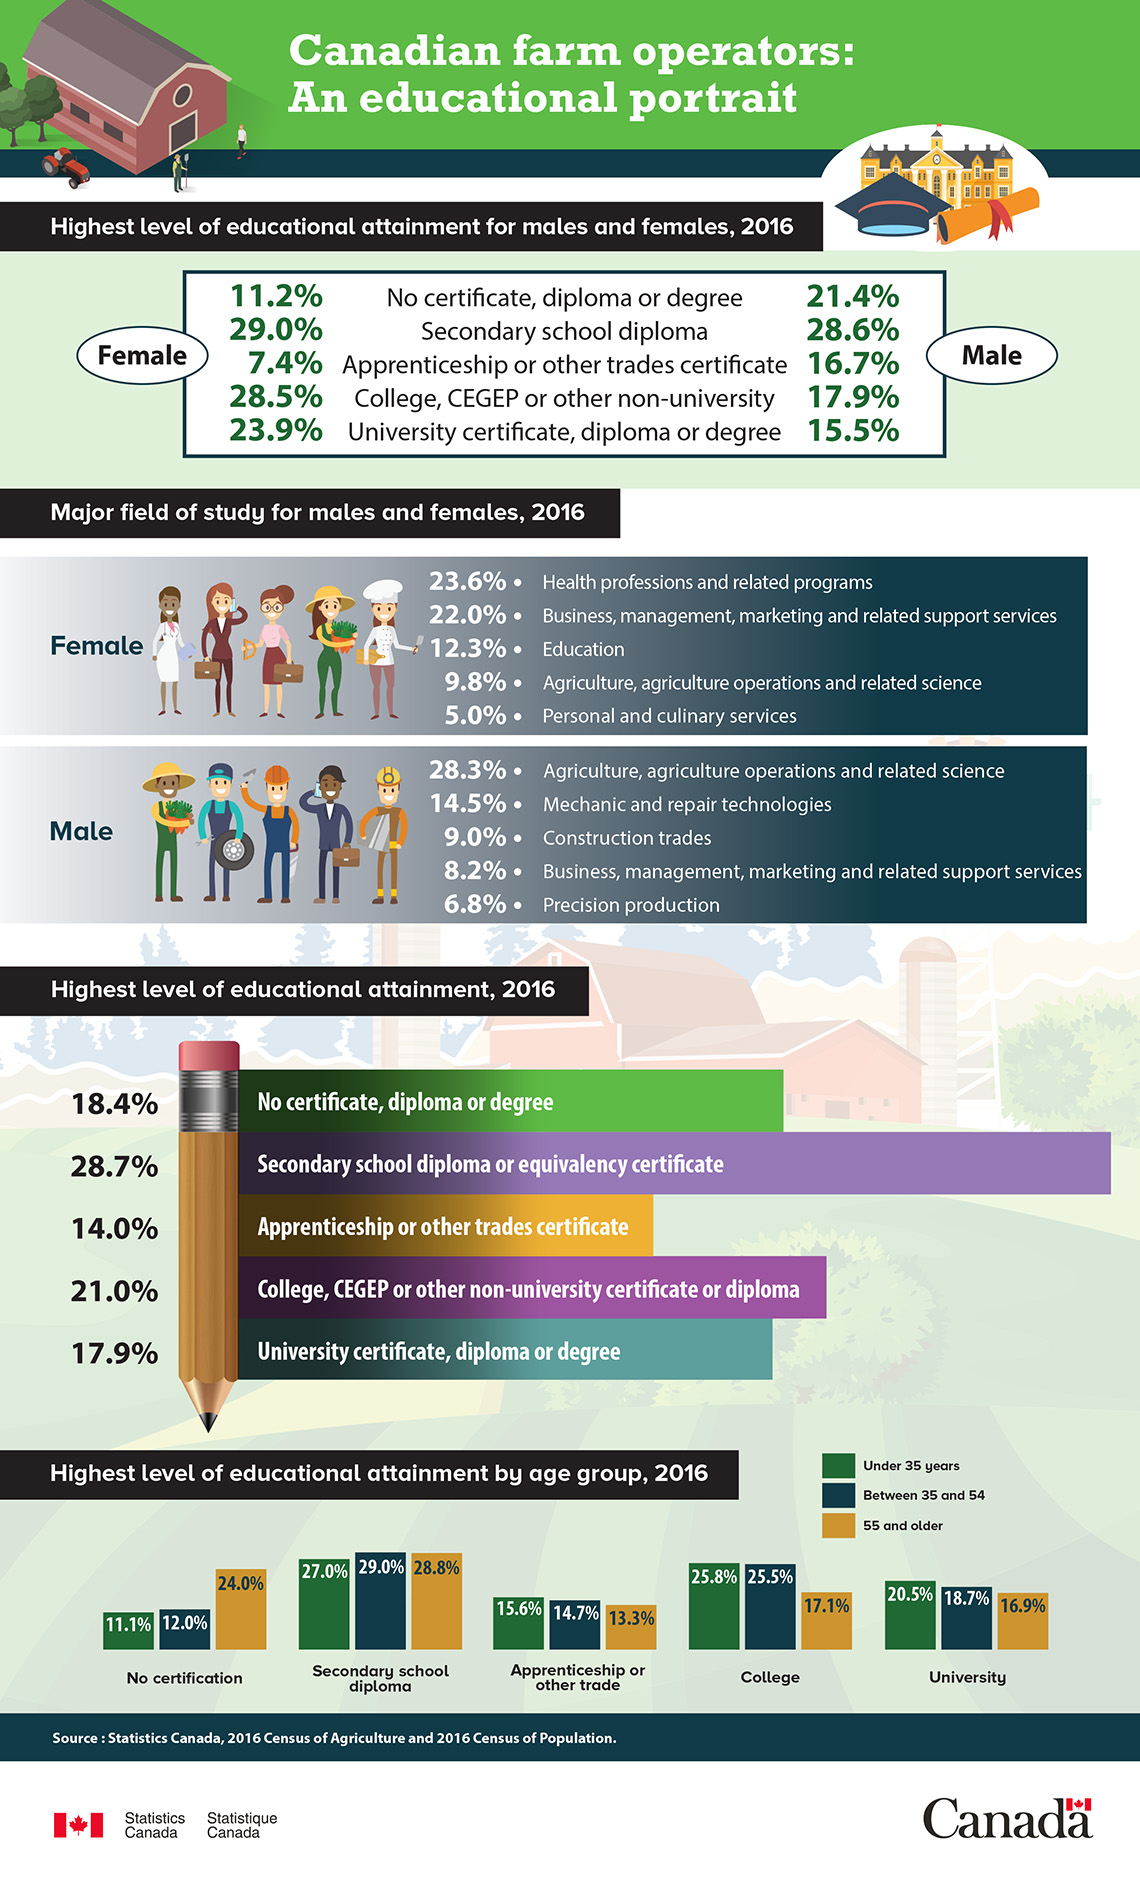
| Highest level of educational attainment | Female | Male |
|---|---|---|
| No certificate, diploma or degree | 11.2% | 21.4% |
| Secondary school diploma | 29.0% | 28.6% |
| Apprenticeship or other trades certificate | 7.4% | 16.7% |
| College, CEGEP or other non-university | 28.5% | 17.9% |
| University certificate, diploma or degree | 23.9% | 15.5% |
| Major field of study | Percentage |
|---|---|
| Health professions and related programs | 23.6% |
| Business, management, marketing and related support services | 22.0% |
| Education | 12.3% |
| Agriculture, agriculture operations and related science | 9.8% |
| Personal and culinary services | 5.0% |
| Major field of study | Percentage |
|---|---|
| Agriculture, agriculture operations and related science | 28.3% |
| Mechanic and repair technologies | 14.5% |
| Construction trades | 9.0% |
| Business, management, marketing and related support services | 8.2% |
| Precision production | 6.8% |
| Highest level of educational attainment | Percentage |
|---|---|
| No certificate, diploma or degree | 18.4% |
| Secondary school diploma or equivalency certificate | 28.7% |
| Apprenticeship or other trades certificate | 14.0% |
| College, CEGEP or other non-university certificate or diploma | 21.0% |
| University certificate, diploma or degree | 17.9% |
| Age | No certification | Secondary school diploma | Apprenticeship or other trade | College | University |
|---|---|---|---|---|---|
| Under 35 years | 11.1% | 27.0% | 15.6% | 25.8% | 20.5% |
| Between 35 and 54 | 12.0% | 29.0% | 14.7% | 25.5% | 18.7% |
| 55 and older | 24.0% | 28.8% | 13.3% | 17.1% | 16.9% |
Source: Statistics Canada, 2016 Census of Agriculture and 2016 Census of Population.
- Date modified: