
Analysis in Brief
Chipping away at economic growth: Jobs, gross domestic product, and research in the semiconductor industry
Skip to text
Text begins
Executive summary
Information technology continues to grow as a critical component in various industries, from consumer goods to national security. Along with this importance is the need for reliable supply chains and the ability to customize semiconductor technologies. The COVID-19 pandemic in 2020 only added to the surge in demand for technology, particularly as it related to remote work, virtual healthcare, and online learning.
This research study examines the economic impact of the semiconductor industry in Canada in 2020 as it relates to several economic concepts, such as sales and revenue, employment, research and development, and international trade. The study is based on a custom list of 561 firms in the industry provided by Innovation, Science and Economic Development Canada.
The results of the study underscore the sector’s important contribution to the overall Canadian economy, which is shown through the value-added (gross domestic product) produced by the industry. In 2020, the sector generated a total of $28.8 billion in total output, of which, $16.3 billion was value added to the Canadian economy beyond the value of raw materials and other inputs used in the production process.
The results also highlight the sector’s reliance on international trade, importing $7.3 billion worth of goods into Canada, while exporting $3.4 billion worth of goods. As well, the sector contributed $10.7 billion of labour income to Canadians’ livelihoods, accounting for 124,000 FTE direct, indirect, and induced jobs. Lastly, the study shines a lens on the sector’s strong focus on research and development, which companies undertake to stay competitive in domestic and global markets. In 2020, the sector invested $1.8 billion in in-house research and development and $96.0 million in outsourced research and development.
Introduction
Information technology plays a critical role in Canada’s economy and in the lives of Canadians. It touches all industries, from manufacturing to defense, and the products and services that Canadians use, such as telecommunications and personal devices.
The Covid-19 pandemic sparked a significant increase in the demand for technology that allows for remote work, virtual healthcare, and online learning. Canada’s response to these demands has been hampered by shortages of semiconductor chips which hindered the production of goods and services. At the same time, Canada has seen a small market share compared to other countries with well-established semiconductor manufacturing.Note Given these and other challenges, there is an increasing focus on strengthening supply chains in the semiconductor industry in Canada.
This study, commissioned by Innovation, Science and Economic Development Canada (ISED) and produced by the Investment, Science and Technology Division of Statistics Canada, aims to provide valuable insight into the economic impact that the semiconductor industry has on the Canadian economy, using data for a cohort of 561 firms – of which over one hundred are fablessNote – for 2020. The creation of this cohort was necessary because the North American Industrial Classification System (NAICS) does not account for organizations that engage in activities related to semiconductors but whose primary operations fall under a different NAICS. Including this portion thus allows for a more composite view of the sector. The findings from the study are presented at both the national and provincial levels and are based on several key economic indicators, such as sales and revenue, value-added (gross domestic product), employment, R&D activities (in-house and outsourced), and international trade.
151 multinational enterprises (MNEs) are included in this study, with over two-thirds being foreign controlled in 2020. MNEs tend to be large and diversified, with global operations outside of Canada. The study only includes Canadian business activities of MNEs and excludes foreign business activities. Even though this study is focused on Canadian activities of semiconductor related companies, it also necessarily incorporates business activities not directly related to semiconductors. Additional information regarding the population can be found in the appendix.
Analyzing key economic indicators will provide for a deeper understanding of the sector’s impacts which may aid in forming policy decisions and facilitate further innovation within the industry.
Canadian semiconductor industry
Economic footprint
The economic impacts related to the Canadian semiconductor industry are best examined through the lens of direct, indirect, and induced effects.
Direct impacts on the national economy can be observed through an industry’s own production activities, such as the value of goods and services produced. Indirect economic impacts capture the economic activity generated by businesses that supply goods and services to the sector, such as companies that provide raw materials, or equipment manufacturers. Finally, induced economic impacts result from the increased income and spending of the people who benefit directly or indirectly from the sector. For example, workers in the sector who have more disposable income because of their jobs in the sector may spend more money in their local communities. This would have an induced impact on local businesses.
Value-added
The direct, indirect, and induced impacts of the sector together produce an overall impact that can be analyzed in terms of output and Gross Value-Added (GVA). An industry’s output is a measure of the goods and services it produces. In the case of the Canadian Semiconductor industry, this includes semiconductor chips and other electronic components manufactured in the country as well as their design and specifications.
GVA differs from output in that it removes input costs, such as raw materials, used to produce goods and services. In other words, it quantifies the value added to raw materials and inputs by the production process. For the Canadian semiconductor industry, this could include the value added to raw materials such as silicon through their transformation into microchips, as well as the value added by labour to other inputs used in manufacturing. Unlike output, GVA does not duplicate the value added by companies earlier in the supply chain, which is why GVA is often used to measure an industry’s contribution to the national economy.
Sector responsible for $16.3 billion in value added to the Canadian Economy
In 2020, the Canadian semiconductor industry generated $28.8 billion in total output. Nearly three-fifths of this output ($16.3 billion) was value added by the sector. Of this total impact, slightly more than half ($8.6 billion) was generated directly through the sector’s production activities. A further $3.5 billion was generated through indirect effects, while $4.2 billion was induced through workers spending in their local communities.

Data table for Figure 1
| Economic Indicator | Impact | Millions of dollars |
|---|---|---|
| Output | Direct Impact | 15,206 |
| Indirect Impact | 6,386 | |
| Induced Impact | 7,167 | |
| Gross Value Added | Direct Impact | 8,638 |
| Indirect Impact | 3,491 | |
| Induced Impact | 4,177 | |
|
Note: Canadian semiconductor industry. The sector had an overall output of $28.8 billion and a GVA of $16.3 billion in 2020. Source: Statistics Canada, custom tabulation, Industry Accounts Division, reference year 2020. |
||
The greater value attributed to induced impacts over indirect impacts implies that the sector’s economic activity has a greater impact on the local community (through increased income and spending by those employed in the sector), than it has on companies in the sector’s supply chain. It is difficult to precisely explain why this might be the case without historical sector data. However, as shown below, it may be tied to the sector’s heavy reliance on imports, which means that intermediate inputs (such as raw materials, machinery, or other goods) are not sourced from within the region where the indirect impacts are being measured (i.e., within Canada). Another possibility is that Covid-19 may have led to more spending in e-commerce, and on home delivery which pushed up the induced impacts of those employed in the sector.
GVA can also be used to calculate the sector’s contribution to Canada’s Gross Domestic Product (GDP), which is a measure of the total value of all goods and services produced within the country. By combining the sector’s GVA with its net indirect taxes (which represent the value of goods and services produced by foreign companies with the country)Note , the sector accounted for approximately 0.7% of Canada’s GDP at basic prices in 2020.Note
Data table for Figure 2
| Geography | Impact | Millions of dollars |
|---|---|---|
| Ontario | Total Impact | 10,241 |
| Direct Impact | 5,655 | |
| Indirect Impact | 2,055 | |
| Induced Impact | 2,531 | |
| Quebec | Total Impact | 2,854 |
| Direct Impact | 1,470 | |
| Indirect Impact | 700 | |
| Induced Impact | 684 | |
| British Columbia | Total Impact | 1,441 |
| Direct Impact | 699 | |
| Indirect Impact | 315 | |
| Induced Impact | 427 | |
| Alberta | Total Impact | 929 |
| Direct Impact | 406 | |
| Indirect Impact | 236 | |
| Induced Impact | 287 | |
| New Brunswick and Nova Scotia | Total Impact | 370 |
| Direct Impact | 190 | |
| Indirect Impact | 82 | |
| Induced Impact | 96 | |
| Saskatchewan | Total Impact | 257 |
| Direct Impact | 145 | |
| Indirect Impact | 44 | |
| Induced Impact | 69 | |
| Manitoba | Total Impact | 189 |
| Direct Impact | 73 | |
| Indirect Impact | 48 | |
| Induced Impact | 68 | |
| Newfoundland and Labrador | Total Impact | 14 |
| Direct Impact | 0 | |
| Indirect Impact | 6 | |
| Induced Impact | 8 | |
| Prince Edward Island | Total Impact | 6 |
| Direct Impact | 0 | |
| Indirect Impact | 2 | |
| Induced Impact | 4 | |
| Northwest Territories | Total Impact | 3 |
| Direct Impact | 0 | |
| Indirect Impact | 1 | |
| Induced Impact | 1 | |
| Yukon | Total Impact | 1 |
| Direct Impact | 0 | |
| Indirect Impact | 1 | |
| Induced Impact | 1 | |
| Nunavut | Total Impact | 1 |
| Direct Impact | 0 | |
| Indirect Impact | 1 | |
| Induced Impact | 1 | |
|
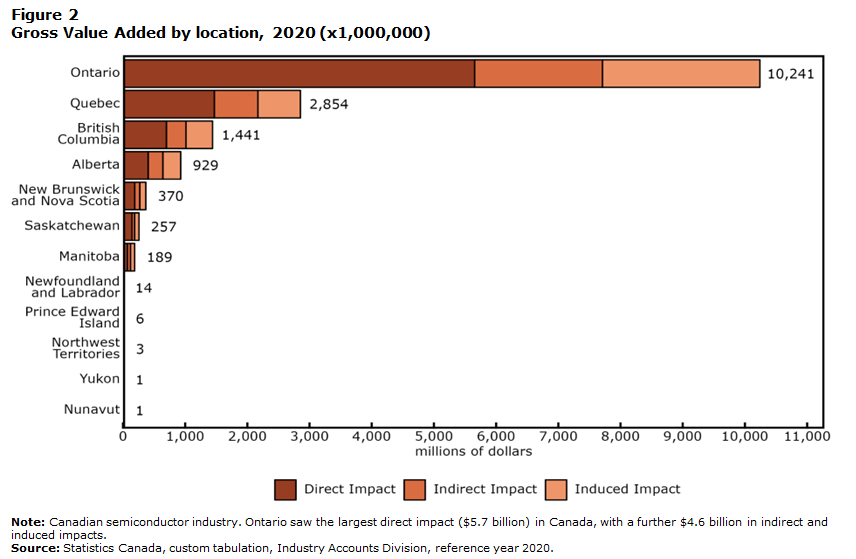
Note: Canadian semiconductor industry. Ontario saw the largest direct impact ($5.7 billion) in Canada, with a further $4.6 billion in indirect and induced impacts. Source: Statistics Canada, custom tabulation, Industry Accounts Division, reference year 2020. |
||
Sector’s value-added anchored by Ontario’s $10.2 billion contribution
Breaking down GVA at a regional level (e.g., provinces and territories) allows for a deeper analysis of the characteristics and strengths of those regions.Note Geographically, the Canadian semiconductor industry is highly centralized in Ontario, which accounted for 62.8% (or $10.2 billion) of the total GVA generated by the sector, and 65.5% of the GVA generated through direct impacts. Quebec ($2.9 billion), British Columbia ($1.4 billion), and Alberta ($0.9 billion) also accounted for a significant amount of total GVA generated, though the combined total impact of these three provinces ($5.2 billion) was less than the sector’s direct impacts in Ontario ($5.7 billion).
Comparing the sector’s GVA in Ontario to its share of Canadian GDP further highlights the high concentration of economic impacts in the province. While around two-fifths of Canada’s GDP was in Ontario in 2020Note , 62.8% of the semiconductor industry’s total impact occurred in the province.Note
Financial Statistics
Sector lost nearly $900 million in 2020, but had $1.9 billion in inventories on hand
In 2020, the semiconductor industry had an operating revenue of $19.4 billion. Almost all of the sector’s revenue ($19.2 billion) was generated through the sale of goods and services. During this period, the sector also generated $20.3 billion in expenses through its operations. The largest expense incurred was purchased goods, materials, and services, which accounted for nearly seven-tenths ($14.0 billion) of all expenses. The majority of the remaining expenses ($5.3 billion) were tied to the payment of wages, salaries, and employee benefits. On an overall basis, the sector experienced an operating loss of $893 million.
The sector also had $1.9 billion dollars of inventory on hand at the end of the year, which contributed to the sector’s operating loss. The magnitude of this inventory indicates that the sector had an excess supply of unsold goods on hand, which was likely brought on by the Covid-19 pandemic restrictions. Additionally, disruptions related to the pandemic may have also decreased the sector’s ability to fulfill the demand for its goods and services.
Employment
The Canadian Semiconductor sector is a key employer in Canada as it supported 123,694 full-time equivalent (FTE) jobs in 2020. Of this total, over half (69,494 FTE) of these jobs were tied to employees directly employed in the sector. The indirect effects on employment, which are based on the sector’s interaction with other industries in its supply chain, accounted for 26,494 FTE jobs. Finally, the induced effects of labour income generated by workers led to 27,706 FTE jobs.
Just as with GVA, the majority (61.6%) of jobs generated through the sector’s activities were in Ontario.
Labour income from employment also serves as an important determinant of a sector’s economic impact as workers’ spending creates induced economic impacts in their local communities. In total, the sector generated $10.7 billion of labour income in Canada in 2020. Three-fifths of this income ($6.5 billion) was generated directly by the sector’s activity, with indirect activities ($2.2 billion) and induced activities ($2.0 billion) contributing the remainder.

Data table for Figure 3
| Impact | Labour Income | Jobs |
|---|---|---|
| millions of dollars | Full-time Equivalents | |
| Direct Impact | 6,504 | 69,494.08 |
| Indirect Impact | 2,200 | 26,493.56 |
| Induced Impact | 1,956 | 27,705.91 |
|
Note: Canadian semiconductor industry. The sector had a total of 123,694 full-time Equivalents (FTE) jobs and $10.7 billion of labour income in 2020. Source: Statistics Canada, custom tabulation, Industry Accounts Division, reference year 2020. |
||
The ratio of labour income to jobs provides another dimension for gaining insight into an industry’s well-being, with a higher ratio indicating that each job generates more income. Jobs created directly by the sector had the highest average labour income, around $94,000, while the average income for indirect jobs (around $83,000) and induced jobs (around $71,000) was lower. This difference may be a by-product of a competitive labour market for employees in the semiconductor sector.
Trade
Despite global trade restrictions brought on by the Covid-19 pandemic, the semiconductor industry was heavily engaged in international trade in 2020, with over three-fifths of enterprises exporting goods and more than three-quarters importing goods. Exporting companies shipped their goods to 137 countries while those importing received goods from 126 countries.
The sector exported $3.4 billion globally in 2020, representing around three-quarters of a percent of the total goods exported from Canada.Note Additionally, two-thirds of enterprises that engaged in export activities sent goods to two or more countries.
Data table for Figure 4
| Region | Millions of dollars |
|---|---|
| United States | 2,109 |
| Asia and Oceania | 882 |
| Europe | 348 |
| Americas (Excluding USA) | 92 |
| Africa | 17 |
|
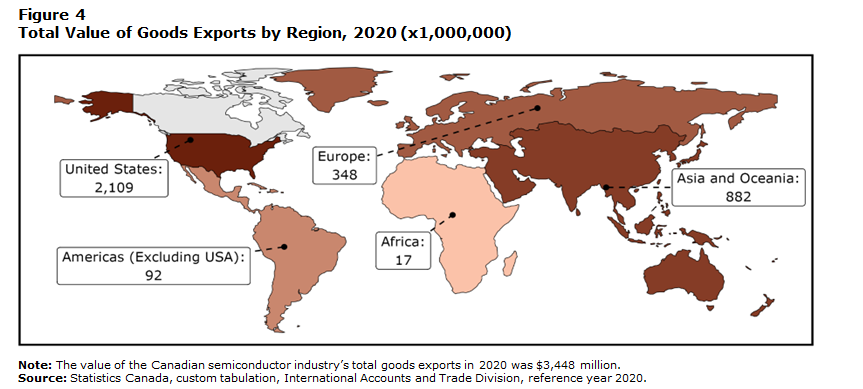
Note: The value of the Canadian semiconductor industry’s total goods exports in 2020 was $3,448 million. Source: Statistics Canada, custom tabulation, International Accounts and Trade Division, reference year 2020. |
|
More than three-fifths of all exports were to the United States
The United States was the primary destination for the majority of the sector’s exports. At $2.1 billion, exports to the United States accounted for 61.2% of all exports. Most of the remaining exports were sent to Europe ($348 million), particularly Germany ($104 million), or Asia and Oceania ($882 million) with less than 3.2% going to the rest of the world. Among Asian countries, Hong Kong ($178 million), China ($159 million), Singapore ($156 million), Japan ($87 million) and Korea ($81 million) saw the largest amount of export activity.

Data table for Figure 5
| HS2 Chapter | HS4 Chapter | Description | Millions of dollars |
|---|---|---|---|
| 84 | HS 84 | Nuclear Reactors, Boilers, Machinery and Mechanical Appliances; Parts Thereof | 559 |
| 85 | HS 85.04 | Electrical Transformers, Static Converters (For Example, Rectifiers) and Inductors. | 48 |
| HS 85.17 | Telephone Sets, Including Telephones For Cellular Networks or For Other Wireless Networks; Other Apparatus For The Transmission or Reception of Voice, Images or Other Data, Including Apparatus For Communication in A Wired or Wireless Network (Such As A Local or Wide Area Network), Other Than Transmission or Reception Apparatus of Heading 84.43, 85.25, 85.27 or 85.28. | 314 | |
| HS 85.25 | Transmission Apparatus For Radio-Broadcasting or Television, Whether or Not Incorporating Reception Apparatus or Sound Recording or Reproducing Apparatus; Television Cameras, Digital Cameras and Video Camera Recorders. | 124 | |
| HS 85.34 | Printed Circuits | 166 | |
| HS 85.36 | Electrical Apparatus For Switching or Protecting Electrical Circuits, or For Making Connections To or in Electrical Circuits (For Example, Switches, Relays, Fuses, Surge Suppressors, Plugs, Sockets, Lamp-Holders and Other Connectors, Junction Boxes), For A Voltage Not Exceeding 1,000 Volts; Connectors For Optical Fibres, Optical Fibre Bundles or Cables. | 62 | |
| HS 85.37 | Boards, Panels, Consoles, Desks, Cabinets and Other Bases, Equipped With Two or More Apparatus of Heading 85.35 or 85.36, For Electric Control or The Distribution of Electricity, Including Those Incorporating Instruments or Apparatus of Chapter 90, and Numerical Control Apparatus, Other Than Switching Apparatus of Heading 85.17. | 59 | |
| HS 85.41 | Diodes, Transistors and Similar Semiconductor Devices; Photosensitive Semiconductor Devices, Including Photovoltaic Cells Whether or Not Assembled in Modules or Made Up Into Panels; Light-Emitting Diodes (Led); Mounted Piezo-Electric Crystals. | 162 | |
| HS 85.42 | Electronic Integrated Circuits. | 759 | |
| HS 85.44 | Insulated (Including Enamelled or Anodized) Wire, Cable (Including Co-Axial Cable) and Other Insulated Electric Conductors, Whether or Not Fitted With Connectors; Optical Fibre Cables, Made Up of Individually Sheathed Fibres, Whether or Not Assembled With Electric Conductors or Fitted With Connectors. | 64 | |
| Other HS2 85 Codes | Note ..: not available for a specific reference period | 162 | |
| 90 | HS 90 | Optical, Photographic, Cinematographic, Measuring, Checking, Medical or Surgical Instruments and Apparatus; Parts and Accessories | 761 |
| Other | All Other HS2 Chapters | Note ..: not available for a specific reference period | 207 |
|
.. not available for a specific reference period Notes: HS 84: Nuclear Reactors, Boilers, Machinery and Mechanical Appliances; Parts Thereof. HS 85.04: Electrical Transformers, Static Converters (For Example, Rectifiers) and Inductors. HS 85.17: Telephone Sets, Including Telephones For Cellular Networks or For Other Wireless Networks; Other Apparatus For The Transmission or Reception of Voice, Images or Other Data, Including Apparatus For Communication in A Wired or Wireless Network (Such As A Local or Wide Area Network), Other Than Transmission or Reception Apparatus of Heading 84.43, 85.25, 85.27 or 85.28. HS 85.25: Transmission Apparatus For Radio-Broadcasting or Television, Whether or Not Incorporating Reception Apparatus or Sound Recording or Reproducing Apparatus; Television Cameras, Digital Cameras and Video Camera Recorders. HS 85.34: Printed Circuits. HS 85.36: Electrical Apparatus For Switching or Protecting Electrical Circuits, or For Making Connections To or in Electrical Circuits (For Example, Switches, Relays, Fuses, Surge Suppressors, Plugs, Sockets, Lamp-Holders and Other Connectors, Junction Boxes), For A Voltage Not Exceeding 1,000 Volts; Connectors For Optical Fibres, Optical Fibre Bundles or Cables. HS 85.37: Boards, Panels, Consoles, Desks, Cabinets and Other Bases, Equipped With Two or More Apparatus of Heading 85.35 or 85.36, For Electric Control or The Distribution of Electricity, Including Those Incorporating Instruments or Apparatus of Chapter 90, and Numerical Control Apparatus, Other Than Switching Apparatus of Heading 85.17. HS 85.41: Diodes, Transistors and Similar Semiconductor Devices; Photosensitive Semiconductor Devices, Including Photovoltaic Cells Whether or Not Assembled in Modules or Made Up Into Panels; Light-Emitting Diodes (Led); Mounted Piezo-Electric Crystals. HS 85.42: Electronic Integrated Circuits. HS 85.44: Insulated (Including Enamelled or Anodized) Wire, Cable (Including Co-Axial Cable) and Other Insulated Electric Conductors, Whether or Not Fitted With Connectors; Optical Fibre Cables, Made Up of Individually Sheathed Fibres, Whether or Not Assembled With Electric Conductors or Fitted With Connectors. HS 90: Optical, Photographic, Cinematographic, Measuring, Checking, Medical or Surgical Instruments and Apparatus; Parts and Accessories The value of the Canadian semiconductor industry’s total goods exports in 2020 was $3,448 million. Source: Statistics Canada, custom tabulation, International Accounts and Trade Division, reference year 2020. |
|||
About half ($1.9 billion, 55.7%) of all exported goods fell under Chapter 85 of the Canadian Export Classification, which covers electrical machinery and equipment and parts thereof.Note Nearly four-tenths of all Chapter 85 exports were classified as 85.42 (electronic integrated circuits), accounting for $759 million. A further four-tenths of Chapter 85 exports were classified in 85.17 (telephone sets), 85.34 (printed circuits), 85.41 (diodes, transistors, and similar semiconductor devices), and 85.25 (radio or TV transmission apparatus), with exports among the groupings ranging between $124 million and $314 million.
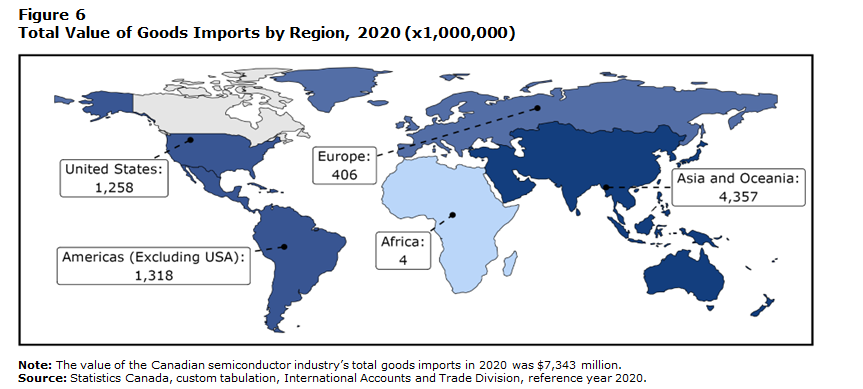
Six-tenths of the sector’s imports originated from Asia and Oceania
The semiconductor industry imported $7.3 billion of goods in 2020, which was more than twice as much as the $3.4 billion that it exported. While most of these imports originated in Asia and Oceania ($4.4 billion), nearly one-fifth ($1.3 billion) of imports originated in the Americas (excluding the United States) with most of it coming from Mexico ($1.2 billion). The United States was the origin for an additional $1.3 billion of imports by the industry.
Data table for Figure 6
| Region | Millions of dollars |
|---|---|
| Asia and Oceania | |
| Americas (Excluding USA) | |
| United States | |
| Europe | |
| Africa | |
|
Note: The value of the Canadian semiconductor industry’s total goods imports in 2020 was $7,343 million. Source: Statistics Canada, custom tabulation, International Accounts and Trade Division, reference year 2020. |
|
Nearly three-quarters ($5.3 billion, 71.8%) of the goods imported by the semiconductor industry are part of Chapter 85, which (as outlined above) covers electrical machinery and equipment and parts. Around one-quarter of all imported Chapter 85 goods were classified in 85.41 (diodes, transistors, and similar semiconductor devices), 85.42 (electronic integrated circuits), 85.36 (electrical apparatus for switching or protecting electrical circuits) and 85.34 (printed circuits), with sales among the groupings ranging between $124 million and $302 million.

Data table for Figure 7
| HS2 Chapter | HS4 Chapter | Description | Millions of dollars |
|---|---|---|---|
| 84 | HS 84 | Nuclear Reactors, Boilers, Machinery and Mechanical Appliances; Parts Thereof | 1,188 |
| 85 | HS 85.04 | Electrical Transformers, Static Converters (For Example, Rectifiers) and Inductors. | 75 |
| HS 85.32 | Electrical Capacitors, Fixed, Variable or Adjustable (Pre-Set). | 27 | |
| HS 85.33 | Electrical Resistors (Including Rheostats and Potentiometers), Other Than Heating Resistors. | 12 | |
| HS 85.34 | Printed Circuits | 186 | |
| HS 85.36 | Electrical Apparatus For Switching or Protecting Electrical Circuits, or For Making Connections To or in Electrical Circuits (For Example, Switches, Relays, Fuses, Surge Suppressors, Plugs, Sockets, Lamp-Holders and Other Connectors, Junction Boxes), For A Voltage Not Exceeding 1,000 Volts; Connectors For Optical Fibres, Optical Fibre Bundles or Cables. | 124 | |
| HS 85.38 | Parts Suitable For Use Solely or Principally With The Apparatus of Heading 85.35, 85.36 or 85.37. | 19 | |
| HS 85.41 | Diodes, Transistors and Similar Semiconductor Devices; Photosensitive Semiconductor Devices, Including Photovoltaic Cells Whether or Not Assembled in Modules or Made Up Into Panels; Light-Emitting Diodes (Led); Mounted Piezo-Electric Crystals. | 302 | |
| HS 85.42 | Electronic Integrated Circuits. | 863 | |
| HS 85.43 | Electrical Machines and Apparatus, Having Individual Functions, Not Specified or Included Elsewhere in This Chapter. | 16 | |
| HS 85.44 | Insulated (Including Enamelled or Anodized) Wire, Cable (Including Co-Axial Cable) and Other Insulated Electric Conductors, Whether or Not Fitted With Connectors; Optical Fibre Cables, Made Up of Individually Sheathed Fibres, Whether or Not Assembled With Electric Conductors or Fitted With Connectors. | 78 | |
| Other HS2 85 Codes | Note ..: not available for a specific reference period | 3,572 | |
| 90 | HS 90 | Optical, Photographic, Cinematographic, Measuring, Checking, Medical or Surgical Instruments and Apparatus; Parts and Accessories | 332 |
| Other | All Other HS2 Chapters | Note ..: not available for a specific reference period | 548 |
|
.. not available for a specific reference period Notes: HS 84: Nuclear Reactors, Boilers, Machinery and Mechanical Appliances; Parts Thereof. HS 85.04: Electrical Transformers, Static Converters (For Example, Rectifiers) and Inductors. HS 85.32: Electrical Capacitors, Fixed, Variable or Adjustable (Pre-Set). HS 85.33: Electrical Resistors (Including Rheostats and Potentiometers), Other Than Heating Resistors. HS 85.34: Printed Circuits. HS 85.36: Electrical Apparatus For Switching or Protecting Electrical Circuits, or For Making Connections To or in Electrical Circuits (For Example, Switches, Relays, Fuses, Surge Suppressors, Plugs, Sockets, Lamp-Holders and Other Connectors, Junction Boxes), For A Voltage Not Exceeding 1,000 Volts; Connectors For Optical Fibres, Optical Fibre Bundles or Cables. HS 85.38: Parts Suitable For Use Solely or Principally With The Apparatus of Heading 85.35, 85.36 or 85.37. HS 85.41: Diodes, Transistors and Similar Semiconductor Devices; Photosensitive Semiconductor Devices, Including Photovoltaic Cells Whether or Not Assembled in Modules or Made Up Into Panels; Light-Emitting Diodes (Led); Mounted Piezo-Electric Crystals. HS 85.42: Electronic Integrated Circuits. HS 85.43: Electrical Machines and Apparatus, Having Individual Functions, Not Specified or Included Elsewhere in This Chapter. HS 85.44: Insulated (Including Enamelled or Anodized) Wire, Cable (Including Co-Axial Cable) and Other Insulated Electric Conductors, Whether or Not Fitted With Connectors; Optical Fibre Cables, Made Up of Individually Sheathed Fibres, Whether or Not Assembled With Electric Conductors or Fitted With Connectors. HS 90: Optical, Photographic, Cinematographic, Measuring, Checking, Medical or Surgical Instruments and Apparatus; Parts and Accessories. The value of the Canadian semiconductor industry’s total goods imports in 2020 was $7,343 million. Source: Statistics Canada, custom tabulation, International Accounts and Trade Division, reference year 2020. |
|||
The sector experienced large trade deficits with Asia and the Americas in 2020
Trade deficits occur when the value of imports exceed the value of exports, which can effectively put downward pressure on a country’s currency and make importing goods more expensive. It is estimated that the semiconductor industry imported $7.4 billion in 2020, yielding a deficit of $3.9 billion.
Despite having a trade surplus with Africa ($13.0 million) and a small trade deficit with Europe ($58.0 million), the sector experienced large trade deficits with the Americas, excluding the United States, of -$1.2 billion, and Asia and Oceania at -$3.5 billion. Only with the United States did the sector experience a substantial trade surplus ($851.0 million).
The elimination of trade deficits may not be possible due to the concentration of semiconductor manufacturing in Asia. However, deficits generally indicate a lack of domestic production. Given the widespread consequences of the Covid-19 pandemic on global trade, it is possible that companies will be more inclined to mitigate their trade imbalances in the future. Despite this, the cost of establishing and sustaining manufacturing operations remains a substantial hindrance to the growth of domestic production. While it may be more cost-effective and convenient to rely on existing production facilities, this approach also increases dependency and reduces control over the supply chain. Further research will be necessary to accurately assess the future trends in trade and manufacturing in the wake of the pandemic.
Research and development
Statistic Canada collects annual data on the research and development (R&D) activities of business and industrial non-profit organizations, including semiconductor companies, through the Annual Survey of Research and Development in Canadian Industry (RDCI). In this survey, companies are asked to report their expenditures in two categories: in-house and outsourced. A company’s in-house R&D activities are those conducted by the company itself, while outsourced R&D is conducted by other entities, such as universities, businesses, or individuals, on behalf of the company. R&D outsourcing can occur within or outside Canada, and can take a variety of forms, including grants, fellowships, and contracts. Using this information, the level of R&D activities in the Canadian economy can be tracked and can be used for policy-based purposes by various levels of government.
A wide range of R&D expenditures are incurred by semiconductor companies. Among these costs are those related to developing new semiconductor technologies, such as new manufacturing processes or novel materials, as well as those associated with improving existing products and processes.
In-house R&D expenditures
Almost one-tenth of in-house R&D in Canada was performed by the semiconductor industry
Virtually all total in-house spending was on current costs ($1.7 billion), including $1.3 billion on wages and salaries for R&D personnel. Additional spending included $81.0 million on contractor services, $234.0 million on materials for R&D and $137.0 million on all other current costs, which includes costs associated with the administration and overhead of R&D.Note

Data table for Figure 8
| In-house Expenditures | Type of Expenditure | Millions of dollars |
|---|---|---|
| Current In-house Expenditures | Current In-house Expenditures | 1,742 |
| Wages, Salaries | 1,290 | |
| R&D Materials | 234 | |
| All Other Current Costs | 137 | |
| Services To Support R&D | 81 | |
| Capital In-house Expenditures | Capital In-house Expenditures | 97 |
|
Note: The Canadian semiconductor industry’s total expenditures on in-house R&D in 2020 were $1,839 million. Source: Statistics Canada, custom tabulation, Survey of Research and Development in Canadian Industry, reference year 2020. |
||
Additionally, capital investments ($97.0 million) were made to support R&D, including expenditures on land, buildings and structures, software, equipment, machinery, and other capital investments. While the sector’s capital expenditures may appear small compared with current in-house expenditures, they are in line with the national breakdown of total current and capital R&D spending. Across all sectors in 2020, 5.3% of total in-house R&D expenditures were spent on capital, while in the sector, 5.3% was spent on capital formation.Note
Most of the sector’s R&D activity is concentrated in Ontario with around two-thirds of in-house expenditures in 2020 ($1.2 billion) being spent in the province.
Salaries in the semiconductor sector were higher than in other sectors
It is important to consider the role of R&D personnel in the R&D process. R&D personnel, including researchers, scientists, and technicians, are crucial to driving advancements and advancing the capabilities of companies. Their responsibilities include developing novel technologies and products, performing experiments, and collaborating with other teams and stakeholders to bring ideas to fruition. Consequently, the success of a company’s R&D efforts is often determined by the expertise and skills of its R&D personnel.
In 2020, the semiconductor industry supported 11,530 full-time equivalent (FTE) R&D personnel across all occupational categories and 6.5% of all R&D personnel in Canada.Note The majority (11,022 FTEs, 95.6%) of the sector’s R&D personnel were employed directly by the company for which they performed R&D, while 4.4% (508 FTEs) were on-site contractors. In-house R&D employees in the sector received higher wages in 2020 than national averages across all sectors. Specifically, in 2020, in-house R&D personnel across Canada received an average salary of around $91,000, while the average salary of in-house R&D personnel in this sector was just over $117,000.Note
Around two-thirds of R&D personnel were employed in Ontario (7,384 FTEs).

Data table for Figure 9
| Occupational Category | Occupation | Full-time Equivalents |
|---|---|---|
| Researchers and Research Managers | Scientists, Engineers and Researchers | 8,060.32 |
| Senior Research Managers | 765.07 | |
| Technical, Administrative and Support Staff | Technicians, Technologists and Research Assistants | 1,714.48 |
| Other Technical, Administrative and Support Staff | 482.31 | |
| Consultants and Contractors | On-Site Contractors | 508.27 |
|
Note: In 2020, the Canadian semiconductor industry had a total of 11,530 FTE R&D personnel. Source: Statistics Canada, custom tabulation, Survey of Research and Development in Canadian Industry, reference year 2020. |
||
Just over three-quarters (8,825 FTEs) of the sector’s R&D personnel were researchers and research managers. Categorically, most of the personnel were scientists, engineers, and researchers (8,060 FTEs) who are personnel engaged in the conception or creation of new knowledge and are responsible for conducting research. There were also 765 FTEs senior research managers who were responsible for managing R&D programs and projects. Technical, administrative, and support staff constituted the remaining one-fifth of the R&D personnel in this sector.
The sector accounted for half of all nanotechnology R&D performed in Canada in 2020
R&D encompasses a broad spectrum of areas of research aimed at advancing knowledge in a variety of fields. Four-fifths of the R&D conducted by the semiconductor industry was in the engineering and technology field. Most of this research ($1.4 billion) was geared towards electrical engineering, electronic engineering, and communications technology, but significant investments were also made in other areas of the field.
By creating new materials and technologies at the molecular or atomic level, nanotechnology has the potential to revolutionize many different industries. Despite making up only a small portion (2.7%) of the sector’s total R&D expenditures, the semiconductor industry contributes significantly to this type of research. Of the $93.0 million spent Canada wide on R&D in the Nanotechnology fieldNote , over half ($49.0 million) came from companies in the sector.
Software R&D ($313.0 million, 17.0%) accounted for most of the sector’s remaining R&D areas of research. This can involve the development of specialized software and algorithms for semiconductor design, simulation, and testing, as well as the creation of cutting-edge tools for managing the complex systems involved in semiconductor manufacturing and design.Note

Data table for Figure 10
| Field of Research and Development | Millions of dollars |
|---|---|
| Electrical Engineering, Electronic Engineering and Communications Technology | 1,358 |
| Other Engineering and Technology | 124 |
| Software | 313 |
| Other Fields | 44 |
|
Note: The Canadian semiconductor industry’s total expenditures on in-house R&D in 2020 were $1,839 million. Source: Statistics Canada, custom tabulation, Survey of Research and Development in Canadian Industry, reference year 2020. |
|
Outsourced R&D expenditures
R&D outsourcing refers to the practice of hiring another company or organization to perform R&D on behalf of a funder. Companies that lack the resources or expertise to conduct R&D internally typically engage in this practice. Essentially, outsourcing enables funders to gain access to specialized knowledge and expertise that they do not possess in-house. It also allows companies to save time and money that would be otherwise be needed to invest in building up their R&D capabilities.
The business sector received $82 million in outsourced contracts
In 2020, the semiconductor industry outsourced a total of $96.0 million in R&D. The majority (60.4%) of this outsourcing was performed outside of Canada, while around 40.6% was performed in Canada.

Data table for Figure 11
| Recipient Location | Recipient Sector | Millions of dollars |
|---|---|---|
| Canadian Recipients of Outsourced Expenditures | Businesses | 27 |
| Hospitals and Universities | 8 | |
| All Other Canadian Recipients | 4 | |
| Foreign Recipients of Outsourced Expenditures | Businesses | 55 |
| All Other Foreign Recipients | 3 | |
|
Note: In 2020, the Canadian semiconductor industry had $96 million in total outsourced R&D, of which $39 million was outsourced in Canada, while $58 million was outsourced outside of Canada. Source: Statistics Canada, custom tabulation, Survey of Research and Development in Canadian Industry, reference year 2020. |
||
The primary recipients of outsourced R&D by the sector were other businesses. Domestically, the sector outsourced $27.0 million to these contracted businesses. Another $8.0 million was outsourced to Canadian hospitals and universities, with all other Canadian recipients receiving around $4.0 million in 2020. Internationally, an even higher share (94.8%, or $55.0 million) of outsourced expenditures went to the business sector, with only $3.0 million going to all other foreign recipients.
SR&ED eligible R&D expenditures
The Scientific Research and Experimental Development (SR&ED) tax credit program provides another lens through which we can examine R&D outsourcing among various sectors and how the program can support and encourage these partnerships.
The Scientific Research and experimental Development (SR&ED) program is a tax incentive program offered by the Canadian government that provides tax credits to businesses that engage in R&D activities. This credit can be used to reduce the amount of income tax a business owes, making it more financially feasible for businesses to invest in R&D. A wide range of R&D expenses can be claimed through the program, including salaries and wages for employees engaged in R&D work, materials, and supplies for the R&D process, as well as certain overhead expenses. Expenses such as R&D outsourced outside of Canada or capital expenditures cannot be claimed.
SR&ED claims lag total spending on current in-house R&D
There were $689.0 million of approved SR&ED expenditures in the semiconductor industry in 2020. Most of these expenditures ($656.0 million) were for R&D activities performed in-house by companies in the sector. The remaining $33.0 million of approved claims were for R&D that was outsourced, via contracts or grants, to other Canadian organizations (other Canadian companies, Canadian universities, Canadian industrial non-profits, etc.). As R&D outsourced to foreign companies is not eligible for reimbursement, all of these expenditures were incurred by companies outsourcing within Canada.

Data table for Figure 12
| Expenditure Types | SR&ED Claims | Millions of dollars |
|---|---|---|
| Current In-house R&D | Claimed Through SR&ED | 956 |
| Unclaimed | 786 | |
| Outsourced in Canada R&D | Claimed Through SR&ED | 33 |
| Unclaimed | 6 | |
|
Note: In 2020, the Canadian semiconductor industry had $1,742 million in current in-house R&D, compared to $39 million in total outsourced R&D in Canada. Source: Statistics Canada, custom tabulation, Scientific Research and Experimental Development Expenditures Claim, Survey of Research and Development in Canadian Industry, reference year 2020. |
||
While there is some variation between the criteria for what R&D expenses are eligible to be claimed by companies through SR&ED and reported on the RDCI, in-house R&D expenditures and outsourced R&D expenditures within Canada broadly overlap. Despite this, while nearly all outsourced R&D expenditures in Canada reported through the RDCI was claimed by companies through the SR&ED program, only 54.9% of current in-house R&D expenditures reported by firms in the semiconductor industry were claimed.
The differences in reported R&D expenditures between the two sources may be attributed to several factors, including a lack of awareness about the SR&ED program, insufficient documentation to support the claim, concerns about the time and effort required to complete the process, or a decision that the tax credits do not outweigh the costs associated with claiming the R&D work. It is also possible that some of this variance is due to R&D expenses that do not fall within qualifying activities for SR&ED, despite the overlapping definitions.
Limitations
This study aims to assess the economic impact of the semiconductor industry in Canada in 2020, utilizing a range of data sources including information on value-added, employment, R&D activities, financial data, and international trade. However, lack of historical data on this sector hinders our ability to analyze trends over time and restricts the scope of the study.
The sectoral name “The semiconductor industry” employed in this study is not an official classification. Although the entities included in this study engage in activities related to semiconductors, as identified by the list provided by ISED, their primary business activities may not necessarily be the manufacturing of semiconductors or the provision of semiconductor services.
The impact of the COVID-19 pandemic on trade in the semiconductor industry is difficult to assess with certainty for 2020 and beyond. Disruptions to global supply chains and the economic downturn caused by the pandemic may have and may continue to affect the demand for semiconductors and the availability of materials and components. This could in turn impact the ability of companies in this industry to engage in international trade in the future. As well, the pandemic may lead to changes in global trade patterns, such as increased protectionist policies or shifts in production locations.
The quality of the data used in this study is dependent on the continued active participation of companies in relevant surveys administered by Statistics Canada, as well as the accurate identification and tracking of R&D activities by these firms. The success of future studies on the semiconductor industry in Canada may therefore be limited by these factors.
Appendix
Glossary
The Annual Survey of Research and Development in Canadian Industry (RDCI) is an annual survey that collects R&D expenditures and personnel data used to monitor science and technology related activities of business and industrial non-profit organizations in Canada.
Applied research is original investigation undertaken to acquire new knowledge. It is, however, directed primarily towards a specific, practical aim or objective. See also basic research; experimental development.
Basic price is the amount a producer receives from a purchaser for a unit of a good or service produced as output minus any tax payable and plus any subsidy receivable as a result of its production or sale.
Basic research is experimental or theoretical work undertaken primarily to acquire new knowledge of the underlying foundations of phenomena and observable facts, without any particular application or use in view. See also applied research; experimental development.
Business Enterprise Research and Development (BERD) is all research and development performed in Canada by the business enterprise sector, as measured by the Annual Survey of Research and Development in Canadian Industry performed by Statistics Canada.
Capital R&D expenditures are the annual gross amount paid for the acquisition of fixed assets that are used repeatedly or continuously in the performance of R&D for more than one year. They should be reported in full for the period when they took place, whether acquired or developed in house, and should not be registered as an element of depreciation.
Country of control is the country of residence of the ultimate controlling parent corporation, family, trust, estate, or related group. Each subsidiary within the global enterprise is assigned the same country of control as its parent. Country of control data are derived from ownership questionnaires filed annually with Statistics Canada by corporations subject to the Corporations Returns Act, and from information obtained from the Canada Revenue Agency’s administrative records.
Current R&D expenditures are composed of labour costs and other current costs (including for external R&D personnel) used in R&D. Services and items (including equipment) used and consumed within one year are current expenditures. Annual fees or rents for the use of fixed assets should be included in current expenditures, as should overhead costs associated with R&D. See also other current costs.
Direct impacts are the effects directly attributed to an industry’s production. See also indirect impact; induced impact.
An economic footprint study aims to measure the total economic impact (direct, indirect, or induced) of an organization, sector or industry on a specific country or region during a given period. Economic impacts typically considered include gross value-added and employment data. See also direct impact; indirect impact; induced impact.
Employees are all persons who work in or for the reporting unit, who have a contract of employment with the unit and who receive compensation in cash or in kind at regular intervals of time.
Experimental development is systematic work, drawing on knowledge gained from research and practical experience and producing additional knowledge, which is directed to producing new products or processes or to improving existing products or processes. See also applied research; basic research.
Exports are goods produced or manufactured in Canada that are subtracted from the stock of material resources in Canada, as a result of their movement out of the country.
A foreign-controlled company is any company whose country of control is not Canada, see country of control.
Full-time equivalent (FTE) is the total hours worked divided by average annual hours worked in full-time jobs.
Full-time equivalent (FTE) R&D personnel is defined as the ratio of working hours actually spent on R&D during a specific reference period (usually a calendar year) divided by the total number of hours conventionally worked in the same period by an individual or by a group.
Gross Domestic Product (GDP) is the total unduplicated value of the goods and services produced in the economic territory of a country or region during a given period. See also value-added.
Gross value-added (GVA) is a measure of the contribution that a producer, industry or sector makes to GDP, it is defined as the value of output less the value of intermediate consumption. See also gross domestic product (GDP) and intermediate consumption.
Imports are goods that have entered the country by crossing territorial (customs) boundaries, whether for immediate domestic consumption or for storage in customs warehouses. Re-imports are included in Canadian trade data. These are goods, materials or articles that are imported in either the same condition in which they were exported or after undergoing repair or minor alterations (e.g., blending, packaging, bottling, cleaning, or sorting) that leave them essentially unchanged. Domestic re-imports are goods of Canadian origin, whether grown, extracted, or manufactured in Canada that are exported to another country and then returned to Canada in ‘the same state’ as they were sent out. See also exports.
Indirect impacts are upstream economic activities associated with supplying intermediate inputs (the current expenditures on goods and services used up in the production process) to the directly impacted industries. See also direct impact; induced impact.
Induced impacts are additional economic activities derived from the labour income generated by both the direct and indirect effects when spent in the marketplace. See also direct impact; indirect impact.
An industry is a group of establishments engaged in the same, or similar, kinds of economic activity. See also North American Industry Classification System (NAICS); sector.
In-house R&D is expenditures within Canada for R&D performed within this business by employees or self-employed individuals or contractors who are working on site on a business’s R&D projects.
Intermediate consumption is the products used by an industry to produce outputs. These products may come from domestic production or from imports. See gross value-added.
Labour income consists of the sum of wages and salaries and employer’s social contributions of employees and the labour income of the self-employed.
North American Industry Classification System (NAICS) is a business-classification system developed through a partnership among the United States, Mexico, and Canada. Companies are classified by their same or similar production processes. NAICS Canada 2017 Version 3.0 divides the Canadian economy into 20 sectors, 102 subsectors, 324 industry groups, 710 industries and 928 Canadian industries. See also sector; industry.
Other current costs are non-capital purchases of materials, supplies, equipment, and services to support R&D performed by the reporting unit in the reference year. Examples are water and fuel (including gas and electricity); books, journals, reference materials, subscriptions to libraries, scientific societies, etc.; imputed or actual costs of small prototypes or models made outside the reporting unit; and materials for laboratories (e.g., chemicals, animals, etc.). Other current costs include royalties or licences for the use of patents and other intellectual property rights, the lease of capital goods (machinery and equipment, etc.) and the rental of buildings to support R&D performed by the reporting unit in the reference year. Overhead costs associated with R&D are also included in other current costs. See also current R&D expenditures.
Output consists primarily of the value of goods and services produced by an industry.
Outsourced R&D are payments made within or outside Canada to other businesses, organizations, or individuals to fund R&D performance through grants, fellowships, or contracts.
R&D personnel are all persons engaged directly in R&D, whether employed by the reporting unit or external contributors fully integrated into the reporting unit’s R&D activities, as well as those providing direct services for the R&D activities (such as R&D managers, administrators, technicians, and clerical staff).
The reporting unit is the unit from which data are reported. This corresponds to the unit that would receive a questionnaire or interview. In the case of administrative data, it would correspond to the unit that is represented by the individual record.
Research and development (R&D) is creative and systematic work undertaken to increase the stock of knowledge – including knowledge of humankind, culture, and society – and to devise new applications of available knowledge. See also applied research; basic research; experimental development.
Researchers are professionals engaged in the conception or creation of new knowledge. They conduct research and improve or develop concepts, theories, models, techniques instrumentation, software, or operational methods.
The Scientific Research and Experimental Development (SR&ED) Tax Incentive Program is intended to encourage Canadian businesses of all sizes and in all sectors to conduct R&D in Canada. These tax incentives come in three forms: an income tax deduction, an investment tax credit (ITC), and, in certain circumstances, a refund. Corporations, individuals, trusts, and members of a partnership can use these Government of Canada incentives.
A sector is a high-level section of the economy encompassing economic activity in several related industry groups. See also industry; North American Industry Classification System (NAICS).
Populations
Innovation, Science and Economic Development Canada (ISED) provided a cohort list to Statistics Canada. The list included private and public businesses, accelerators, research centers, not-for-profits, and academic institutions that offer a wide range of products and services, such as communication chips and devices, printed circuit boards, displays, graphics chips, compound semiconductor, sensors, microelectromechanical systems, advanced packaging, design tools, lasers for PCBs, etc. This list also includes applicants for the Government of Canada’s Strategic Innovation Fund’s 2022 Semiconductor Challenge. To identify units with business activities in 2020, the list was compared to the Business Register. For the purpose of estimating economic impacts, only units with corporate income tax returns for 2020 were included in the study. Organizations were classified to a range of NAICS 2017 categories, with the most frequent being 3344 - Semiconductor and other electronic component manufacturing (305), 5417 - Scientific research and development services (75) and 5415 - Computer systems design and related services (27).
Business structures
For collection purposes, Statistics Canada distinguishes between four different business levels, all of which are present in all businesses in Canada. These levels, from highest to lowest, are enterprise, company, establishment, and location. For simple businesses, particularly those where all business activities are based in one location, there are no practical differences between the four levels. Statistics Canada recognizes that complex businesses, which may haves a head office and separate locations for regional offices, R&D, manufacturing, sales, etc., produce and record different types of information at different levels within the business. Therefore, different levels of entities are surveyed depending on the nature of the data being sought.
This study pulled data from several different Statistics Canada business surveys, which surveyed companies at different business levels. The cohort lists provided to Statistics Canada were at the company level. Statistics Canada linked entities at the company level to those at the establishment or enterprise levels, depending on the suitable conceptual level for the data.
Data on GVA and employment, and all associated impacts – direct, indirect, and induced – were processed at the establishment level, the lowest level at which accounting data required to measure production is available.
Tax data are processed by the Canada Revenue Agency at the business number level, which generally corresponds to the company level. Since many companies that perform R&D report Scientific Research and Experimental Development (SR&ED) tax credit claims, R&D data are collected at the same level as tax data to reduce response burden by enabling reporting units to use the same accounting level for reporting R&D.
Trade and financial data are collected at the enterprise level, the highest level within the business structure. This is the level at which businesses keep these types of records.
Where a complex enterprise has a company which is part of the sector and another company which is not, both companies are included by virtue of the business organizations reporting structure.
Methods
Where microdata were provided, analysts undertook a data review to confirm the suitability of the data for use in this report. The R&D data were comprised primarily of actual respondent data. Where companies did not respond to the reference year (RY) 2020 RDCI survey, data were imputed using historical values and SR&ED tax data. For more information on data sources, accuracy, and methodology of the RDCI survey please refer to the Integrated Metadatabase, the metadata repository for Statistics Canada products.
Economic impacts
The direct economic impacts of the sector were measured based on the industry’s outputs and GVA. Outputs include the measurement of goods and services produced by an establishment. GVA measures the value of output less the value of intermediate consumption, which consists of all goods and services used up during production within an accounting period.
The calculation of the economic impacts were derived using the 2020 tax data associated with the companies and enterprises identified as members of the semiconductor industry. This information was entered into the Statistics Canada National Input-Output Model (Statistics Canada service 36-23-0002) which provided estimates for the other direct impact metrics such as labour income, jobs and FTEs, as well as the indirect and induced economic impact for all variables.
The Statistics Canada National Input-Output Model is derived from the Supply and Use Tables (Statistics Canada catalogue 15-602-X). The model is updated every year to coincide with the most recent version of the Supply and Use Tables. The Input-Output model used in the economic impact study is based on the 2019 version of the Supply and Use tables.
The impact estimates provided by the model for output, GVA, and labour income are derived from information included in the Supply and Use Tables. The impact estimates provided by the model for jobs and FTEs are derived from the labour productivity and related measures by business sector industry and by non-commercial activity consistent with the industry accounts (Statistics Canada table 36-10-0480-01).
- Date modified: