
Analysis in Brief
Return to life after two years of the COVID-19 pandemic: A look at culture, arts, entertainment and recreation services in 2022
Skip to text
Text begins
After two years of periodic closures caused by the COVID-19 pandemic, businesses across the culture, arts, entertainment and recreation servicesNote were able to reopen and resume regular operations for most of the year in 2022. This created the first full year of true recovery across most of these industries, after shutdowns in 2020 and partial closures and restrictions in 2021. With the push from businesses to reopen at full capacity, as well as the desire of Canadians to return to activities outside their homes, most of the industries in the culture, arts, entertainment and recreational services saw strong growth in 2022.
To provide a first glance at the financial implications of the pandemic recovery in 2022 for the culture, arts, entertainment and recreation sectors, this study examined alternative datasets that allow for more timely financial estimates, before annual business survey estimates are available. Following review, data from the goods and services tax (GST) sales and payroll deduction (PD7) files were historically comparable for most service-producing industries and acted as a coherent proxy for preliminary estimates of revenue and salary and wage expenses for 2022.
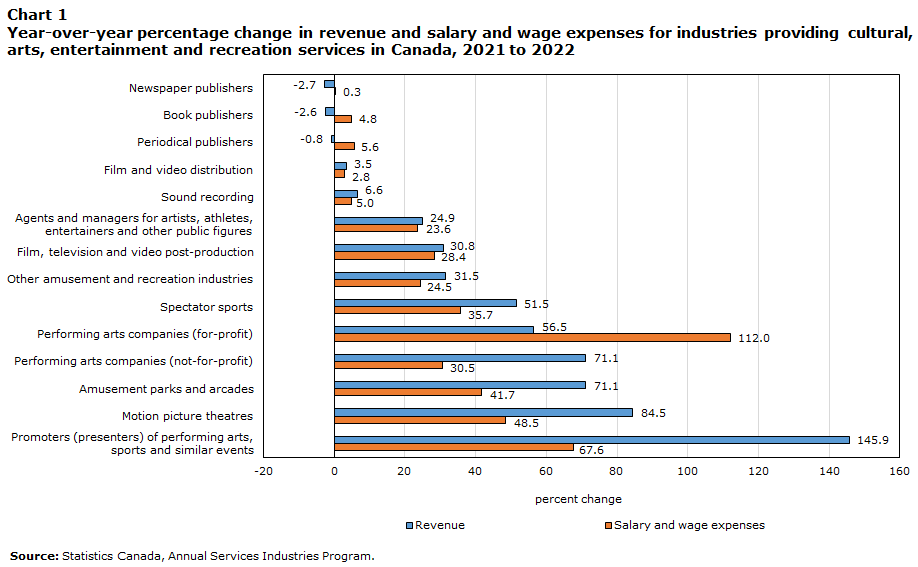
Nationally, there was strong revenue and salary growth in 2022 across most of the industries, except the publishing industries, which continued to see declining revenues (Chart 1). The strongest revenue growth was seen in the promoters (presenters) of performing arts, sports and similar events industry group (+145.8%), while the largest decline was in newspaper publishers (-2.7%). For salary and wage expenses, increases were seen across all industries, with the largest growth observed in the for-profit performing arts industry (+111.9%), while the weakest increase was in the newspaper publishers industry (+0.3%).
Data table for Chart 1
| Revenue | Salary and wage expenses | |
|---|---|---|
| percent change | ||
| Promoters (presenters) of performing arts, sports and similar events | 145.9 | 67.6 |
| Motion picture theatres | 84.5 | 48.5 |
| Amusement parks and arcades | 71.1 | 41.7 |
| Performing arts companies (not-for-profit) | 71.1 | 30.5 |
| Performing arts companies (for-profit) | 56.5 | 112.0 |
| Spectator sports | 51.5 | 35.7 |
| Other amusement and recreation industries | 31.5 | 24.5 |
| Film, television and video post-production | 30.8 | 28.4 |
| Agents and managers for artists, athletes, entertainers and other public figures | 24.9 | 23.6 |
| Sound recording | 6.6 | 5.0 |
| Film and video distribution | 3.5 | 2.8 |
| Periodical publishers | -0.8 | 5.6 |
| Book publishers | -2.6 | 4.8 |
| Newspaper publishers | -2.7 | 0.3 |
| Source: Statistics Canada, Annual Services Industries Program. | ||
No recovery in sight for publishing industries
The newspaper, book and periodical publishing industries did not experience the same post-pandemic bounce back in 2022 as the rest of the culture, arts, entertainment and recreation industries, with revenues contracting across all three industries. The publishing industries continued to face challenges in 2022, including the rising cost of paper, competition for readers and advertising dollars, and pressures to operate in a more digital environment. Of these publishing industries, the largest revenue decline was observed in newspaper publishers (-2.7%), followed by book publishers (-2.6%) and periodical publishers (-0.8%).

Data table for Chart 2
| Newspaper publishers | Periodical publishers | Book publishers | |
|---|---|---|---|
| percent change | |||
| Atlantic provinces | -3.4 | 12.2 | 7.4 |
| Quebec | -5.8 | -0.3 | 3.5 |
| Ontario | -1.2 | -0.7 | -4.9 |
| Prairies, British Columbia and territories | -2.3 | -2.8 | -2.8 |
| Canada | -2.7 | -0.8 | -2.6 |
| Source: Statistics Canada, Annual Services Industries Program. | |||
Across Canada, only two regions (Quebec and the Atlantic provinces) saw revenue growth in these industries (see Chart 2). Book publishers in Quebec had modest revenue growth of 3.5% in 2022, while revenue declines were observed in the other publishing industries, with newspaper publishers down 5.8% and periodical publishers relatively flat (-0.3%). In the Atlantic region, the revenues of periodical publishers (+12.2%) and book publishers (+7.4%) grew in 2022, but not for newspaper publishers (-3.4%).
Conversely, across the three publishing industries, salary and wage expenses increased across all regions except for newspaper publishers in the Atlantic provinces, where labour expenses declined (-4.5%). The largest salary and wage increase across the regions was for periodical publishers, with smaller movements for book publishers and newspaper publishers (see Chart 3).

Data table for Chart 3
| Newspaper publishers | Periodical publishers | Book publishers | |
|---|---|---|---|
| percent change | |||
| Atlantic provinces | -4.5 | 16.4 | 2.0 |
| Quebec | 1.4 | 4.1 | 6.1 |
| Ontario | 0.3 | 5.7 | 4.1 |
| Prairies, British Columbia and territories | 0.3 | 5.5 | 6.1 |
| Canada | 0.3 | 5.6 | 4.8 |
| Source: Statistics Canada, Annual Services Industries Program. | |||
Lifting of restrictions boosts revenues and salaries for spectator sports and related industries
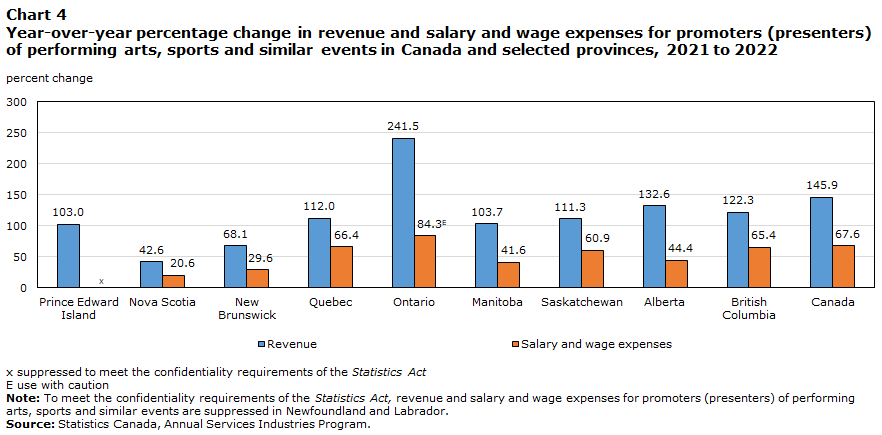
With the easing of restrictions and the ability to operate fully for the first time since March 2020, operating conditions in 2022 were favourable across the spectator sports and related industries. Arenas, stadiums, theatres and other facilities could operate at full capacity, bringing the return of concerts, festivals and live sports events. After two years of cancellations and postponements, large events and concerts could be held without restrictions in 2022, resulting in significant revenue growth. The industry with the strongest revenue growth was promoters (presenters) of performing arts, sports and similar events, with an increase of 145.8% in 2022. Increases were seen across all provinces, with the largest revenue growth in Ontario (+241.5%) (see Chart 4). Salaries for the industry also showed significant growth across the provinces in 2022, increasing by 67.6% at the Canada level.
Data table for Chart 4
| Revenue | Salary and wage expenses | |
|---|---|---|
| percent change | ||
| Prince Edward Island | 103.0 | Note x: suppressed to meet the confidentiality requirements of the Statistics Act |
| Nova Scotia | 42.6 | 20.6 |
| New Brunswick | 68.1 | 29.6 |
| Quebec | 112.0 | 66.4 |
| Ontario | 241.5 | 84.3Note E: Use with caution |
| Manitoba | 103.7 | 41.6 |
| Saskatchewan | 111.3 | 60.9 |
| Alberta | 132.6 | 44.4 |
| British Columbia | 122.3 | 65.4 |
| Canada | 145.9 | 67.6 |
|
x suppressed to meet the confidentiality requirements of the Statistics Act E use with caution Note: To meet the confidentiality requirements of the Statistics Act, revenue and salary and wage expenses for promoters (presenters) of performing arts, sports and similar events are suppressed in Newfoundland and Labrador. Source: Statistics Canada, Annual Services Industries Program. |
||
After capacity limitations for audiences in most sports leagues plagued the 2021 season, the return of larger crowds and more events for fans boosted revenue in the spectator sports industry by 51.5% in 2022. Likewise, with the return of sporting and arts events, the agents and managers for artists, athletes, entertainers and other public figures industry also benefited, with revenues increasing by 24.9%. Salaries also rose for spectator sports (+35.7%) and for agents and managers (+23.6%).
Return of live shows revives performing arts industry
Fluctuating closures and restrictions in 2021 led many businesses in the performing arts industry to continue digital operations and push their return to the stage to 2022, creating excitement and an influx of activities throughout the year. With the return of live shows and touring operations, the performing arts industries had significant growth in 2022, with revenue in the not-for-profit industry increasing by 71.1% and in the for-profit industry by 56.5%. The largest increase was in musical theatre and opera companies, which had revenue growth of 217.3% for the profit sector and 101.4% for the not-for-profit sector (see Chart 5).

Data table for Chart 5
| Revenue | Salary and wage expenses | |
|---|---|---|
| percent change | ||
| For-profit theatre (except musical) companies (711111) | 49.3 | 31.6 |
| For-profit musical theatre and opera companies (711112) | 217.3 | 155.7 |
| For-profit dance companies (711120)Note E: Use with caution | 39.6 | Note x: suppressed to meet the confidentiality requirements of the Statistics Act |
| For-profit musical groups and artists (711130) |
37.1 | 29.5 |
| For-profit other performing arts companies (711190) | 61.0 | 184.3 |
| Not-for-profit theatre (except musical) companies (711111) | 82.4 | 35.9 |
| Not-for-profit musical theatre and opera companies (711112) | 101.4 | 57.9 |
| Not-for-profit dance companies (711120) | 50.3 | 22.9 |
| Not-for-profit musical groups and artists (711130) | 53.4 | 9.6 |
| Not-for-profit other performing arts companies (711190) | 100.1 | 22.9 |
|
x suppressed to meet the confidentiality requirements of the Statistics Act E use with caution Source: Statistics Canada, Annual Services Industries Program. |
||
Likewise, salaries across the performing arts industries also increased in 2022, at varying levels. The largest increases were seen in the for-profit sectors, with salaries in other performing arts companies increasing by 184.3% and those in musical theatre and opera companies increasing by 155.7%. Smaller yet significant increases were seen across the not-for-profit sectors, which had been able to access significant grant funding to continue paying staff throughout the harder-hit pandemic years.Note
Motion picture and video industries strengthen with backlog of projects
After closures on film and television sets early in the pandemic, the film, television and video production industry resumed operations in 2021 in earnest, resulting in an unprecedented number of projects.Note This trickled down into the other motion picture and video industries throughout 2022, resulting in increased revenues and salary and wage expenses. The influx of projects led to an increase in work for businesses in the film, television and video post-production industry, causing revenues to rise 30.8% in 2022. With more projects ready for release and the return of theatre and film festivals, revenues in the film and video distribution industry also expanded by 3.5% in 2022. The motion picture theatres industry also benefited, with many large theatrical releases throughout the year as well as the ability to operate without restrictions for almost the entire year. As a result, revenues for the industry climbed 84.5% in 2022.
With a larger project load, the motion picture and video industries also had significant increases in salary and wage expenses in 2022. The largest increase was in motion picture theatres, where salary expenses grew by 48.5%, and in film, television and video post-production, with an increase of 28.4%. Salary expenses in the film and video distribution industry grew by a more modest 2.8% in 2022. Across the provinces, the largest increases in salaries were seen in Ontario, Quebec, British Columbia and Alberta for the film industries (see Chart 6).

Data table for Chart 6
| Motion picture theatres | Film, television and video post-production | Film and video distribution | |
|---|---|---|---|
| percent change | |||
| Newfoundland and Labrador | 24.6 | Note x: suppressed to meet the confidentiality requirements of the Statistics Act | Note x: suppressed to meet the confidentiality requirements of the Statistics Act |
| Prince Edward Island | 18.7 | Note x: suppressed to meet the confidentiality requirements of the Statistics Act | Note x: suppressed to meet the confidentiality requirements of the Statistics Act |
| Nova Scotia | 25.4 | Note x: suppressed to meet the confidentiality requirements of the Statistics Act | Note x: suppressed to meet the confidentiality requirements of the Statistics Act |
| New Brunswick | 15.7 | Note x: suppressed to meet the confidentiality requirements of the Statistics Act | Note x: suppressed to meet the confidentiality requirements of the Statistics Act |
| Quebec | 41.0 | 30.2 | 6.0 |
| Ontario | 59.6 | 27.5 | 2.0 |
| Manitoba | 31.2 | Note x: suppressed to meet the confidentiality requirements of the Statistics Act | Note x: suppressed to meet the confidentiality requirements of the Statistics Act |
| Saskatchewan | 20.2 | Note x: suppressed to meet the confidentiality requirements of the Statistics Act | Note x: suppressed to meet the confidentiality requirements of the Statistics Act |
| Alberta | 35.8 | 22.6 | Note x: suppressed to meet the confidentiality requirements of the Statistics Act |
| British Columbia | 56.1 | 26.6 | 9.6 |
| Canada | 48.5 | 28.4 | 2.8 |
|
x suppressed to meet the confidentiality requirements of the Statistics Act Note: To meet the confidentiality requirements of the Statistics Act, salary and wage expenses for film, television and video post-production are suppressed in Newfoundland and Labrador, Prince Edward Island, Nova Scotia, New Brunswick, Manitoba, and Saskatchewan. To meet the confidentiality requirements of the Statistics Act, salary and wage expenses for film and video distribution are suppressed in Newfoundland and Labrador, Prince Edward Island, Nova Scotia, New Brunswick, Manitoba, Saskatchewan, and Alberta. Source: Statistics Canada, Annual Services Industries Program. |
|||
Return to fun: Amusement and recreation industries
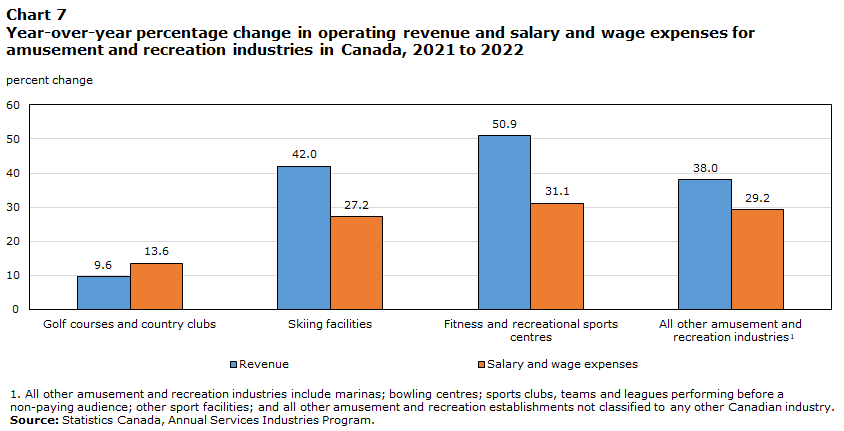
Though all sectors in the amusement and recreation industries had revenue growth in 2022, the magnitude varied because of mixed success in the 2021 seasons (see Chart 7). After being a popular activity during the pandemic,Note golf courses and country clubs continued to grow their revenues in 2022, up 9.6% from 2021. This is more modest growth than seen in the other amusement industries because golf courses and country clubs were not significantly hindered by pandemic restrictions in 2021. By contrast, restrictions plagued the skiing facilities industry in 2020 and 2021, with significant revenue declines seen throughout those years.Note With the end of capacity restrictions and the lessening of travel restrictions, revenues in the industry increased by 42.0% in 2022. This trend was also reflected in the salary movements of these industries (+13.6% for the golf industry and +27.2% for the skiing facilities industry).
Data table for Chart 7
| Revenue | Salary and wage expenses | |
|---|---|---|
| percent change | ||
| Golf courses and country clubs | 9.6 | 13.6 |
| Skiing facilities | 42.0 | 27.2 |
| Fitness and recreational sports centres | 50.9 | 31.1 |
| All other amusement and recreation industriesData table for chart 7 Note 1 | 38.0 | 29.2 |
|
||
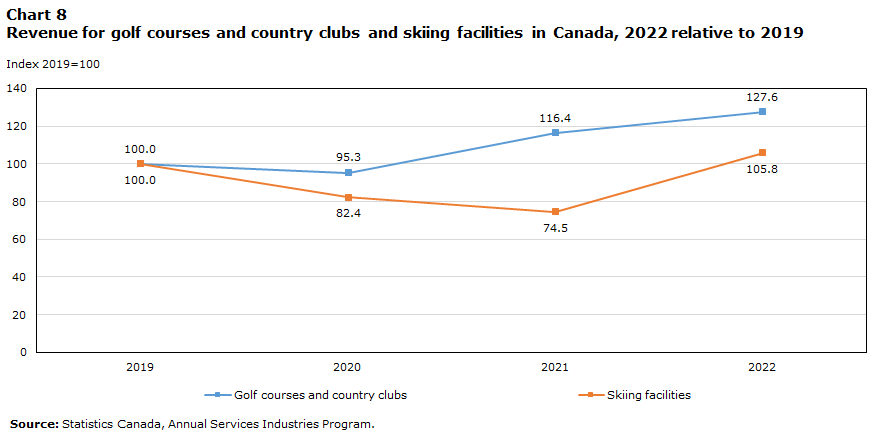
Compared with the pre-pandemic levels of 2019, revenues for golf courses and country clubs, as well as skiing facilities, were greater in 2022 (see Chart 8). However, the differing impact of the pandemic on industries can be seen in the comparison of movement of the years 2020 to 2022. The skiing facilities industry had reduced revenues in both 2020 and 2021, with a significant bounce back in 2022, while revenues for golf courses and country clubs were lower only in 2020, bouncing back in 2021 to surpass pre-pandemic levels, then growing further in 2022.
Data table for Chart 8
| Golf courses and country clubs | Skiing facilities | |
|---|---|---|
| Index 2019=100 | ||
| 2019 | 100.0 | 100.0 |
| 2020 | 95.3 | 82.4 |
| 2021 | 116.4 | 74.5 |
| 2022 | 127.6 | 105.8 |
| Source: Statistics Canada, Annual Services Industries Program. | ||
The reopening of indoor spaces and reduction of capacity limitations also allowed fitness and recreational sports centres to operate at full capacity for most of 2022, after two years of varying closures and restrictions on operations. This created an increase in revenues of 50.9% and salaries of 31.1%.
With restrictions lifted across the provinces, amusement parks and arcades were also able to open fully for the year, for the first time since the onset of the pandemic. After a partial operating year in 2021, with restrictions varying across provinces, the industry saw significant revenue growth of 71.1% in 2022, while salaries increased by 41.7%. All other amusement and recreation industriesNote also showed significant growth, with revenues increasing by 38.0% and salaries by 29.2% in 2022.
Sound recording industry continues to expand
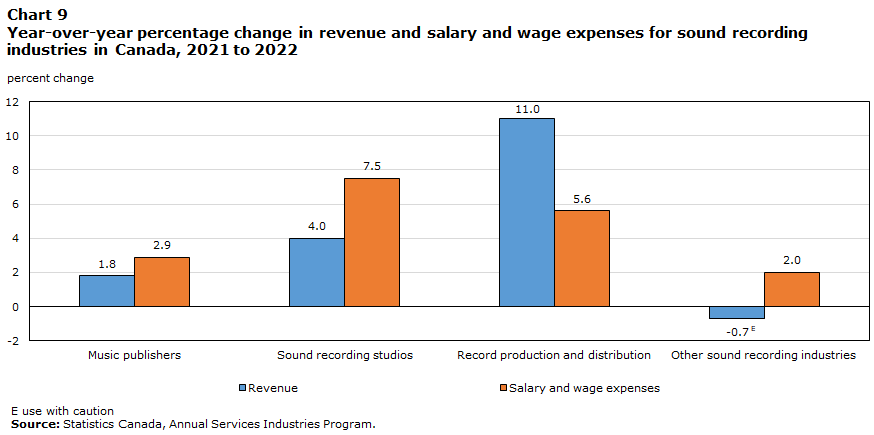
As the only culture industry to experience revenue gains throughout the pandemic in 2020 and 2021,Note the sound recording industry maintained the momentum in 2022, with revenues increasing by 6.6% as an aggregate total. Increased live events and musical performances in 2022 provided additional opportunities for Canadian artists to promote their music, the impact of which was seen across the sound recording industry segments. Many sound recording studios also provide audio post-production services to the film industry, and with the resumption of film projects that had been postponed during the pandemic, more work opportunities were provided for studios. Nevertheless, the industry experienced a range of revenue growth in 2022, from 11.0% in record production and distribution to 4.0% for sound recording studios and 1.8% for music publishers (see Chart 9). Salaries for the industry also increased in 2022 across the sectors.
Data table for Chart 9
| Revenue | Salary and wage expenses | |
|---|---|---|
| percent change | ||
| Music publishers | 1.8 | 2.9 |
| Sound recording studios | 4.0 | 7.5 |
| Record production and distribution | 11.0 | 5.6 |
| Other sound recording industries | -0.7Note E: Use with caution | 2.0 |
|
E use with caution Source: Statistics Canada, Annual Services Industries Program. |
||
Conclusions and future outlook
Industries across the culture, arts, entertainment and recreation services will continue to see recovery from the pandemic, which devastated these sectors for two years. With pre-pandemic influences and changed consumer preferences caused by the pandemic, the publishing industries remain the only sector where recovery growth remains elusive for upcoming years. For the other industries, although restrictions have been lifted, a full recovery will be influenced by inflation and the costs of essentials, as well as the discretionary income of households, which could delay the full return of revenues to pre-pandemic levels for these industries.
Data and methods
The analysis of the GST and PD7 data helps identify business trends before actual survey estimates are compiled. After validation, the GST data and PD7 data for several service industries provided a fairly accurate representation of revenue and salaries and wage expenses. However, users should be aware that the GST data only represent sales made by companies. For some industries in the culture sector, a significant portion of their revenue is generated from grants, donations, fundraising and sponsorships and is therefore not included in the GST data. In addition, companies with revenue of less than $30,000 per year are not required to report GST. Exports of goods and services are also generally exempt from GST.
Financial data for industry groupings, including operating revenue and salaries, wages, and benefits statistics, are usually obtained through detailed annual business surveys. The official estimates for the culture sector that will be released for reference year 2022—which will be based on a more complete set of survey and administrative data—are scheduled for release between October 3, 2023, and March 1, 2024.
- Date modified: