
Analysis in Brief
Adjusting to life in a pandemic: Embracing culture, arts and other leisure services in 2021
Skip to text
Text begins
Acknowledgements
The authors would like to thank the Recreation and Culture Industries Section of the Annual Services Industries Program for their helpful guidance in the analysis.
The culture, arts, entertainment and recreation industriesNote bounced back in 2021 from the large declines seen in the first year of the pandemic. However, the nature and timing of pandemic restrictions and closures, as well as weather conditions in some instances, had an impact on the recovery. With the push for vaccinations early in the year, there was anticipation that industries would be able to operate at higher levels of capacity in 2021 compared with the previous year of pandemic closures. Despite business resilience and consumers embracing culture, arts and other leisure activities, provincial restrictions, including mandates against gatherings, interprovincial travel, and non-essential business closures continued to impact business operations in 2021.
To provide a first glance at the financial implications of the pandemic in 2021 on the culture, arts, entertainment and recreation sectors, this study examined alternative datasets that allow for more timely financial estimates, before annual business survey estimates are available. Following the review, data from the goods and services tax (GST) sales and payroll deduction (PD7) files were historically comparable for most service-producing industries and acted as a coherent proxy for preliminary estimates of operating revenue and salary, wage, commission and benefit expenses for 2021.
Most industries were able to operate more in 2021, leading to a turnaround in both revenues and salary expenses across the majority of these industries (see Chart 1). Strong revenue growth was observed in some hard-hit sectors such as motion picture theatres, amusement and recreation industries, spectator sports, event promoters, artists, and related industries. The weakest revenue growth in 2021 was observed in the publishing industries and the film and video distribution industry.

Data table for Chart 1
| Revenue | Salaries, wages, commissions and benefits | |
|---|---|---|
| percent change | ||
| Other amusement and recreation industries | 22.5 | 15 |
| Amusement parks and arcades | 111.2 | 28.8 |
| Agents and managers for artists, athletes, entertainers and other public figures | 43.9 | 9.5 |
| Promoters (presenters) of performing arts, sports and similar events | 24.3 | 4.7 |
| Spectator sports | 59 | 6.4 |
| Performing arts companies (not-for-profit) | 15.7 | 5.9 |
| Performing arts companies (for-profit) | 11.5 | -11.7 |
| Sound recording | 10.5 | 8.5 |
| Film, Television and Video Production | x | 55.3 |
| Film, Television and Video Post-Production | 25.9 | 13.6 |
| Film and video distribution | 0.3 | 8.1 |
| Motion picture theatres | 60 | 25.9 |
| Book publishers | 2.3 | 2.3 |
| Periodical publishers | 3.5 | 4.4 |
| Newspaper publishers | 1.5 | -2.8 |
|
x suppressed Source: Statistics Canada, Annual Services Industries Program. |
||
Assessing the state of the recovery
In 2021, many culture, arts, entertainment and recreation businesses experienced recovery as restrictions related to the pandemic were eased across the country, yet the extent of the recovery varied greatly across industries. Only three industries (film, television and video post-production; sound recording and music publishing; and golf courses and country clubs) have fully recovered (see Chart 2), with revenues in 2021 exceeding pre-pandemic 2019 levels. The following sections of the study will elaborate on factors that prevented a broader recovery among the culture, arts, entertainment and recreation sectors.

Data table for Chart 2
| percent change | |
|---|---|
| Performing arts companies (for-profit) | -59.7 |
| Promoters (presenters) of performing arts, sports and similar events | -54.8 |
| Performing arts companies (not-for-profit) | -54.6 |
| Motion picture theatres | -50.7 |
| Fitness and recreational sports centres | -38.6 |
| Amusement parks and arcades | -31.8 |
| Skiing facilities | -24.6 |
| Spectator sports | -23.7 |
| Periodical publishers | -20.9 |
| Newspaper publishers | -19.4 |
| Other amusement and recreation industries | -18.7 |
| Agents and managers for artists, athletes, entertainers and other public figures | -18.8 |
| Film and video distribution | -14.9 |
| Book publishers | -3.3 |
| Film, television and video post-production | 10.5 |
| Sound recording | 11.2 |
| Golf courses and country clubs | 13.4 |
| Source: Statistics Canada, Annual Services Industries Program. | |
A look at financial estimates for the culture sector in 2021
Book publishers adapting through the pandemic
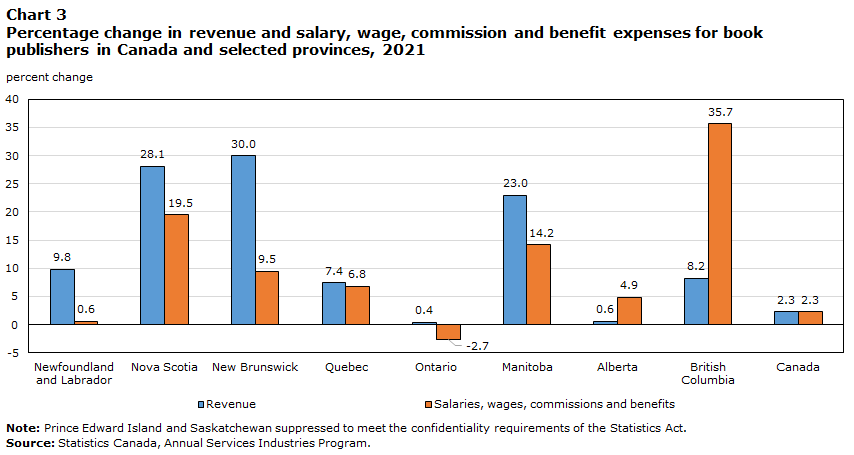
Book publishers had higher revenue in 2021 (up 2.3%) compared with 2020. The industry has not yet reached the level of revenue seen before the pandemic, but it is not far off. A similar trend was observed for salaries in 2021, with an estimated increase of 2.3%. Though lockdowns and more time spent at home bolstered readership and benefited the industry, it was also negatively impacted in other ways by successive waves of the pandemic. Many sectors of the Canadian economy grappled with supply chain disruptions, and book publishers were not spared, with printing and shipping issues constraining the recovery of the industry. Yet, the industry continued to advance through the pandemic with innovations and greater reliance on point-of-sale software and virtual online event series.Note All provinces experienced growth in revenue in 2021 while just one province, Ontario, had yet to see an increase in salaries (see Chart 3).
Data table for Chart 3
| Revenue | Salaries, wages, commissions and benefits | |
|---|---|---|
| percent change | ||
| Newfoundland and Labrador | 9.8 | 0.6 |
| Nova Scotia | 28.1 | 19.5 |
| New Brunswick | 30.0 | 9.5 |
| Quebec | 7.4 | 6.8 |
| Ontario | 0.4 | -2.7 |
| Manitoba | 23.0 | 14.2 |
| Alberta | 0.6 | 4.9 |
| British Columbia | 8.2 | 35.7 |
| Canada | 2.3 | 2.3 |
|
Note: Prince Edward Island and Saskatchewan suppressed to meet the confidentiality requirements of the Statistics Act Source: Statistics Canada, Annual Services Industries Program. |
||
Newspaper and periodical publishers: Subdued growth in 2021
The difficulties facing the newspaper industries stretch well beyond the pandemic. Hundreds of news outlets shuttered operations in recent years and many more print and online news sources had to do the same during the pandemic. Demand for advertising (especially print advertising) has been coming down and fell more rapidly in 2020, representing an increasingly smaller share of industry sales.Note With revenues steadily falling, newspaper publishers had begun to change their business model before the pandemic. Some put resources into new endeavours, such as advertising and marketing services, web design, trade shows, packaging and distribution, podcasting, and online gaming services. Note Lost advertising revenue because of the pandemic further accelerated these trends. Revenues in the newspaper publishers industry are estimated to have grown by only 1.5% in 2021. Consistent with trends from before the pandemic, payrolls continued to contract as salaries are estimated to have declined by 2.8% in the same year. Similarly, periodical publishers’ revenues bounced back by a moderate 3.5% in 2021, but their labour-related expenses increased at a slightly faster pace of 4.4% (see Chart 4).

Data table for Chart 4
| Revenue | Salaries, wages, commissions and benefits | |
|---|---|---|
| Percent change | ||
| Newspaper publishers | 1.5 | -2.8 |
| Periodical publishers | 3.5 | 4.4 |
| Source: Statistics Canada, Annual Services Industries Program. | ||
Film industry regains its footing in 2021
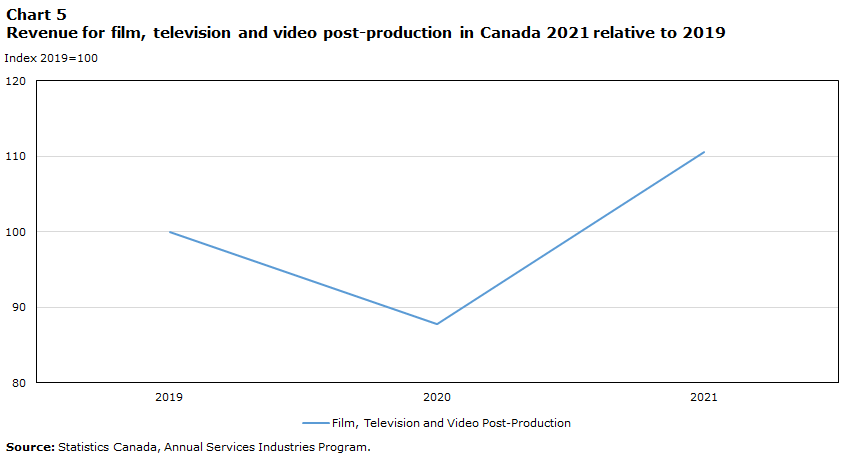
The film industry also saw stronger revenues and higher salaries in 2021.Note The film, television and video post-production industry experienced strong revenue growth (25.9%) in 2021 that exceeded pre-pandemic levels (see Chart 5). This industry also had salaries increase 13.6% in 2021. Strict health and safety measures also helped the film, television and video production industry operate at higher levels of capacity in many areas of the country,Note with salary expenses increasing 55.3% in 2021. Furthermore, fiscal measures such as the Short-Term Compensation Fund for Canadian audiovisual productions and other measures (tax credits, removals of funding caps, government-funded insurance) combined with expansions in production capacity helped the film, television and video production and post-production industries operate through the second year of the pandemic.Note
Data table for Chart 5
| Film, Television and Video Post-Production | |
|---|---|
| Index 2019=100 | |
| 2020 | 87.8 |
| 2021 | 110.5 |
| Source: Statistics Canada, Annual Services Industries Program. | |
Sound recording and music publishing industries benefit from music streaming
The sound recording and music publishing industries were affected by the COVID-19 pandemic, although not on the same scale as most other cultural industries in Canada. In fact, the sound recording and music publishing industries as an aggregate were the only industry of the culture sector not to experience a decline in their revenues over the first two years of the pandemic. The sound recording industries, segmented into record production and distribution, music publishers, sound recording studios, and other sound recording industries, all experienced growth in revenue and salaries in 2021 (see Chart 6). With people spending more time at home for work and entertainment during the pandemic, music streaming grew and was key to the industry’s growth. Note

Data table for Chart 6
| Revenue | Salaries, wages, commissions and benefits | |
|---|---|---|
| percent change | ||
| Music publishers | 5.7 | 10.9 |
| Sound recording studios | 7.2 | 2.9 |
| Record production and distribution | 14.8 | 9.2 |
| Other sound recording industries | 15.5 | 7.2 |
| Source: Statistics Canada, Annual Services Industries Program. | ||
Seasonal challenges impact recovery in 2021 for the amusement and recreation sector
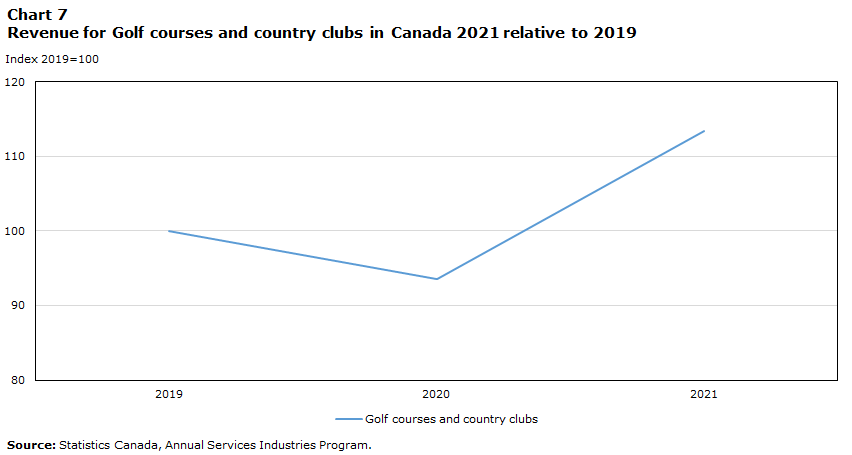
Industries that were able to rapidly adapt to changing pandemic restrictions and maintain outdoor operations saw stronger growth in 2021 compared with those whose activities were primarily indoor or reliant on factors such as weather conditions. As many restrictions eased throughout the summer, industries normally at their busiest at this time benefited, such as golf courses and country clubs, which saw revenue increases of 21.3% in 2021, with strong growth across all provinces. With golf participation reaching new highs in 2020,Note the golf industry benefited from the momentum and a long 2021 season, which extended until the late fall because of good weather. The industry had higher revenue levels in 2021 than those seen pre-pandemic in 2019 (see Chart 7).
Data table for Chart 7
| Golf courses and country clubs | |
|---|---|
| Index 2019=100 | |
| 2020 | 93.5 |
| 2021 | 113.4 |
| Source: Statistics Canada, Annual Services Industries Program. | |
Another industry able to benefit from the easing of restrictions in the spring and summer seasons was the amusement parks and arcades industry, where revenues are estimated to have increased 111.2% in 2021, though they remained significantly below pre-pandemic levels. After remaining closed or operating at limited capacity for the majority of 2020, businesses in this industry were able to reopen across the country throughout the summer of 2021, though with reduced capacity and other distancing restrictions in place. Avoiding business disruptions throughout their busiest season also resulted in increased salaries for this industry group, up 28.8% from 2020.
Other industries with peak seasons outside of the summer, such as skiing facilities, were negatively impacted by heavier restrictions earlier in the year, resulting in revenue declines of 2.4% in 2021. Varying provincial restrictions across the country also impacted revenues in the skiing industry, where provinces with less stringent restrictions on the industry such as Quebec (+14.7%) propped up the industry (see Chart 8). Similarly, businesses operating primarily indoors were impacted by non-essential business shutdowns, such as fitness and recreational sports centres, which saw modest revenue gains in 2021 (+1.9%). Salary expenses also reflected the seasonal nature of these industries, with golf courses and country club salaries increasing 17.3%, while wages at skiing facilities (+0.4%) and fitness and recreational sports centres (+0.4%) remained relatively unchanged from 2020.

Data table for Chart 8
| Golf courses and country clubs (713910) | Skiing facilities (713920) | |
|---|---|---|
| percent change | ||
| Prince Edward Island |
16.1 | 0 |
| Nova Scotia |
16.9 | 22.4 |
| New Brunswick |
31.2 | 19.2 |
| Quebec | 30 | 14.7 |
| Ontario | 18 | -8.9 |
| Manitoba | 16.3 | -9.7 |
| Saskatchewan | 26.2 | -5.4 |
| Alberta | 18.5 | -1.9 |
| British Columbia |
25.6 | -13.6 |
| Canada | 21.3 | -2.4 |
|
Note: Newfoundland and Labrador and Prince Edward Island suppressed to meet the confidentiality requirements of the Statistics Act Source: Statistics Canada, Annual Services Industries Program. |
||
Rolling restrictions result in partial recovery in arts and entertainment sectors
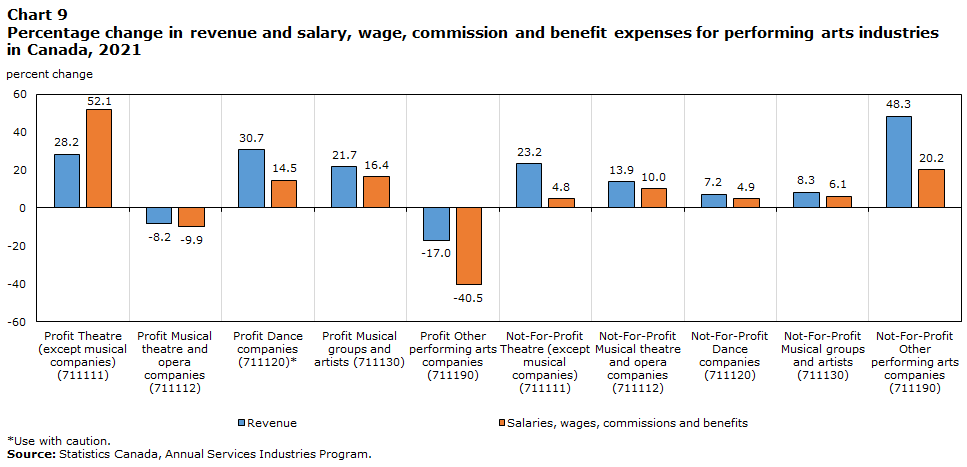
The performing arts industries remained heavily impacted by provincial closures and capacity restrictions in 2021, with revenues in the for-profit sector increasing 11.5% and the not-for-profit sector increasing 15.7%. With the rolling restrictions in place during 2021, many performing arts businesses were hopeful to reopen by late summer or early fall in line with provincial guidelines. However, because of additional provincial restrictions at the end of the year, such as mandated seating capacity and social distancing constraints, the industry was once again hit hard in the 2021 holiday season, preventing any significant recovery.
Some businesses continued to use alternatives to in-person shows as a way to reach audiences from a distance throughout the year such as digital performances, subscriptions and webcasts, as seen from the expanding e-commerce sales within the industry, which reached 23.9% of all sales revenues in 2020.Note This, paired with the allowance of small shows created varied success across the performing arts industries, with moderate revenue gains in the theatre industry (for-profit up 28.2%, not-for-profit up 23.2%), and for-profit musical groups and artists (+21.7%), while further losses were seen in for-profit musical theatre and opera companies (-8.3%) and for-profit other performing arts companies (-17.0%) (see Chart 9).
Data table for Chart 9
| Revenue | Salaries, wages, commissions and benefits | |
|---|---|---|
| percent change | ||
| Profit Theatre (except musical companies) (711111) | 28.2 | 52.1 |
| Profit Musical theatre and opera companies (711112) | -8.2 | -9.9 |
| Profit Dance companies (711120)* | 30.7 | 14.5 |
| Profit Musical groups and artists (711130) | 21.7 | 16.4 |
| Profit Other performing arts companies (711190) | -17.0 | -40.5 |
| Not-For-Profit Theatre (except musical companies) (711111) | 23.2 | 4.8 |
| Not-For-Profit Musical theatre and opera companies (711112) | 13.9 | 10.0 |
| Not-For-Profit Dance companies (711120) | 7.2 | 4.9 |
| Not-For-Profit Musical groups and artists (711130) | 8.3 | 6.1 |
| Not-For-Profit Other performing arts companies (711190) | 48.3 | 20.2 |
|
* Use with caution Source: Statistics Canada, Annual Services Industries Program. |
||
After the pandemic devastated the spectator sports industry in 2020, many sports leagues were able to return to play in 2021 under strict guidelines by the leagues that saw fans return to arenas and audiences in limited capacities towards the end of the year. As a result, the industry experienced a significant bounce back with revenues up 59.0% from 2020, though still well below pre-pandemic levels. The return of sporting events and other large public events within the second year of the pandemic also had a significant impact on the revenues for agents and managers for artists, athletes, entertainers and other public figures (+43.9%) and the promoters (presenters) of performing arts, sports and similar events (+24.3%). Salaries in these industries also grew, with spectator sports increasing 6.4%, agents and managers 9.5%, and promoters 4.7%.
After financial strain in 2020 and being closed for the majority of the year, most motion picture theatres continued to be heavily impacted in the second year of the pandemic. Although motion picture theatres were able to open in spring or early summer of 2021, conditions were not favourable for recovery in the industry because of provincial closures and capacity restrictions. These factors hindered any significant return to pre-pandemic levels, with revenues in 2021 only about half of those attained in 2019 (see Chart 10).
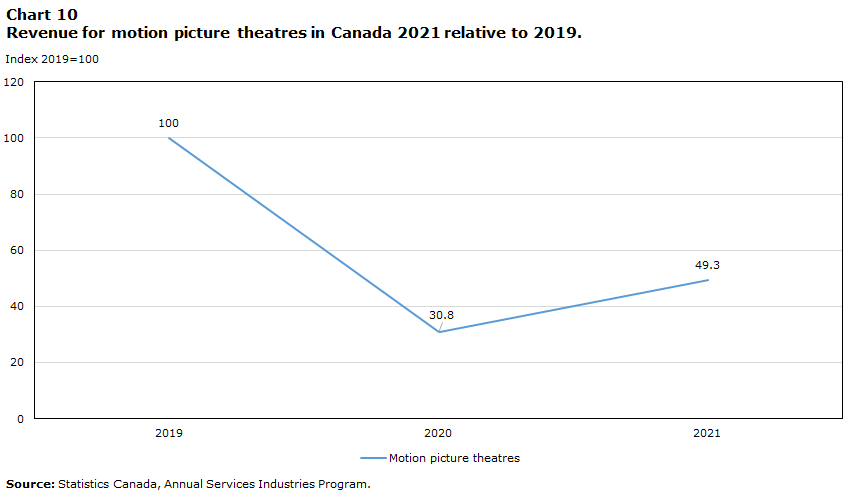
Data table for Chart 10
| Motion picture theatres | |
|---|---|
| Index 2019=100 | |
| 2020 | 30.8 |
| 2021 | 49.3 |
| Source: Statistics Canada, Annual Services Industries Program. | |
Final thoughts
As the recovery progresses, many businesses in the Canadian economy, including in the arts, culture, entertainment and recreation sectors, are contending with risks associated with inflationary price and wage pressures, external geopolitical factors, and labour constraints. As most pandemic restrictions have been lifted, soaring consumer prices on essentials and tightening monetary policy could limit household discretionary spending on leisure activities and services, which could further delay a full recovery in some of the service industries hit hardest by the pandemic.
Data and methods
The analysis of the GST data helps identify business trends before actual survey estimates are compiled.Note After validation, the GST data for several service industries provided a fairly accurate representation of operating revenue, a key input into the measurement of economic statistics such as the gross domestic product.Note Similar to the first year of the pandemic, comprehensive public assistance programs provided support to selected businesses in the service sector in 2021.Note While that financial assistance would be accounted for in operating revenues, it is not reflected in GST revenue remittances, and as such, was not part of this analysis.
- Date modified: